OpenTelemetry (OTLP) Integration
Stream Load Test Metrics over OpenTelemetry
The OpenTelemetry integration exports your live load test metrics over the OpenTelemetry Protocol (OTLP) to any OTLP-compatible backend, so you can watch a test in the same tool you already use for observability. It works with Honeycomb, Grafana Cloud, New Relic, Datadog, Elastic, and any self-hosted OpenTelemetry Collector.
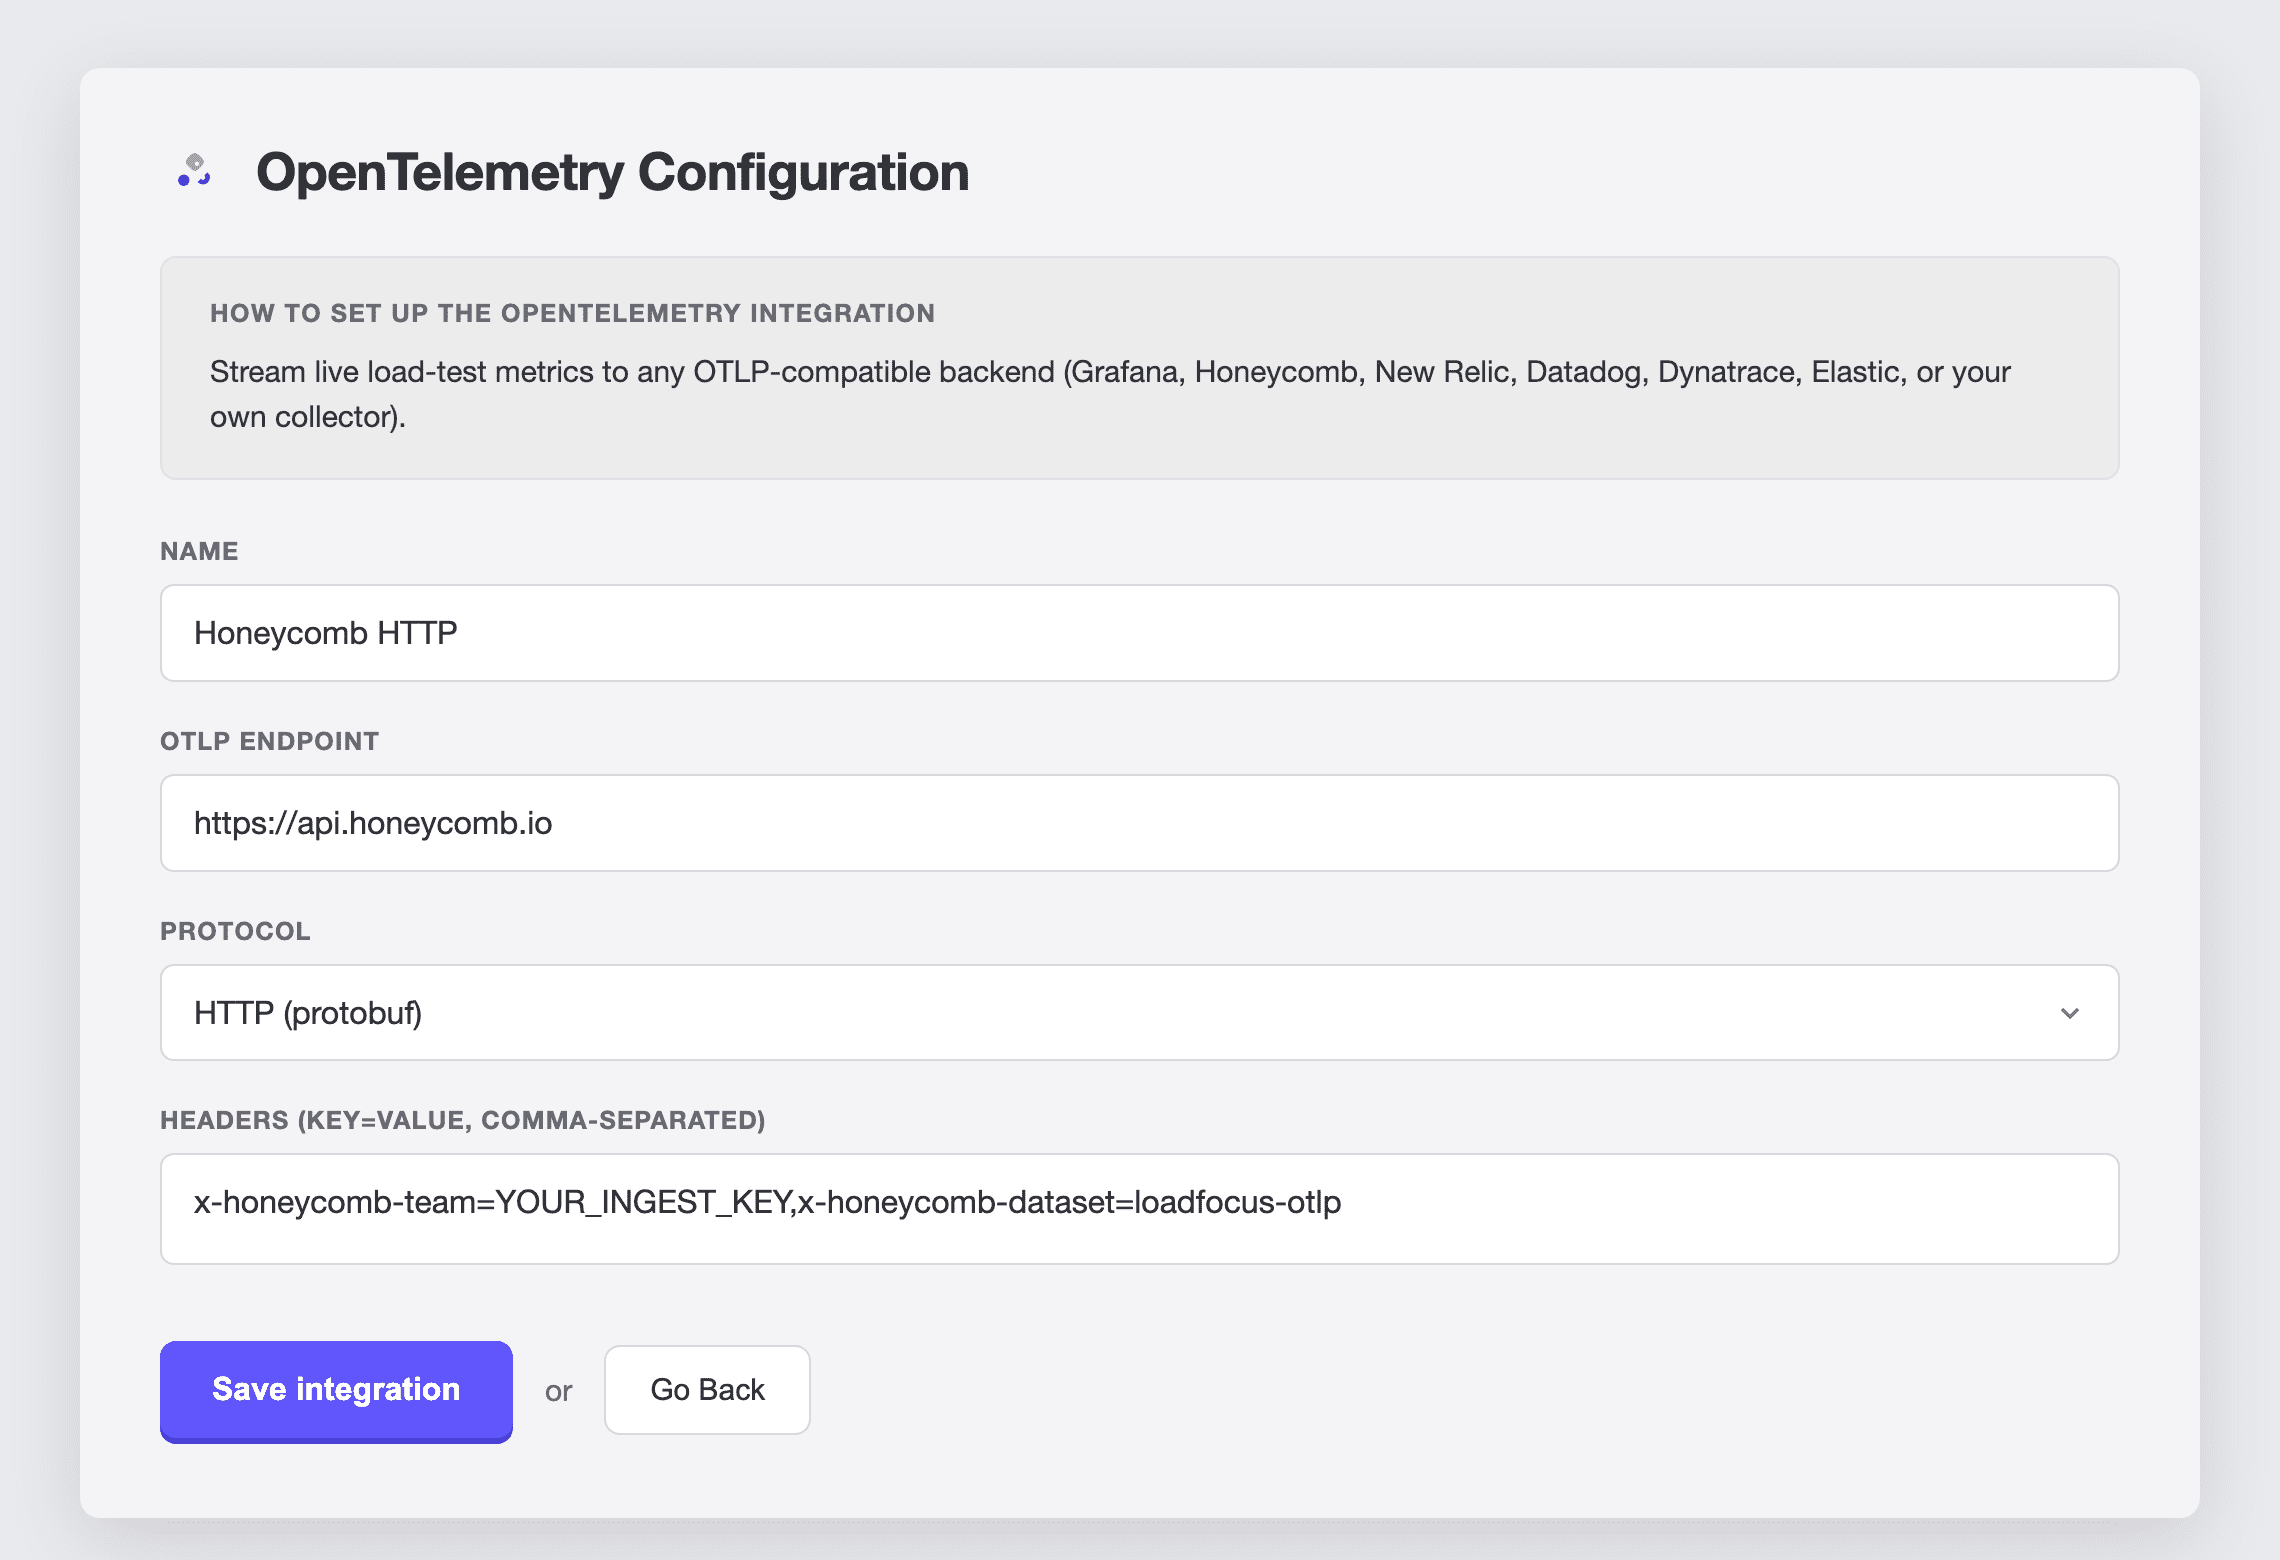
Create the Integration
- Go to
Account>Integration Settings. - Click
New Integrationand chooseOpenTelemetry. - Fill in the fields below and click
Save integration.
Integration Fields
- Name: A label for this integration, for example
Honeycomb HTTP. - OTLP Endpoint: Where metrics are sent.
- For HTTP (protobuf), use the base URL including the scheme, for example
https://api.honeycomb.io. LoadFocus appends/v1/metricsfor you. - For gRPC, use
host:port, for exampleapi.honeycomb.io:443. If you omit the scheme,https://is assumed.
- For HTTP (protobuf), use the base URL including the scheme, for example
- Protocol:
HTTP (protobuf)(the default, works everywhere) orgRPC. - Headers: Comma-separated
key=valuepairs used for authentication, for exampleapi-key=YOUR_KEY,x-tenant=team. This is the only secret field and is stored encrypted.
Endpoints and Headers by Backend
| Backend | Endpoint (HTTP) | Endpoint (gRPC) | Headers |
|---|---|---|---|
| Honeycomb | https://api.honeycomb.io | api.honeycomb.io:443 | x-honeycomb-team=INGEST_KEY,x-honeycomb-dataset=DATASET_NAME |
| Grafana Cloud | your stack's OTLP gateway URL | not offered on the hosted gateway | Authorization=Basic BASE64(instanceID:token) |
| New Relic | https://otlp.nr-data.net (US) or https://otlp.eu01.nr-data.net (EU) | otlp.nr-data.net:4317 | api-key=LICENSE_KEY |
| Elastic | your APM server OTLP URL | your APM server host:8200 | Authorization=ApiKey API_KEY |
| Self-hosted collector | http(s)://your-collector:4318 | your-collector:4317 | optional |
For New Relic and Dynatrace, use the dedicated New Relic and Dynatrace integrations instead. They fill in the endpoint for you, check your key when you save, and send delta metrics. Dynatrace needs delta metrics and drops the cumulative metrics this generic integration sends.
Honeycomb notes
- Use an Ingest Key, created under
Environment Settings>API Keys>Ingest. Copy the Key Secret shown once when you create the key, not the shorter Key ID from the list. Sending the Key ID returnsunknown API key(HTTP 401). - Metrics require the
x-honeycomb-datasetheader to name the dataset they land in. - Give the key the
Can create services/datasetspermission so the dataset is created on the first metrics that arrive.
Attach the Integration to a Test
- Open a JMeter or k6 test and go to its
Integrationssection. - Select your OpenTelemetry integration from the dropdown.
- Save the test, then run it.
Every run tagged with an integration streams its metrics to the configured backend.
What You Will See
Metrics arrive tagged with the resource attributes service.name, loadfocus.testrunname, and loadfocus.testrunid, so you can slice by test run.
- JMeter tests send
jmeter.samples,jmeter.response_time_ms, andjmeter.errors, tagged withsamplerandresponse_code. JMeter batches and flushes at the end of the run, so its metrics appear once the run finishes. - k6 tests send k6's standard metrics such as
http_req_duration,http_reqs,vus, anditerations, streamed while the test runs.
Troubleshooting
unknown API keyor HTTP 401: the credential is wrong or missing. For Honeycomb, confirm you used the Key Secret, not the Key ID.- No data in the backend: confirm the destination name (Honeycomb dataset, New Relic account, and so on), confirm the auth header, and remember that JMeter metrics only appear once the run has finished.
- Endpoint rejected: HTTP endpoints must include the
https://scheme; gRPC endpoints usehost:port. - The run itself is unaffected: if an integration is misconfigured, the test still runs, it simply exports no metrics.
Edit or Remove the Integration
- Edit: in
Integration Settings, click the edit icon on the integration to change the name, endpoint, protocol, or headers. Leave the Headers field blank to keep the existing credential; enter a value only when you want to replace it. - Remove: click the delete icon on the integration to remove it from your external reporting services.