How to Check Load Test Results
We've seen previously how to create a new load test for a website or API endpoint using the UI from the New Load Test page using our cloud load testing tool.
Now let's focus on how to interpret the results of our load test, either a load test for a website, API or web service. The results are similar for load tests ran against websites/APIs and load tests ran with Apache JMeter test scripts.
Overview Load Test Results Page
Let's break down into a granular level the results page of your load test (JMeter load test).
Overview results page
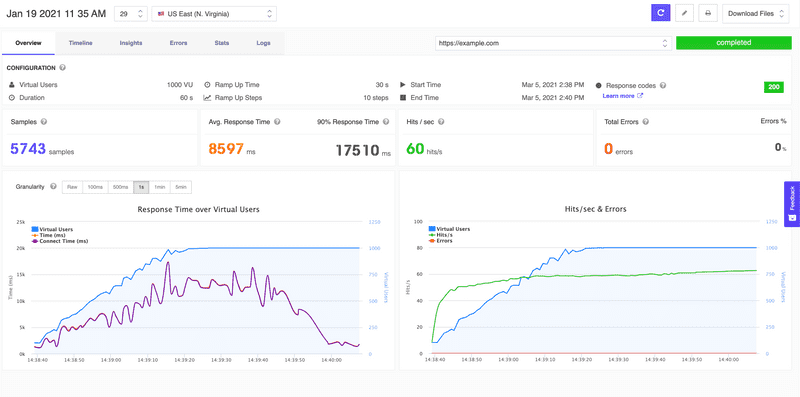
- Test name, test id, test location
In the top left corner of the results page, we have the name of our load test, number of test runs, and the geographical location from where our virtual users accessed our endpoint.
- Re-run test button, Edit test button, Print PDF report button, Download reports and test files dropdown.
In the top right corner of the results page, we have the shortcut buttons to Re-run the current load test, edit the test configuration, Print the PDF report and also Download files related to the current load test configuration and results.
- Re-run test will automatically trigger another run of the current load test. This will spin-off all the cloud instances for re-running the test with the same configuration.
- Edit test will take you to the test configuration page in case you want to change the number of virtual users, duration, ramp up time, ramp up steps, location or the endpoints. The configurations are stored per test run, so even if you change the latest configuration, all test runs will display with their correspondent test configuration. Only the latest test configuration is displayed on the Edit test page.
- Result Tabs
The results page is split into multile tabbed panels for a better understanding of the metrics. There are six tabs which can be accessed to understand the load test results: We'll deep dive into each one of these tabbed panels to understand how to make the most of our load test results.
- Overview
- Timeline
- Insights
- Errors
- Stats
- Logs
- Dropdown list of all endpoints (requests) executed during the load test.
All below metrics and results are related to the selected endpoint (request) URL. If in the load test there are more than one endpoint (request) URL, you can view the results for a different endpoint (request) URL by using the dropdown.
- Test Status
There are a few potential statuses that are visible here:
- running - is displayed if the current load test is still running
- completed - is displayed if the current load test is finished
- aborted - is displayed if the load test was interrupted before completion.
- Configuration
Here you can view the current test configuration, Start & End times and Response Codes Overview. Configuration details per current load test are displayed:
- Virtual Users
- Duration
- Ramp Up Time
- Ramp Up Steps
- Start Time
- End Time
- Response Codes
Current load test configuration is attached per current results and changin the load test configuration will not affect this.
- Overview Results Metrics
- Samples - This represents the total number of requests sent to the server during the duration of the load test.
- Average Response Time - Average Response Time or Mean Response Time represents the amount of time from the moment a user sends a request until the time the application indicates that the request has completed. An Arithmetic mean for all responses (sum of all response times / count), the average value is displayed.
- 90% Response Time - 90% Response Time or 90th Percentile represents the value for which 90% of the responses (data points) are smaller and 10% are bigger, the 90th Percentile Value is displayed.
- Hits/second - Hits/s indicates the number of hits the application suffers every second, the average value is displayed.
- Total Errors - This represents the total errors encountered while running the test against the URL entered (4xx and 5xx response codes or other connection errors), the total value is displayed.
- Errors Percentage (%) - This represents the percentage of errors encountered during the load test out of the total number of samples.
- Result charts
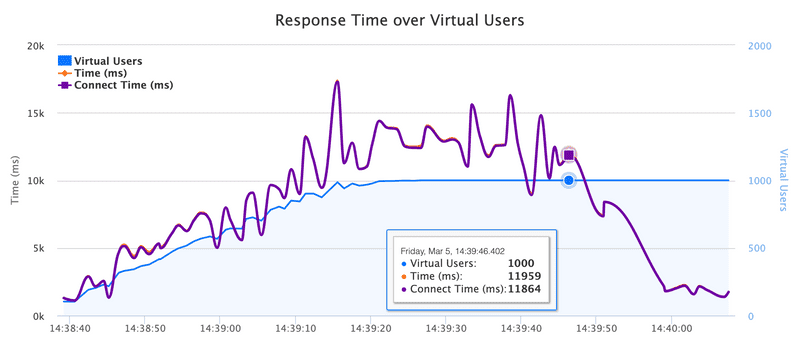
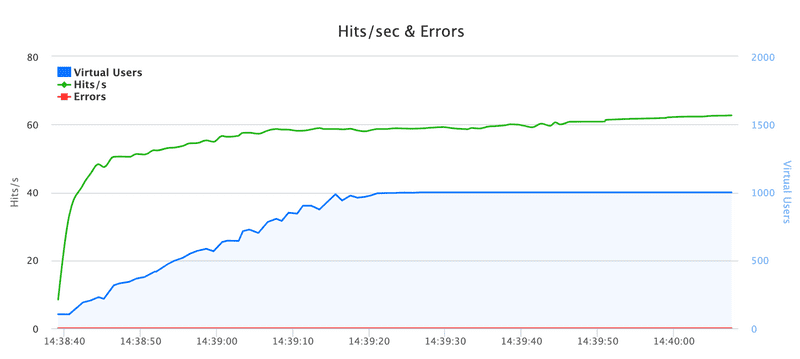
On the overview page there are two charts: Response time over virtual users and Hits/s & Errors over time.
- In the Response time over virtual users chart you can see the response times during the load test. What's interesting to discover in this chart is when, during the load test (how many virtual users are hitting your application), the response time is becoming bigger. You can view the ramp up time and the steps to increase the virtual users to the configured number.
- At the same time, in the Hits/s & Errors over time chart you can inspect the number of hits per second that your application suffers during the load test along with the number of errors and when they appear during the load test.
These two charts are very useful since they point out how your application behaves during the load test, and if there are any bottlenecks/errors while increasing the number of concurrent virtual users.


