Datadog Integration
How to Activate the Datadog Integration
Integrate LoadFocus with Datadog to stream live load test and JMeter test results directly into your Datadog account.
To send live results to Datadog during your tests:
- Navigate to your test in LoadFocus.
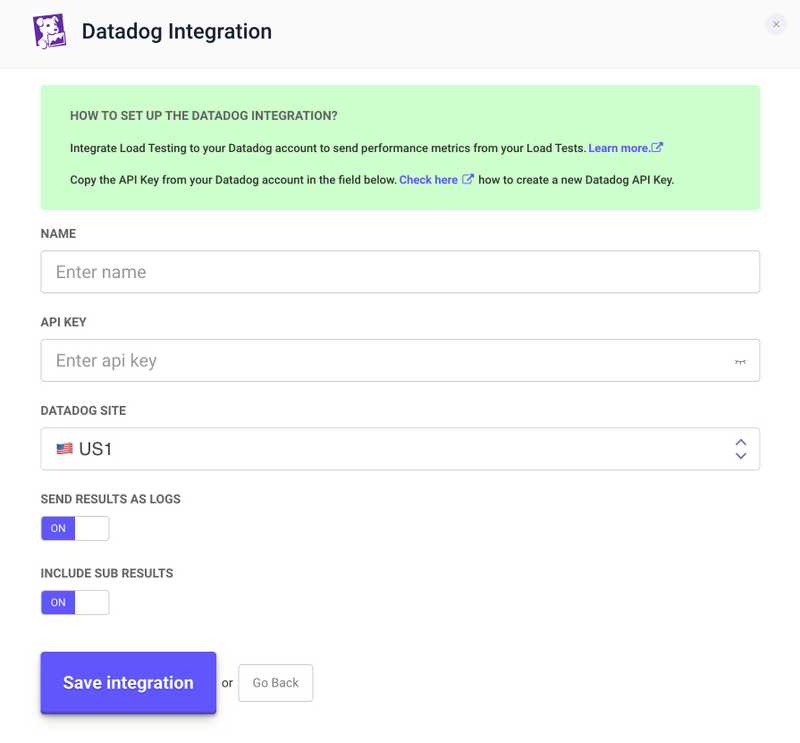
- Create a new Datadog integration.
Integration Fields
- Name: Assign a name to your integration.
- Datadog site: Your Datadog Log intake URL (typically
.comor.eu). - API key: Your Datadog API key.
- Send results as logs: Set to
trueto report individual test results as log events. Default is metrics only. - Include sub-results: Activate to send sub-results. Default is to ignore sub-results.
To generate a Datadog API key, begin by logging into your Datadog account. Navigate to the 'Integrations' section, and select the 'APIs' tab. Here, you'll find the option to create a new API key. Click on 'New API key' and enter a name for your key – this name will help you identify the purpose of the key later on. Once named, click 'Create API key'. Your new API key will be generated and displayed. It's crucial to copy and securely store this key, as it's necessary for integrating with services like LoadFocus and won't be displayed again. For detailed steps and additional information, visit Datadog's API key documentation.
Connect Datadog to Individual Tests
For unique Datadog settings per test (like sending events on some tests and metrics on others):
- Complete the Datadog integration process for each unique setting.
- Enable each connected service on a per-test or per-bucket basis.
Visualize Key Test Metrics
With the integration active, test metrics will stream into a default Datadog dashboard, providing:
- Real-time summaries of total and failed requests, error rates, latency, and response times.
- Insights on application performance thresholds.
Customize your dashboard to correlate test metrics with other monitoring data:
- Add system vitals like CPU and memory graphs.
- Observe resource availability under increased traffic.
- Identify performance regressions due to code changes.
Dive into Individual Test Results with Logs
While metrics reveal patterns and trends, logs provide detailed information on individual test runs:
- Logs are available alongside metrics in the default dashboard.
- Use the Log Explorer to view logs in context and filter specific subsets.
- Analyze logs for error responses or specific latency values.
Start Monitoring Load Test Data Today
Integrate Datadog with LoadFocus for:
- Visualizing and analyzing load testing data.
- Correlating load test results with telemetry across your stack.
- Anticipating and addressing performance issues before production.
Removing Datadog Integration
To disconnect Datadog:
- Go to
Account>Integration Settingsin LoadFocus. - Select the Datadog integration to remove and click
Delete. - The integration is removed from your external reporting services list.

