Load Testing Insights
Understanding the Insights Dashboard
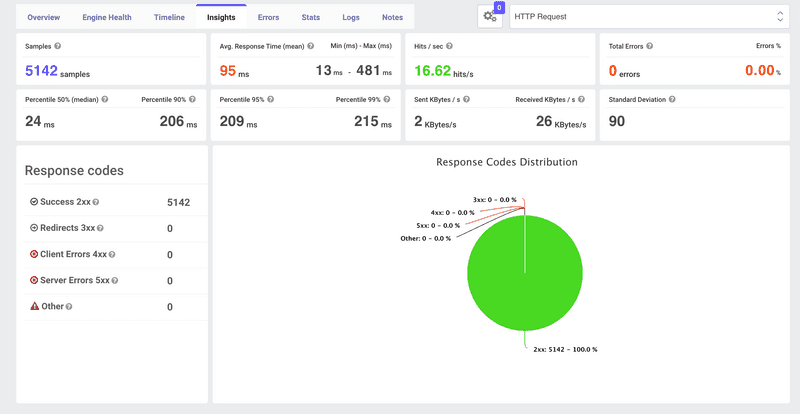
The Insights tab in the LoadFocus test result dashboard provides a high-level statistical summary of your JMeter test run. It aggregates key performance metrics—throughput, response times, error rates, data transfer rates, and response code breakdown—so you can quickly assess test health and user-experience under load.
Key Metrics Explained
Samples Total number of requests (samplers) executed during the test.
Average Response Time Mean time (ms) for all requests.
Min – Max Response Time Fastest and slowest request durations (ms).
Hits/sec (Throughput) Average number of requests per second sent by all engines.
Errors & Error % Total failed requests and their proportion of overall samples.
Percentile 50 & 90 Median and 90th-percentile response times—indicators of typical and upper-bound delays.
Percentile 95 & 99 High-percentile latency at the 95th and 99th percentiles—useful for SLA verification.
Sent / Received KBytes/s Average data upload/download throughput generated by your test.
Standard Deviation Variability in response times—a high value suggests inconsistent performance.
Why Insights Matter
Quick Performance Health Check The Insights view surfaces the most important test metrics at a glance—no need to pore over raw logs or individual samples.
Throughput vs. Latency By comparing Hits/sec with Avg/Percentile response times, you can see if your system maintains latency as load increases.
Error Diagnostics A non-zero Errors % immediately highlights reliability issues. Drill into the Errors tab for failure details.
Data Transfer Patterns Monitoring Sent/Received KBytes/s helps verify that your test is exercising bandwidth-sensitive endpoints correctly (e.g., file uploads/downloads).
How to Use Insights in LoadFocus
- Run Your JMeter Test
Upload your
.jmxfile and configure load agents as usual. - Select the “Insights” Tab After the test completes (or in real time), click Insights in the test result toolbar.
- Choose a Sampler Use the dropdown (e.g., HTTP Request, Database Query) to filter metrics by sampler type.
- Hover for Details Hover over any chart segment—like the chart-based response code pie—to see exact counts and percentages.
Interpreting Your Insights
High Average vs. Low Median If
Avg Response Time≫50th Percentile, a subset of requests is experiencing significant delays. Investigate outliers in the Timeline or Errors views.Throughput Plateau If Hits/sec flattens or drops while virtual users keep increasing, resources may be saturated (see Engine Health Monitoring).
Spiky Standard Deviation Large swings in standard deviation often correlate with external dependencies (third-party APIs, database locks) or garbage collection pauses.
Zero Errors But High Latency No errors don’t always mean “all good.” Prolonged response times will still degrade UX; check server-side logs or profiling data.
Best Practices
Baseline with a Light Load Capture your system’s baseline under a small number of users before ramping up. Compare those numbers against your full-load Insights.
Drill Down by Sampler Use the sampler dropdown to isolate slow or error-prone requests. This helps focus troubleshooting on the right API calls or pages.
Correlate with Other Views Always cross-reference Insights with Engine Health, Timeline, and Errors for a complete picture.
Set Threshold Alerts Configure alerts on key metrics (e.g., p95 > 500 ms, error % > 1%) so you’re notified immediately when tests breach SLAs.
Conclusion
The Insights dashboard in LoadFocus turns raw JMeter results into actionable metrics—helping you rapidly identify performance trends, bottlenecks, and reliability issues. Use it as your first stop in post-test analysis to guide deeper investigation and accelerate optimization.
