Logs & JTL File Analysis
Understanding the Logs Tab
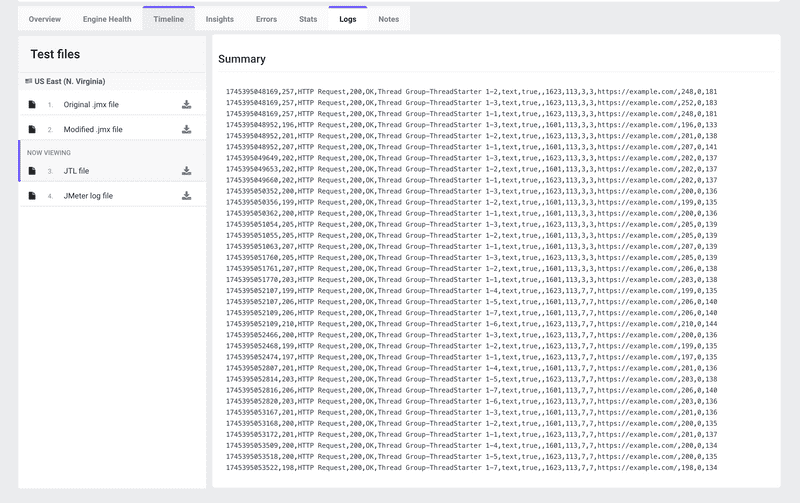
The Logs tab in LoadFocus provides raw output and structured summary data from your JMeter test agents. Here you can:
- Download all test artifacts (original and modified JMX, JTL results, JMeter log files).
- Inspect the raw JTL summary in a scrollable text panel.
- Correlate sample-level details with high-level Insights, Errors, and Timeline views.
Test Files Panel
On the left side you’ll see a Test files list per location (e.g., US East). Each file entry has a download icon:
- Original .jmx file The exact script you uploaded before the run.
- Modified .jmx file Any changes applied by LoadFocus (e.g., injected listeners or remote engine settings).
- .jtl file (JMeter Test Results) The full CSV/ XML results from your test. Contains timestamps, response times, response codes, thread names, labels, and more.
- JMeter log file
The
jmeter.logfrom each engine, capturing warnings, errors, and debug messages.
JTL Summary View
The center panel shows a truncated view of the JTL file. Each line corresponds to a single sampler result, for example: <timeStamp>,<elapsed>,<label>,<responseCode>,<responseMessage>,<threadName>,<dataType>,<success>,<bytes>,<sentBytes>,<grpThreads>,<allThreads>,<URL>,<Latency>,<SampleCount>
timeStamp Epoch milliseconds when the sample started.
elapsed Response time in milliseconds.
label Sampler name (e.g., “HTTP Request”).
responseCode HTTP status code or sampler return code.
success true/false flag indicating pass/fail.
bytes Payload size received in bytes.
URL Target endpoint URL.
Latency Time to first byte in milliseconds.
SampleCount Number of samples this entry represents (usually 1).
How to Use the Logs Data
- Download the JTL Click the download icon next to .jtl file to fetch the full result set for offline analysis.
- Open in External Tools Import the CSV/XML into Excel, Grafana, or your favorite log-analysis platform to pivot, chart, and filter.
- Search & Filter
Use your editor’s find feature (e.g., search by
falsein thesuccesscolumn) to isolate failures. - Correlate with Timestamps Match JTL timestamps against the Timeline or Engine Health charts to see what was happening at that moment.
- Review JMeter Logs
If your JTL shows unusual errors, download and inspect
jmeter.logfor stack traces, GC pauses, or plugin errors.
Best Practices
- Keep JTL Size Manageable
For very large runs, enable JMeter’s sample filter or use
--loglevel.jmeter=ERRORto reduce noise in logs. - Use External Visualization Tools like InfluxDB + Grafana or Apache Superset can turn raw JTL data into interactive dashboards.
- Timestamp Alignment Ensure your local clock and agent clocks are synchronized (NTP) so JTL timestamps align with other metrics.
- Archive Results Store JTL and log files alongside your test configurations for auditability and regression tracking.
Conclusion
The Logs & JTL File Analysis view in LoadFocus gives you full access to both raw and structured test results. By downloading and examining your JMeter artifacts, you can perform deep-dive forensic analysis—correlating every sample, error, and system event to uncover the root cause of performance issues.
