JMeter Log File Analysis
Understanding the JMeter Log File
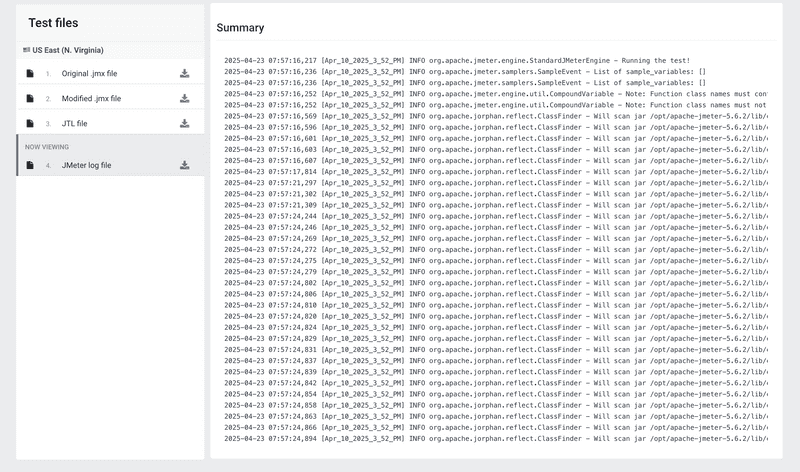
The JMeter log file (jmeter.log) captured from each load engine provides detailed diagnostic output from the JMeter runtime. It includes INFO, WARN, and ERROR messages generated by JMeter core and plugins—crucial for troubleshooting configuration issues, plugin errors, or unexpected runtime behavior.
What’s in the JMeter Log
Each line in the log follows this pattern: <timestamp> [<thread-name>] <level> <logger> – <message>
timestamp Date and time when the log entry was written (e.g., 2025-04-23 07:57:24,894).
thread-name JMeter thread or component that generated the log (e.g., StandardJMeterEngine).
level Log level: INFO, WARN, ERROR, or DEBUG (if enabled).
logger The Java class or package emitting the message (e.g., org.apache.jorphan.reflect).
message The actual diagnostic text describing events, warnings, or errors.
How to Access and Use the JMeter Log
- Navigate to “Logs” In your test result dashboard, select the Logs tab and choose JMeter log file in the Test files panel.
- Scroll and Search
The central panel streams the log content. Use your browser’s search to jump to keywords like
ERRORorWARN. - Download for Offline Analysis
Click the download icon next to JMeter log file to save the complete
jmeter.logfor deeper inspection.
Common Log Entries
- INFO StandardJMeterEngine – Running the test! Marks the start of test execution.
- WARN ConfigTestElement – Missing property ‘foo’ Indicates a missing or malformed JMeter property.
- ERROR HTTPSamplerProxy – Non HTTP response code: 500 Shows HTTP errors surfaced by samplers.
- INFO JOrphanUtils – Will scan jar … Plugin and library loading messages (normal).
- ERROR GC – OutOfMemoryError JVM or plugin memory issues—consider increasing heap or reducing threads.
Troubleshooting with the Log
- Thread Startup Failures
Look for
ERRORentries immediately after the “Running the test!” line—often misconfigured thread groups or missing plugins. - Plugin Load Errors
ClassNotFoundExceptionorNoClassDefFoundErrormessages point to JARs that failed to load on remote engines. - Resource Limits
Out-of-memory or file-handle warnings signal the need to adjust JVM options (
-Xmx,-XX:MaxFileDescriptor). - Latency & Timeout Warnings HTTP sampler timeouts and socket exceptions reveal network connectivity problems between LoadFocus agents and your target.
Best Practices
- Enable Debug Logging Selectively
Only set
log_level.jmeter=DEBUGfor narrow tests to avoid extremely large logs. - Synchronize Clocks Ensure all load agents use NTP so timestamps align across distributed logs.
- Correlate with Other Views Match log timestamps with Engine Health and Errors charts to identify the root cause of spikes or failures.
- Archive Logs
Store your
jmeter.logalongside JTL results for full forensic traceability of each test run.
Conclusion
The JMeter log file in LoadFocus is an essential troubleshooting tool—surface JVM errors, configuration warnings, and plugin issues that aren’t visible in high-level metrics. Regularly inspecting and archiving these logs helps you diagnose elusive test-execution problems and maintain reliable, repeatable load test campaigns.
