Understanding API Check Results
Understanding API Check Results with LoadFocus
After running an API Check, it's crucial to understand and interpret the results to ensure your API's performance and reliability. This section provides a comprehensive guide to understanding the results of an API Check.
Steps to Analyze API Check Results
1. Overview
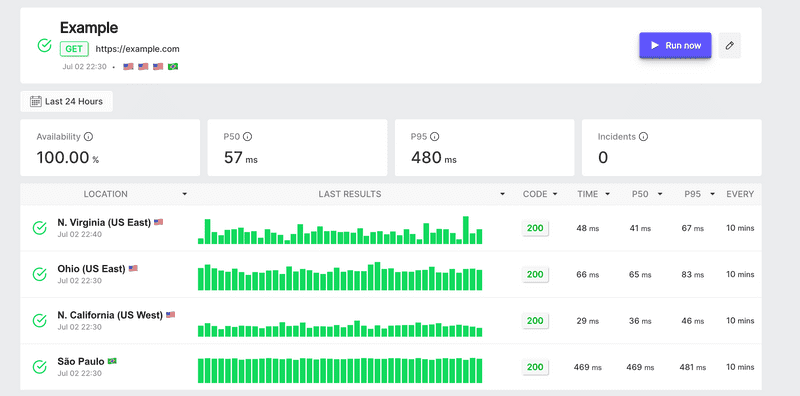
The results dashboard provides a quick summary of the API Check, including the status, response time, and number of checks performed.
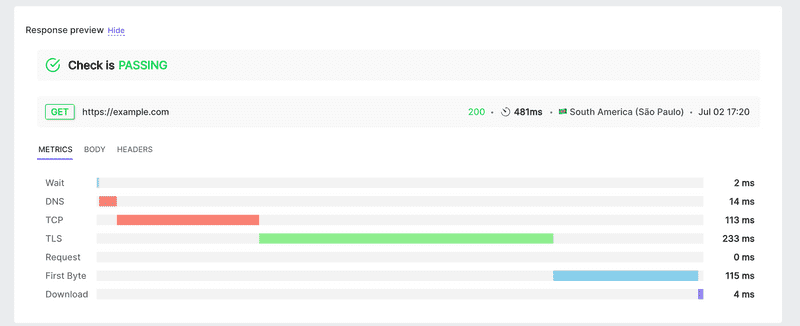
2. Response Time Metrics
View detailed response time metrics to understand the performance of your API. Metrics include:
- Wait
- DNS
- TCP
- First Byte
- Download
These metrics help identify where time is being spent during the API request lifecycle.
3. Status Codes
Check the status codes returned by your API to ensure correct responses. Common status codes include 200 (OK), 404 (Not Found), and 500 (Internal Server Error).
4. Assertions
Review the results of any assertions set during the API Check configuration. Assertions validate the response time, status code, and other response attributes.
5. Error Analysis
Analyze any errors encountered during the API Check. This includes details about failed requests, and error messages if applicable.
6. Location-Based Performance
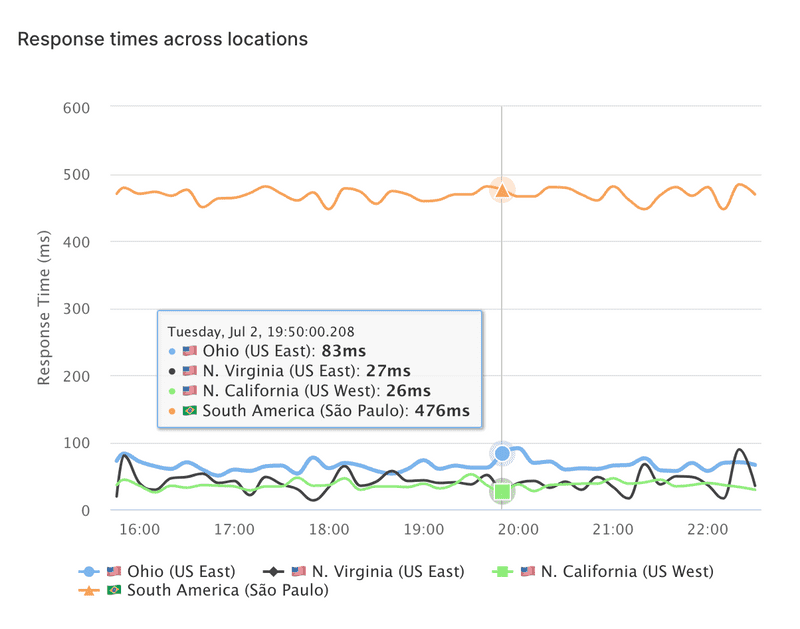
Evaluate the performance of your API across different geographical locations. This helps identify latency issues and regional performance variations. You can set a check to run from more than 26 cloud locations.
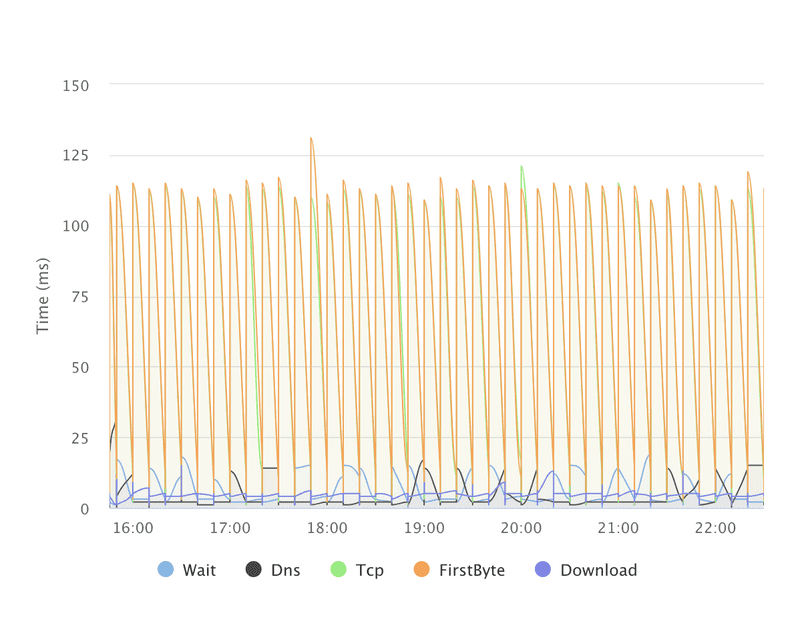
7. Historical Data
Examine historical data to identify trends and patterns in your API's performance over time. Historical data includes:
- Response time for each check from each location.
- Overall results for Wait, DNS, TCP, First Byte, and Download times.
This is useful for spotting long-term issues and performance degradation.
8. Alerts
Review any alerts triggered by the API Check. Alerts can be based on failed assertions, degraded performance, or other criteria set during the configuration.
9. Manually Trigger a Check
You can manually trigger a run of the check from all locations. This allows you to quickly validate the API's performance across different regions without waiting for the scheduled run.
10. Edit API Check
Edit the current API Check to update configurations, change thresholds, or modify request details. This allows for ongoing adjustments based on the performance insights gathered.
11. Filter Results
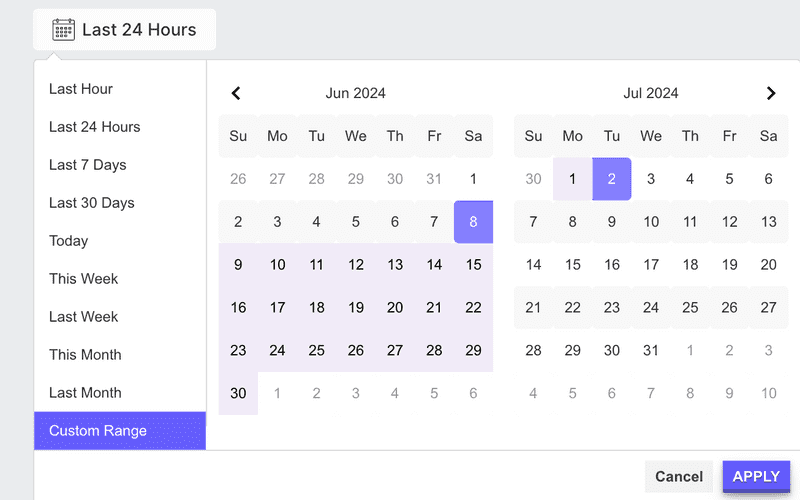
Filter the results based on various time ranges to analyze performance trends and issues over specific periods. Options include:
- Last Hour
- Last 24 Hours
- Last 7 Days
- Last 30 Days
- This Week
- Last Week
- This Month
- Last Month
- Custom Range
By following these steps, you can effectively analyze the results of your API Checks and take necessary actions to ensure optimal performance and reliability.
You can find all your API Check results at the API Monitors page.
