Engine Health Monitoring
Understanding Engine Health
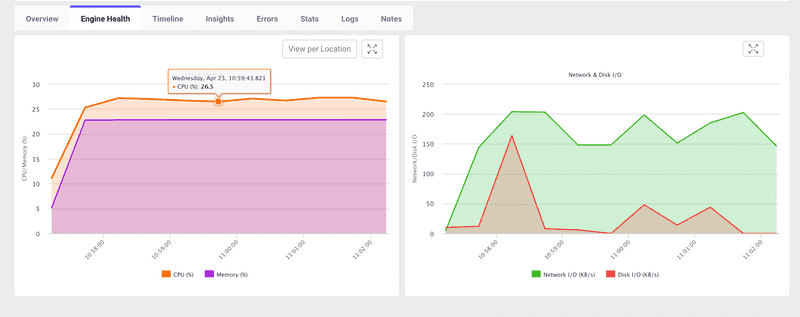
When running your JMeter test files on LoadFocus, it’s crucial to keep an eye on the health of your load engines in real time. The Engine Health view shows you key system-level metrics—CPU, memory, network I/O, and disk I/O—for each of your test agents. Tracking these metrics helps you detect resource saturation, pinpoint bottlenecks, and ensure your load generators are performing as expected.
Metrics Tracked in Real Time
- CPU (%) The percentage of CPU cores utilized by your JMeter engine.
- Memory (%) The proportion of RAM consumed by the JMeter process.
- Network I/O (KB/s) Throughput of data sent and received by the engine over the network.
- Disk I/O (KB/s) Read/write activity on the engine’s file system (e.g., for logging or temporary files).
Why Monitor Engine Health?
Prevent Resource Saturation Engines running at or near 100% CPU or memory can skew test results or even crash, leading to false negatives in your performance analysis.
Identify Bottlenecks Spikes in network or disk I/O may indicate issues with result collection, logging, or infrastructure throttling.
Optimize Test Infrastructure By understanding resource usage patterns, you can right-size your agents—choosing the right instance types or scaling horizontally.
Ensure Test Accuracy Healthy engines deliver consistent load. Any degradation in engine performance can introduce variability into your test, making it harder to draw reliable conclusions.
Where to Find Engine Health in the LoadFocus UI
- Start your JMeter test run as usual.
- Click the Engine Health tab in the test result dashboard.
- Toggle View per Location to see metrics grouped by geographic or cloud region.
- Hover over any point on the graph to display exact values and timestamps.
How to Interpret Engine Health Metrics
- Sustained CPU > 80% Your engine is close to its processing limit. Consider adding more agents or using larger instance types.
- Memory > 85% High memory usage can trigger garbage collection pauses in JMeter. If your test runs long, look at heap tuning or add more RAM.
- Network I/O spikes Sudden jumps may point to large file downloads, logging bursts, or network throttling by your cloud provider.
- Disk I/O peaks Frequent read/write spikes can slow down result collection. Offload logs to a remote store or use faster storage.
Best Practices
- Scale Horizontally Distribute your virtual users across multiple engines to avoid overloading any single machine.
- Baseline Your Agents Run a small pilot test to capture resource baselines before scaling up to full load.
- Correlate with Test Results Always map performance degradations back to engine metrics—don’t assume application servers are solely to blame.
- Externalize Logs Direct JMeter logs to external storage or disable verbose logging to reduce disk I/O overhead.
Conclusion
Real-time Engine Health Monitoring in LoadFocus gives you visibility into the resource utilization of your JMeter agents. By watching CPU, memory, network, and disk I/O metrics, you can proactively detect and resolve infrastructure-related issues—ensuring your load tests remain accurate, reliable, and scalable.
