Request Preview
API Check Request Preview
What is Request Preview?
Request Preview sends your check's request once, from a cloud location you pick, and shows what came back before you save the check. In the new check form, enter the URL and click Preview request. It is a single request, so it shows how one call behaves, not how the API holds up under load. Multistep checks cannot be previewed in the form; open the result page after the first run instead.
Simulate from Multiple Locations
Pick the location in the dropdown next to the preview button. There are 26 to choose from, and it starts on the first location you selected for the check. If you preview from a different location than the check will run from, the form tells you, so a fast preview from one region is not mistaken for what a check in another region will measure. To compare regions, preview the same request again from another location.
Response Time Breakdown
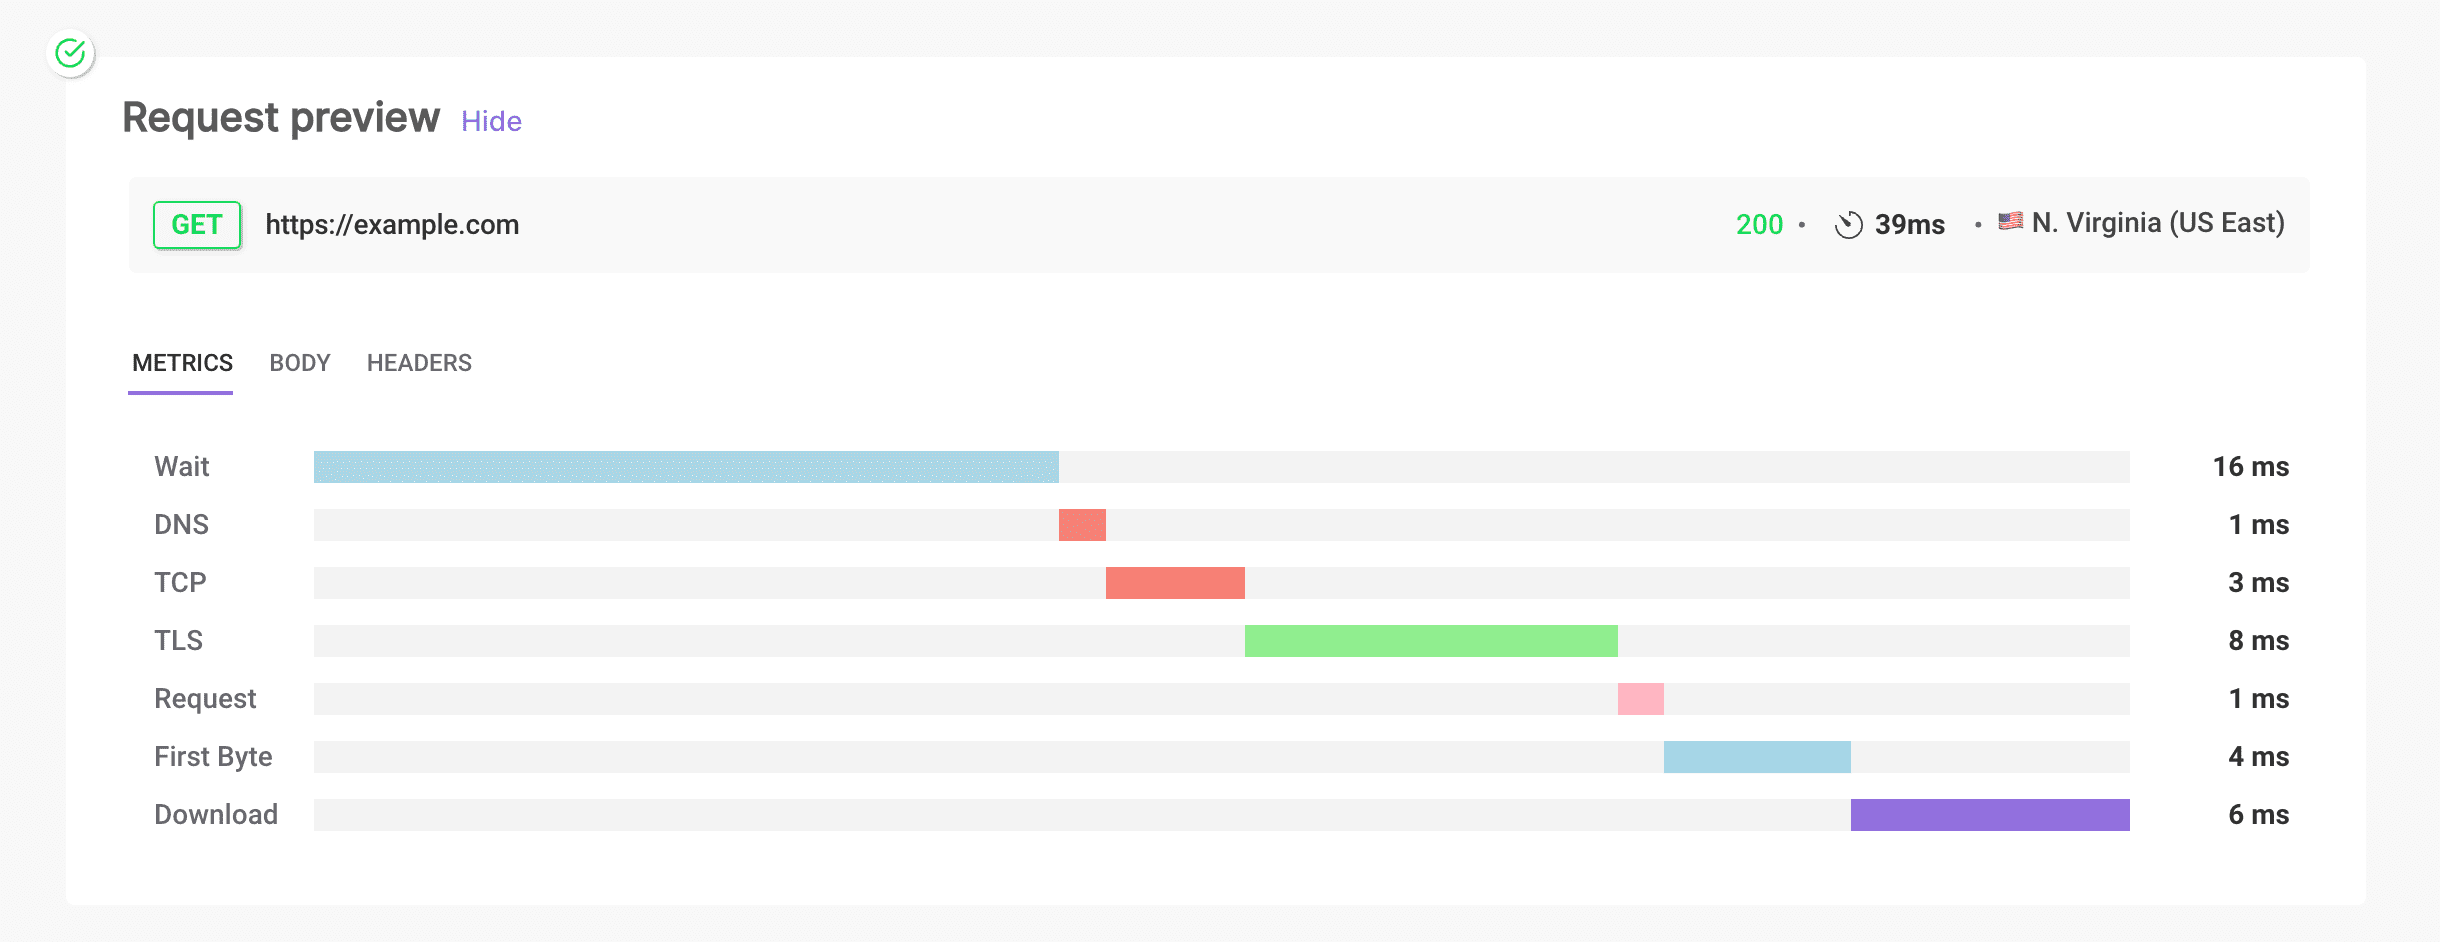
The Metrics tab shows the response time breakdown, one bar per phase with its time in milliseconds, so you can see where the delay is. The phases are:
- Wait: The time spent waiting for the initial server response after the request is sent.
- DNS: The time taken to resolve the domain name into an IP address.
- TCP: The time taken to establish a TCP connection between the client and the server.
- TLS: The time taken to establish a secure TLS connection, if applicable.
- Request: The time taken to send the HTTP request to the server.
- First Byte: The time taken for the server to send the first byte of the response.
- Download: The time taken to download the entire response from the server.
These metrics provide a comprehensive view of the different stages of the request, allowing you to identify specific areas that may need optimization.
Viewing Request and Response Details
The Body tab shows the response body (a long body is collapsed; click Expand to see more). The Headers tab lists:
- Response Headers: all the headers returned by the server.
- Request Headers: all the headers sent with the request.
These headers can be easily copied to the clipboard by clicking on the copy icon next to the header's value, making it easy to share or further analyze the information.
Practical Use Cases
- Latency Analysis: Determine if and where latency is affecting your API performance.
- Debugging: Identify issues in different stages of the request lifecycle (DNS resolution, TCP connection, TLS handshake, etc.).
- Regional Comparison: Preview the same request from two locations and compare the latency.
- Header Validation: Verify that the correct headers are being sent and received.
When the preview looks right, add assertions and save the check.