Error Analysis
Understanding the Errors Report
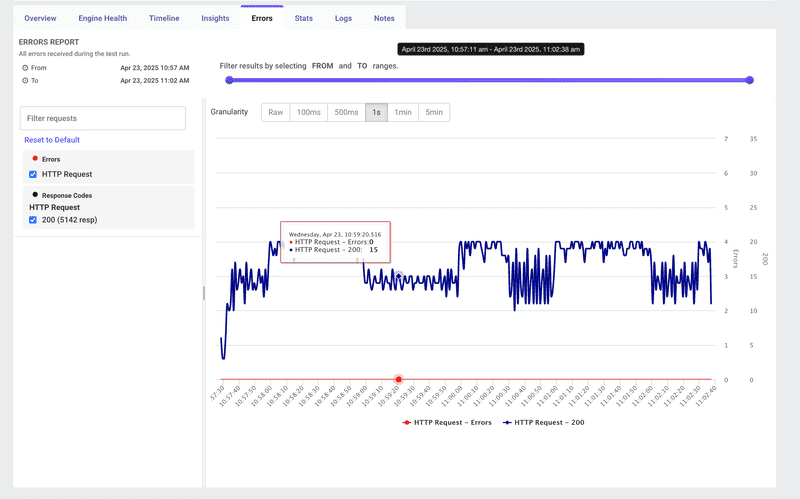
The Errors tab in your LoadFocus test result dashboard shows every failure that occurred during your JMeter load test. It provides a time-series view of error counts alongside successful hits, plus powerful filtering and granularity controls so you can pinpoint exactly when and where your test began to fail.
Key Features
- Error Timeline A combined chart showing Errors (red line/dots) and Successful Hits (blue line) over time.
- Time Range Slider Adjust the FROM/ TO handles to zoom into any interval of your test run.
- Granularity Selector Choose aggregation intervals from Raw, 100 ms, 500 ms, 1 s, 1 min, to 5 min.
- Request & Response Code Filters On the left panel, filter by sampler name (e.g. HTTP Request) and response codes (200, 4xx, 5xx) or by custom error text.
How to Use the Errors Tab
- Run Your Test
Launch your JMeter
.jmxload test on LoadFocus. - Open “Errors” Click the Errors tab in the results toolbar.
- Filter by Time Drag the slider handles at the top to restrict your view to the precise period of interest.
- Select Granularity Pick a granularity that matches your investigation needs (e.g., 1 s for spike detection, 1 min for trending).
- Apply Request Filters Use the left-hand panel to toggle specific samplers or response codes on and off.
- Hover for Details Hover over any point on the graph to see the exact timestamp, error count, and successful hit count.
Interpreting Error Trends
- Isolated Error Spikes A short burst of errors followed by recovery may indicate transient network issues, resource throttling, or external service hiccups.
- Sustained Error Periods Continuous errors suggest systemic problems such as server overload, configuration errors, or capacity limits.
- Error vs. Hit Ratio Compare the red and blue lines: if errors rise while hits/sec (blue) drop or plateau, your system may be rejecting new requests under pressure.
Drilling Down
- View Error Details Click into the Logs tab for full error messages, stack traces, and request payloads.
- Correlate with Engine Health Switch to Engine Health to see if CPU, memory, or I/O saturation coincides with your error spike.
- Check Sampler-Specific Failures Use the sampler dropdown to isolate which HTTP Request, JDBC Query, or custom sampler is failing.
Best Practices
- Set Error Threshold Alerts Configure alerts (e.g. Errors % > 1%) so you’re notified immediately when reliability degrades.
- Baseline Your Environment Run a low-load sanity test to determine your system’s normal error floor—zero errors under light load is the goal.
- Reproduce & Isolate Once you see an error window, re-run that segment with narrower time and request filters to reproduce and capture logs.
- Combine Views Always cross-reference Errors, Insights, Timeline, and Engine Health for a holistic diagnosis.
Conclusion
The Errors dashboard in LoadFocus is your first line of defense against reliability issues during load testing. By filtering, zooming, and correlating error data—alongside success rates—you can rapidly identify, diagnose, and remediate the root causes of test failures.
