Dynatrace Integration
Send Load Test Metrics to Dynatrace
The Dynatrace integration sends the metrics of every LoadFocus test that uses it to your Dynatrace environment over OpenTelemetry (OTLP). You can then chart load test traffic next to the services, hosts and logs Dynatrace already monitors, and see how your application behaves while it is under load. It works with cloud tests, JMeter tests and k6 tests.
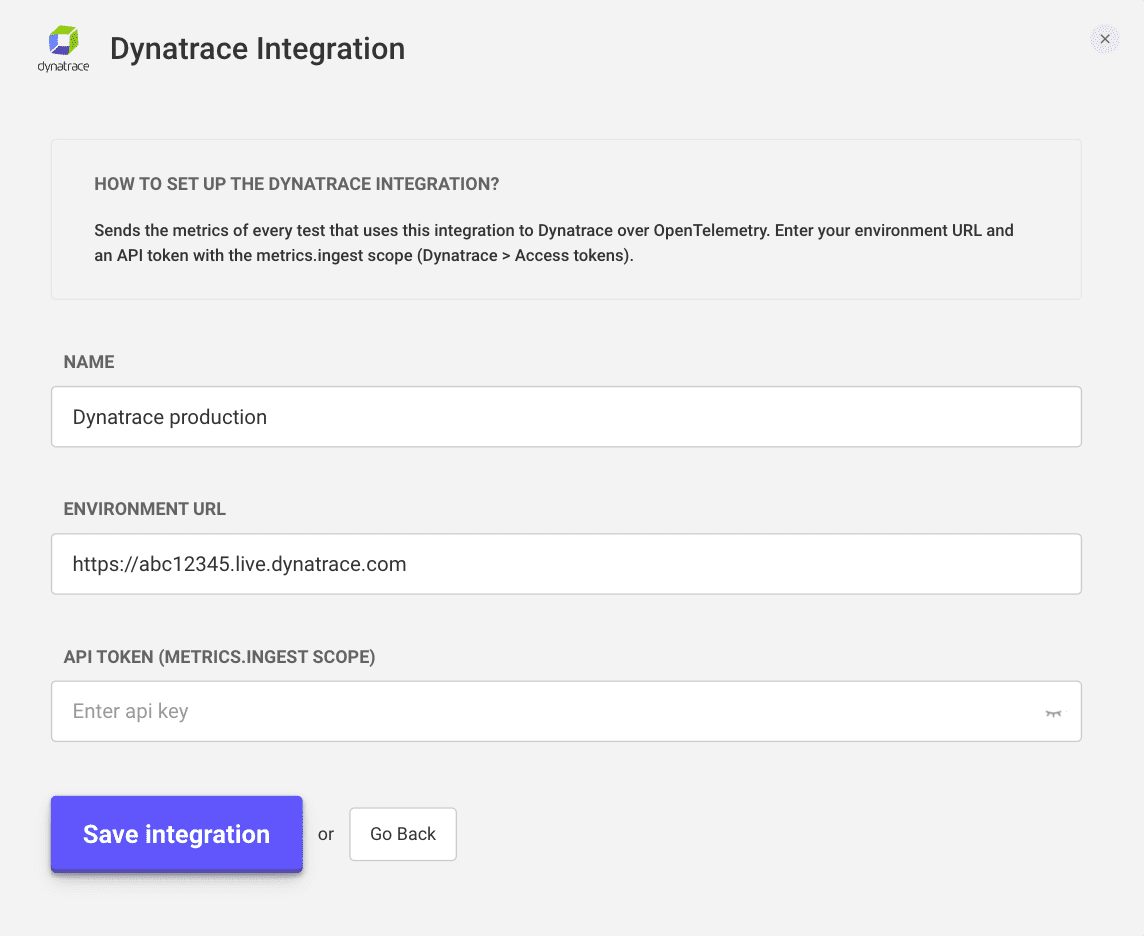
What You Need
- Your environment URL. For Dynatrace SaaS it looks like
https://abc12345.live.dynatrace.com. The address of the new Dynatrace web UI (https://abc12345.apps.dynatrace.com) also works; LoadFocus converts it for you. For Dynatrace Managed, usehttps://your-domain/e/ENVIRONMENT_ID. - An API token with the
metrics.ingestscope. In Dynatrace, go toAccess tokens, clickGenerate new tokenand add theIngest metricsscope (metrics.ingest).
Create the Integration
- Open
Account settings>Integrations, or go to the Integrations page. - Click
New Integrationand chooseDynatrace. - Enter a name, your environment URL and the API token.
- Click
Save integration.
LoadFocus checks the URL and token with Dynatrace before it saves the integration. If Dynatrace does not recognise the environment URL, or rejects the token, the form tells you so under the matching field.
Attach the Integration to a Test
- Open a cloud, JMeter or k6 test.
- In
Integration Configuration, select your Dynatrace integration. - Save or run the test.
Every run that uses the integration shows Exports to: Dynatrace in the configuration panel of its results page.
What You Will See in Dynatrace
LoadFocus sends to your environment's OTLP endpoint (/api/v2/otlp) with delta temporality, which Dynatrace requires for counters and histograms. Every data point carries these dimensions:
service.name:loadfocus-jmeterfor cloud and JMeter tests,k6for k6 testsloadfocus.testrunnameandloadfocus.testrunid: the test and the run they came from
Cloud and JMeter tests send jmeter.samples (requests, by sampler and status), jmeter.response_time_ms (response times, by sampler) and jmeter.errors (failed requests, by sampler and response_code).
k6 tests send k6's standard metrics, such as http_reqs, http_req_duration, iterations and vus.
To find them, search for jmeter or http_req in the Dynatrace metrics browser, or split any of them by loadfocus.testrunname in a notebook or dashboard.
Troubleshooting
- The form says the environment URL was not recognised: copy the URL from your browser's address bar while you are signed in to Dynatrace, and keep only the part before the first path segment (for Managed, keep
/e/ENVIRONMENT_ID). - The form says the token was rejected: generate a token with the
metrics.ingestscope. Tokens without it cannot send metrics. - Nothing shows up in Dynatrace: for cloud and JMeter tests, open the run's
Logstab and look at the JMeter log. The last lines includeMetrics export to <your environment>: N of M batches accepted. If an export failed, the first failure is logged with its HTTP status. - An integration created before September 24, 2026: open it, enter the environment URL and token again, and save it. Integrations saved before that date do not send data.
- The run itself is never affected: if an integration is misconfigured, the test still runs. It just exports no metrics.
Edit or Remove the Integration
- Edit: click the edit icon on the integration in
Integrations. For security, the token is never shown again, so enter it every time you save. - Remove: click the delete icon. Tests that used it stop exporting.