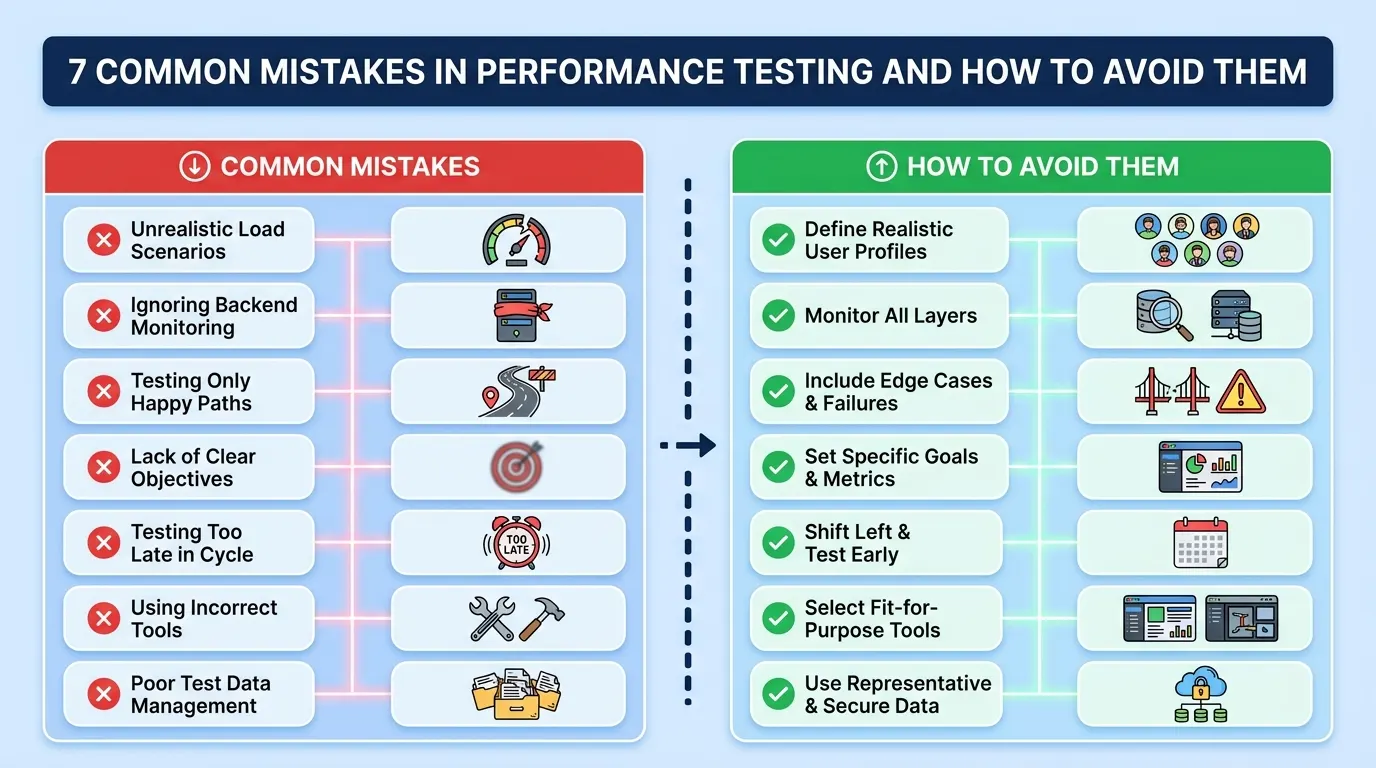
The most common performance testing mistakes are testing too late, testing an environment or data set that looks nothing like production, deciding what “pass” means after the results are in, and reading the average response time instead of percentiles. Each one produces a test that passes while real users still wait. Below are the seven pitfalls that cause most bad test results, and how to avoid each one.
Key takeaways
- Test early and on every significant change. A single test the week before launch finds problems when they are most expensive to fix.
- Unrealistic data is the quiet one: cached, repeated requests make everything look faster than production.
- Decide pass criteria before the run, or you will interpret the result to suit the deadline.
- Judge a run on percentiles and the error rate, not the average.
- Watch the load generator too. If it runs out of CPU, the slowness you measure is its own.
The 7 Performance Testing Mistakes at a Glance
| # | Mistake | What it looks like | How to avoid it |
|---|---|---|---|
| 1 | Testing too late, and only once | One load test the week before launch | A short test on every release candidate, full tests before big events |
| 2 | An environment unlike production | Staging with a fraction of the data and a mock for every dependency | Match data volume, limits and dependencies; write down every gap |
| 3 | Unrealistic test data and user behaviour | Every virtual user logs in as the same account and loads the same page with no pauses | Parameterise users and inputs, add think time, mix journeys |
| 4 | No objectives, baseline or pass criteria | ”Let’s see how it does” | Write targets and record a baseline before the first run |
| 5 | Reading averages instead of percentiles | ”Average 290 ms, ship it” | Judge on p95, p99 and the error rate per transaction |
| 6 | Testing only one layer | A browser test of the home page, or one API endpoint in isolation | Drive the journeys that reach the database, queues and third parties |
| 7 | An overloaded load generator | Response times climb because the test machine maxed out its CPU | Monitor the generators, run headless, spread the load |
Mistake #1: Testing Too Late, and Only Once
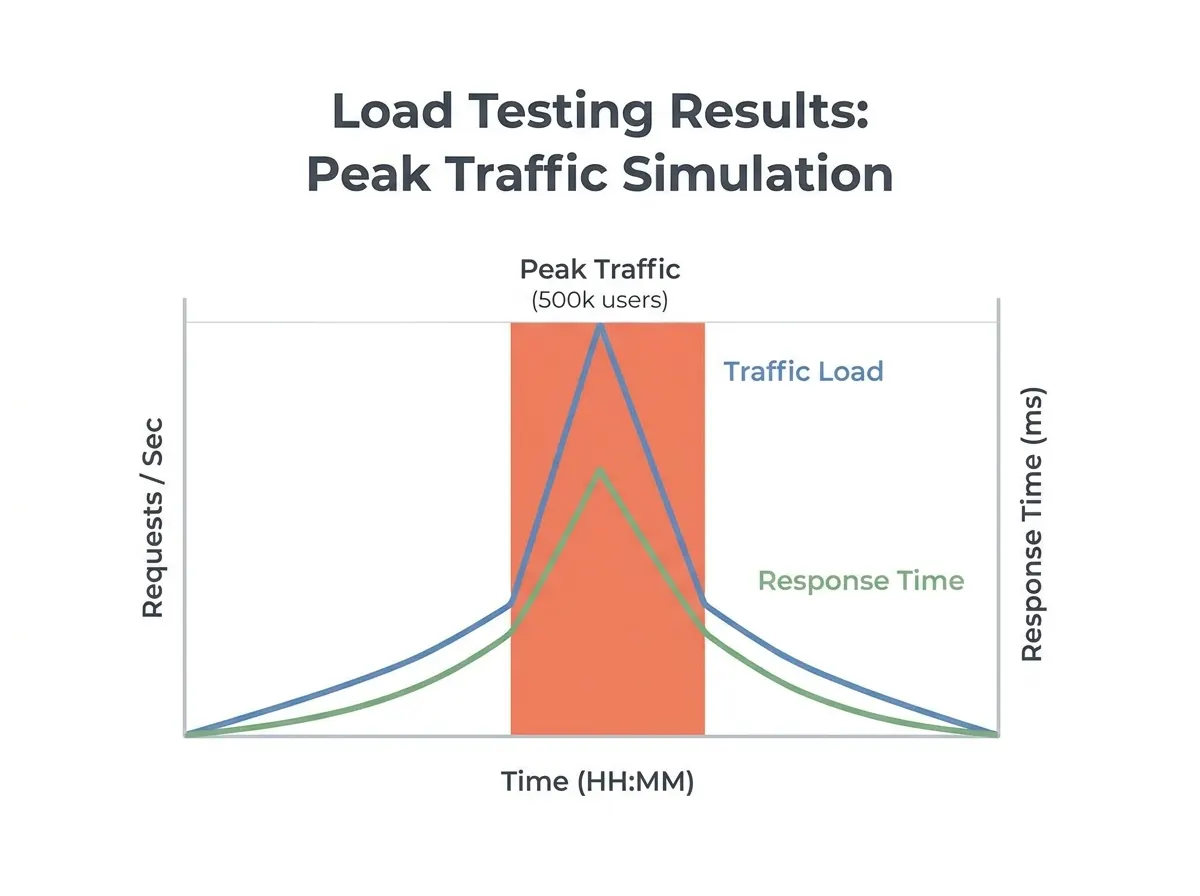
The classic pitfall is treating performance testing as a gate at the end of the project. A single run the week before launch finds problems when the architecture is settled and the deadline is close, so the fix tends to be “add more servers” instead of correcting the query or cache behaviour that caused the slowdown. It also says nothing about the release after that one.
How to avoid it:
- Run a short load test against every release candidate, with the same script, load and environment each time, so a regression shows up as a change from the previous run.
- Save the full-size tests (peak load, stress, soak) for launches, sales events and infrastructure changes.
- Put the short test in CI with pass/fail thresholds, so a slow build fails the way a broken unit test does. In k6, for example, a failed threshold makes the run exit with a non-zero code, which CI systems treat as a failed step.
Teams that already run tests on every merge can go further with continuous performance testing, where trends across builds matter as much as any single result.
Mistake #2: Testing an Environment That Does Not Resemble Production
A test is only as good as the system it hits. Staging environments often differ from production in ways that change the result: a database with a fraction of the rows, so slow queries stay fast; smaller instances or fewer replicas; autoscaling switched off; cold or missing caches; and third-party services replaced by mocks that answer instantly.
How to avoid it:
- Match data volume first. Query plans change with table size, and a missing index rarely shows on a small table.
- Match the settings that cap throughput: connection pool sizes, worker counts, timeouts, rate limits and instance types.
- Where a dependency has to be mocked, give the mock realistic latency and the occasional failure instead of an instant 200.
- Generate load from where your users are. Traffic from a single machine in one location skips the CDN routing and network paths that real visitors take.
- Write down every known difference between the test environment and production next to the results, so nobody reads a staging number as a production promise.
Mistake #3: Unrealistic Test Data and User Behaviour
This is the mistake that makes everything look faster than production. If every virtual user logs in with the same account, searches for the same term and opens the same product, the database, the application cache and the CDN serve almost everything from memory. Real users spread across thousands of records and miss those caches far more often.
Behaviour matters as much as data. A script with no pauses sends each virtual user’s requests back to back, so 100 virtual users produce many more requests per second than 100 people reading pages would. A script that only follows the happy path skips the expensive operations real users trigger: searches with no results, failed logins, large carts, report exports.
How to avoid it:
- Feed usernames, search terms and IDs from a data file large enough that values rarely repeat (a CSV Data Set Config in JMeter, a
SharedArrayloaded from a file in k6). - Add think time between steps (a Constant or Uniform Random Timer in JMeter,
sleep()in k6), based on what your analytics show. If you care about a target request rate rather than a user count, model it directly with an arrival-rate executor such as k6’sconstant-arrival-rate. - Mix journeys in proportion to real traffic. If most sessions browse and a few check out, weight the scenarios the same way.
- Include some error paths and edge cases on purpose.
The guide on how to simulate realistic user behavior in load tests covers think time, pacing and journey mixes in detail.
Mistake #4: No Objectives, Baseline or Pass Criteria Before the Run
Running a load test “to see how it does” produces numbers nobody can act on. Without a target, a p95 of 800 ms is neither good nor bad, and close to a deadline the temptation is to decide afterwards that whatever came out is acceptable.
Before the first run, write down:
- The question the test answers. Can checkout handle the expected peak? Did the new release get slower than the last one?
- The load. Concurrent users or requests per second, ramp-up and duration, taken from analytics or a forecast rather than a round number.
- The pass criteria, in numbers. For example: p95 response time under 500 ms on search, error rate under 1%, at least a given number of requests per second sustained.
- The baseline. The same test run against the current version, so the next result has something to be compared with.
Keep the baseline current. Record it again after infrastructure changes or a major release, and store the test configuration with it (users, duration, data set, environment) so later runs are comparable. This guide shows how to establish a performance baseline quickly.
Mistake #5: Reading Averages Instead of Percentiles and Errors
The average response time hides the slow requests that users notice. Take 100 requests: 90 take 100 ms and 10 take 2,000 ms. The average is 290 ms ((90 × 100 + 10 × 2,000) / 100), which looks healthy. The median is 100 ms. The 95th percentile is 2,000 ms, because one request in ten took two seconds.
Errors distort the picture further. A server that fails fast returns errors in a few milliseconds, which pulls the response time down at exactly the moment things are going wrong. Always read response time next to the error rate, and check what the errors were (timeouts, 5xx responses, 429 rate limits) before calling a run clean.
How to avoid it:
- Judge each run on p95 and p99 response time and the error rate, per transaction rather than across the whole test.
- Read the timeline, not only the summary. A response time that climbs steadily through a long run points to a leak or a filling queue, even when the overall percentiles pass.
- Line the results up with server metrics (CPU, memory, database connections, queue depth) for the same time window to find which component saturates first.
There is more on this in why percentiles are more useful than averages.
Mistake #6: Testing Only One Layer of the Application
A browser test of the home page and a single API endpoint tested in isolation both miss where load usually hurts: the database, the queues and the services behind the endpoint. An API can answer quickly in a functional test and still time out once many requests compete for the same connection pool.
| Component | Issues load can expose | How to test it | Limitation |
|---|---|---|---|
| Front end (web or mobile) | Slow rendering, heavy assets, script errors | Browser-based tests, page speed checks under load | Does not show where the server time goes |
| APIs (REST or GraphQL) | Slow responses, timeouts, inconsistent data | API load tests at the expected request rate | Misses issues tied to specific client usage patterns |
| Database | Slow queries, connection pool exhaustion, lock contention | Journeys that read and write real data volumes | Needs production-like data to mean anything |
| Third-party services | Latency spikes, rate limiting, outages | Realistic mocks with latency, or the real sandbox | Mocks may not behave like the real service |
| Authentication | Token issuing delays, session store limits | Many distinct users logging in and refreshing tokens | Security controls can block test traffic |
How to avoid it:
- Drive load through the journeys that do real back-end work (login, search, checkout), not only the pages that are easy to script.
- Test critical APIs directly as well, at the request rate they see in production.
- Monitor every tier during the test, so a slow response can be traced to the component that caused it.
Mistake #7: Letting the Load Generator Become the Bottleneck
When the machine generating the load runs out of CPU, memory or network bandwidth, it sends requests late and times responses late, and that delay shows up in the report as slowness in your application. The k6 documentation recommends keeping the load generator’s CPU use within 80% and warns that a saturated generator can produce response times much larger than they really are. A laptop running JMeter in GUI mode with the View Results Tree listener open is a common cause: the JMeter best practices page says to run load tests in CLI mode and not to use the “View Results Tree” or “View Results in Table” listeners during a load test.
How to avoid it:
- Monitor CPU, memory and network on every load generator during the run.
- Run JMeter in non-GUI mode (
jmeter -n -t test.jmx -l results.jtl) and keep listeners to a minimum. - When one machine is not enough, spread the load over several generators, or use a cloud service that runs them for you.
How LoadFocus Helps You Avoid These Mistakes
LoadFocus runs load tests, JMeter scripts and k6 scripts from 25+ cloud regions, so the load does not come from your laptop (mistake #7) and can come from where your users are (#2). For each test you can set SLOs once (maximum p95 and p99 response time, maximum error rate, minimum throughput) and every run is judged against them automatically (#4). Results show response time percentiles, errors and throughput over the course of the run (#5), and a GitHub Action, the Jenkins plugin or the verdict API can block a deploy when a threshold is breached, with scheduled recurring runs on paid plans (#1). See cloud load testing with LoadFocus.
Frequently Asked Questions
What are the most common performance testing mistakes?
Testing too late and only once, testing an environment that does not resemble production, using unrealistic test data and user behaviour, running without objectives or pass criteria, judging results by the average response time, testing only one layer of the application, and letting the load generator itself become the bottleneck. Most of them happen during planning and setup, before the first request is sent.
Why do load test results differ from production?
Usually because the test differs from production: less data, so queries stay fast; repeated test data, so caches answer everything; no think time, so the request mix is wrong; mocked dependencies that respond instantly; or an overloaded load generator adding its own delay. List the differences between the two environments and close the ones that affect the component you are testing.
What is the difference between performance testing and load testing?
Performance testing is the umbrella term for testing how fast and stable a system is. Load testing is one type of it: it checks behaviour at the expected and peak user volumes. Other types answer other questions, such as stress testing, which pushes past the expected load to find the breaking point, and soak testing, which holds a load for hours to expose leaks.
How many virtual users do I need for a load test?
Work it out from traffic data rather than picking a round number. By Little’s Law, concurrent users equal the arrival rate multiplied by the average session length. If 3,000 sessions start per hour (about 0.83 per second) and a session lasts 6 minutes (360 seconds), you need about 300 concurrent virtual users, plus headroom for the peak you are planning for.
How often should performance testing be done?
Run a short, repeatable test on every release candidate, ideally from CI with pass/fail thresholds, and full peak, stress or soak tests before launches, sales events and infrastructure changes. Testing once before a major release misses the regressions introduced by the changes in between.
How do I analyze performance test results?
Compare the run against your baseline and pass criteria, read p95, p99 and the error rate for each transaction, look at the timeline for gradual degradation, and line the results up with server metrics to find the component that saturates first. Then write down one concrete fix per finding.
Sources
- Apache JMeter: Best Practices (CLI mode, listeners, distributed testing) and the component reference (CSV Data Set Config, timers), read October 2026.
- Grafana k6 documentation: Running large tests (grafana.com/docs/k6/latest/testing-guides/running-large-tests) (load generator CPU and memory), Thresholds (grafana.com/docs/k6/latest/using-k6/thresholds), Executors (grafana.com/docs/k6/latest/using-k6/scenarios/executors) and SharedArray (grafana.com/docs/k6/latest/javascript-api/k6-data/sharedarray), read October 2026.
- LoadFocus: load testing (regions, SLO gates, CI integrations, schedules, percentiles), read October 2026.