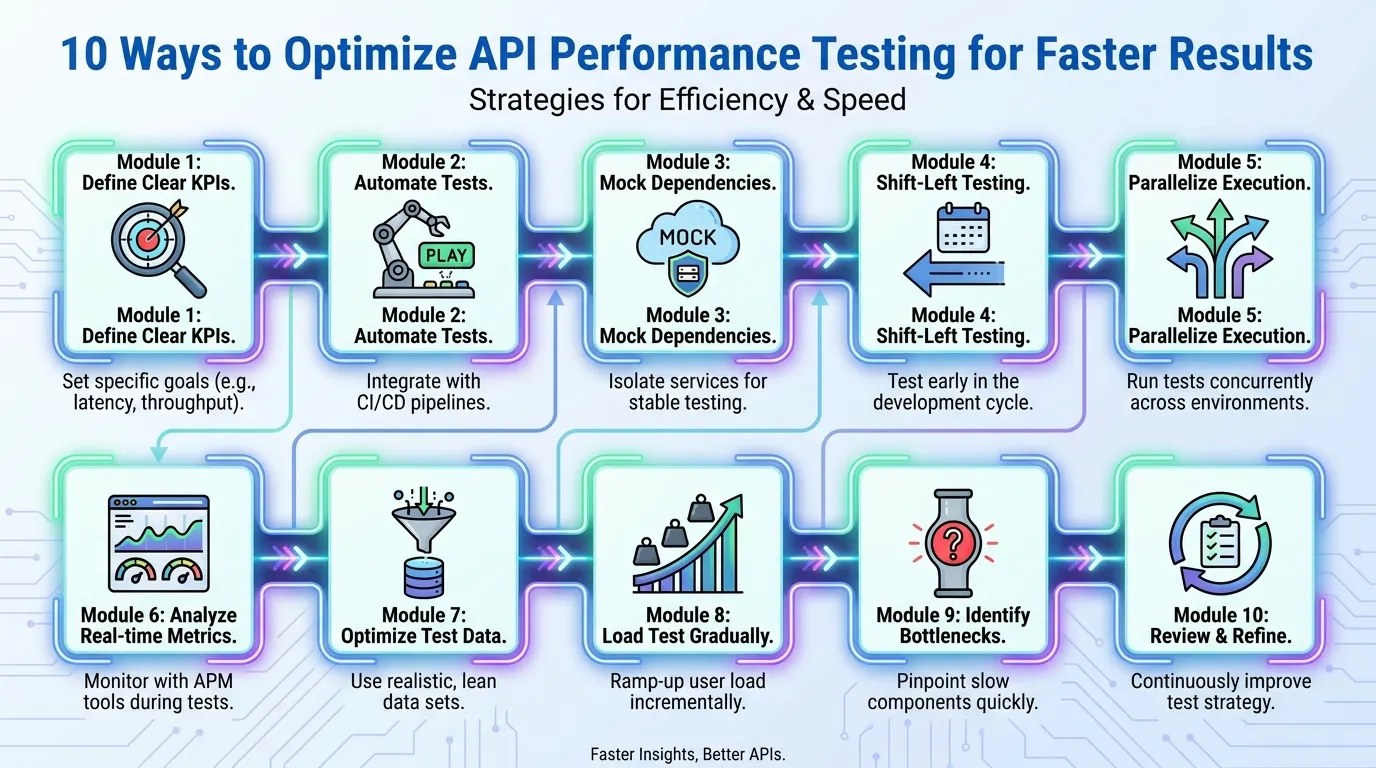
API performance testing measures how an API responds under load: latency percentiles, throughput, and error rate at a given request rate. Most runs that give slow or misleading results share a few causes: no pass/fail target, averages instead of percentiles, load modelled in users instead of requests per second, and test data that hits the same cache entry every time. The 10 practices below fix those, in the order you would apply them.
Key Takeaways
- Write the pass/fail criteria (p95, p99, error rate, target requests per second) before you run anything.
- Drive APIs with an arrival rate (an open model). A fixed pool of looping users sends less traffic exactly when the API slows down.
- Vary IDs, payloads and tokens, or you are measuring a cache.
- Keep a short performance check in CI and run the full test on a schedule, compared against a baseline.
What is API performance testing?
API performance testing sends a controlled volume of requests to one or more endpoints and records how fast and how reliably they respond. The usual outputs are response time percentiles (p50, p95, p99), throughput in requests per second, and the error rate. It covers several test types that differ only in the load profile: load, stress, spike, soak and smoke tests.
| Test type | Load profile | Question it answers |
|---|---|---|
| Smoke | A handful of requests | Does the script and environment work at all? |
| Load | Expected peak rate, held for 15 to 60 minutes | Do we meet our targets at normal peak? |
| Stress | Rate rising past the expected peak | Where does it break, and how does it fail? |
| Spike | A sudden jump in rate | Does autoscaling or rate limiting react in time? |
| Soak | Normal rate for hours | Do memory, connections or queues drift over time? |
The six problems that most often spoil these tests, from dependencies to the load model, have their own guide: API performance testing challenges and how to fix them. The ten practices below are about getting faster, more reliable results from your own tests.
1. Set pass/fail targets before you test
A test with no target produces a chart, not an answer. Before the first run, write down the numbers that decide pass or fail: for example “at 200 requests per second, p95 under 300 ms, p99 under 800 ms, fewer than 1% errors”. Take them from your SLOs or SLAs if you have them, or from production monitoring if you don’t.
These targets then become thresholds in the tool, so the run itself returns pass or fail and a pipeline acts on it. In k6 that is the thresholds option; in JMeter you can apply the same limits when you read the results, or let the platform running the test enforce them.
2. Measure percentiles, not averages
API latency is skewed. A few slow requests (a cache miss, a lock, a garbage collection pause) barely move the mean, but every user who hits one waits. An average of 120 ms can sit beside a p99 of 2 seconds. Report p50, p95 and p99 per endpoint, plus the error rate, and set targets on those. The reasons are covered in why percentiles beat averages in performance testing.
Split the numbers by endpoint. A combined percentile across a fast health check and a slow search endpoint describes neither.
3. Model API load in requests per second
Public APIs receive requests at a rate that does not depend on how fast you answer. A load test should behave the same way. Tools offer two models:
- Closed model: a fixed number of virtual users, each sending a request, waiting for the response, then sending the next. Throughput equals users divided by response time. With 50 users and no pause, a 100 ms response gives 500 requests per second, but if the API slows to 1 s the test drops to 50 requests per second. The load falls exactly when the system struggles, which hides the problem.
- Open model: requests start at a set rate whatever the response time, and the tool adds virtual users as needed to keep that rate. This is what you want for most API tests.
In k6 the open model is the constant-arrival-rate (or ramping-arrival-rate) executor. In JMeter 5.5 and later it is the Open Model Thread Group (still marked experimental), with a schedule such as rate(0) random_arrivals(2 min) rate(50/sec); the Precise Throughput Timer is the older option for a target rate.
A k6 API test with an arrival rate and thresholds looks like this:
import http from 'k6/http';
import { check } from 'k6';

export const options = {
  scenarios: {
    products_api: {
      executor: 'constant-arrival-rate',
      rate: 50,            // 50 requests started per second
      timeUnit: '1s',
      duration: '5m',
      preAllocatedVUs: 20,
      maxVUs: 200,
    },
  },
  thresholds: {
    http_req_duration: ['p(95)<300', 'p(99)<800'],
    http_req_failed: ['rate<0.01'],
  },
};

const BASE = __ENV.BASE_URL || 'https://api.example.com';
const TOKEN = __ENV.API_TOKEN;

export default function () {
  const id = Math.floor(Math.random() * 10000) + 1;
  const res = http.get(`${BASE}/products/${id}`, {
    headers: { Authorization: `Bearer ${TOKEN}` },
    tags: { name: 'GET /products/:id' },
  });
  check(res, { 'status is 200': (r) => r.status === 200 });
}
The number of virtual users needed follows Little’s Law: users in flight = arrival rate x time per request. At 50 requests per second and 200 ms per response, about 10 are busy at once. If responses slow to 2 s, you need 100, which is why maxVUs sits well above preAllocatedVUs. If k6 reports dropped iterations, the cap was too low and the API never received the full rate. The tags: { name } line groups every product ID under one name in the results, so you get one row per endpoint instead of 10,000.
4. Test the endpoints that matter first
Testing every endpoint at once makes a long run that is hard to read. Rank endpoints by two things: share of production traffic (from API gateway or access logs) and business weight. Login, search, cart and payment calls usually top both lists, while a low-volume payment or export endpoint can still belong on it because a failure there costs money.
Build the first test around the top five or so, in the proportions production shows. If 60% of calls are product reads and 5% are order writes, the test should send the same mix. Add the rest later, or test them in a separate smaller run.
5. Use realistic, varied test data
Sending the same request thousands of times measures your cache, not your API. Draw IDs, search terms and user accounts from a data file or a random range large enough to miss the cache at a realistic rate. Match payload sizes to production: if real orders carry 3 to 20 line items, test with that spread rather than one fixed item.
Include the awkward cases at their real frequency: the empty search, the customer with 2,000 past orders, the maximum page size. Those are often where response times jump. For JMeter, parameterization in JMeter shows how to feed a CSV of values into requests.
6. Handle authentication the way real clients do
Real clients log in once and reuse the token until it expires. A script that requests a new OAuth token before every call doubles the request count and load-tests your identity provider instead of your API. Fetch tokens in a setup step or per virtual user, cache them, and refresh only on expiry.
The opposite mistake also happens: one shared token for every virtual user. Per-user rate limits, per-user caches and per-tenant database partitions then behave nothing like production. Use a pool of test accounts sized to the concurrency you simulate.
7. Test in a production-like, isolated environment
Results transfer only when the environment matches production in the things that limit throughput: instance sizes and counts, database size and indexes, connection pool limits, caches and the CDN or gateway in front. A staging database with 1% of production’s rows will answer queries that production cannot.
Isolate the run as well. Other teams’ jobs on shared infrastructure add noise you will misread as a regression. Stub third-party APIs you do not own (payment providers, email, maps) or point them at their sandbox: you should not load test someone else’s production service, and their latency is not what you are measuring. If you use the cloud, allowlist the load generators’ IP addresses in your WAF or rate limiter so the test is not blocked halfway.
8. Make sure the load generator is not the bottleneck
If the machine sending the load runs out of CPU, memory or network, response times rise and throughput flattens, and the report blames your API. Watch the generator’s CPU during the run and keep it well below saturation. Turn off listeners and per-request logging you do not need; in JMeter, run in non-GUI mode for anything beyond a debug run.
Past a few thousand requests per second, or when you need traffic from several regions, spread the load across several generators. That is what the number of concurrent users JMeter can run from one machine comes down to, and it is the main reason teams run load tests from cloud generators.
9. Watch server-side metrics during the run
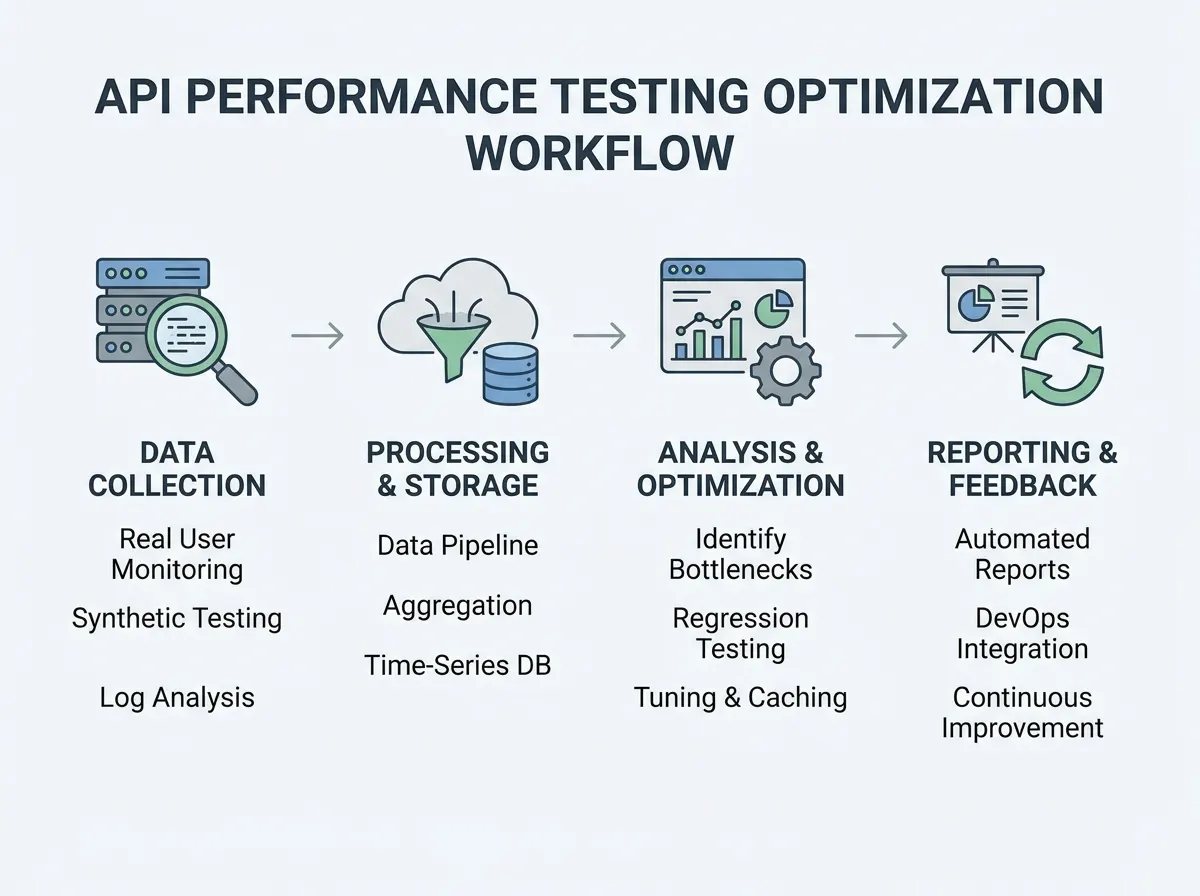
Client-side numbers show that the API slowed down. Server-side metrics show why. During every run, record CPU and memory per service, database query time and connections in use, connection pool waits, garbage collection pauses, queue depth, and the gateway’s own latency. Line them up with the test timeline.
The pattern tells you where to look. Latency rising while CPU stays low usually points to a wait: a pool, a lock or a downstream call. Throughput flattening at full CPU is a compute limit. Errors that start at a round number of concurrent requests often match a configured limit. Once you have found the cause, common API performance issues and how to detect them covers the usual fixes on the backend side.
10. Automate a short test in CI and compare against a baseline
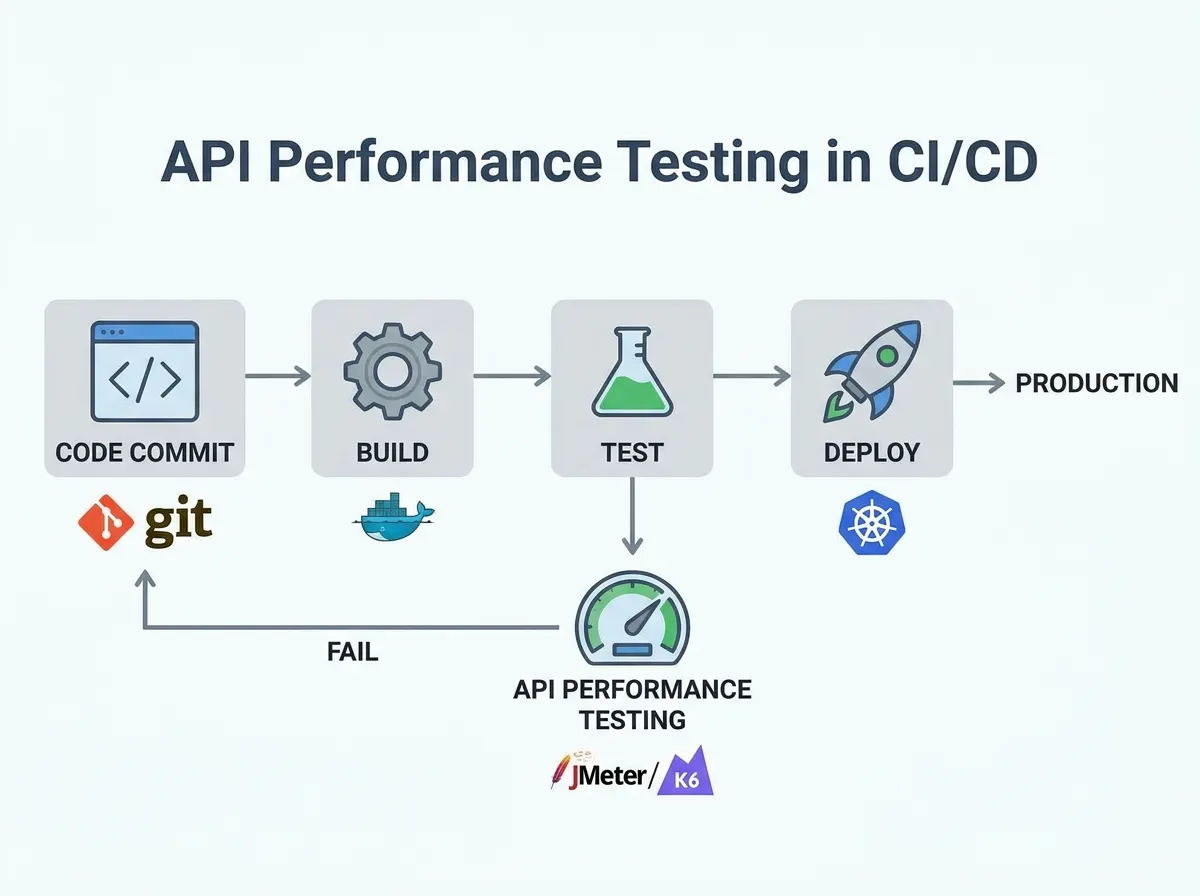
Run a small performance check on every merge: a minute or two at modest load against the main endpoints, with the same thresholds as step 1. It catches the obvious regressions (an N+1 query, a missing index) while the change is fresh. Run the full load, stress or soak test nightly or before a release, when a 30-minute run does not block anyone.
A threshold alone misses slow drift, so compare each run with a baseline from a known good build. A p95 that moved from 180 ms to 260 ms still passes a 300 ms target, but it is a 44% change worth a look. The baseline comparison feature is how LoadFocus puts two runs side by side.
Common API performance testing tools
The open-source tools most teams start with are Apache JMeter (GUI and XML test plans, many protocols, Java), k6 (JavaScript tests run by a Go binary, thresholds built in), Gatling (Java or JavaScript and TypeScript SDKs) and Locust (Python). Any of them handles the practices above, and the choice mostly follows the language your team writes. If your requests already live in Postman collections, cURL commands, a HAR file or an OpenAPI spec, you can turn them into a k6 or JMeter load test instead of scripting from scratch.
Running API performance tests with LoadFocus
LoadFocus API load testing runs tests against websites and APIs from 25 cloud regions, either built in the browser or from JMeter and k6 scripts you upload. You can split the load between regions by percentage. Results show response time, latency, throughput, standard deviation and the 50th, 90th and 99th percentiles, with charts of when errors appeared. For CI, LoadFocus has a Jenkins plugin, a GitHub Action, and a verdict API that returns the pass/fail result for any pipeline, and paid plans include AI analysis of each run. The free API load test is a quick way to try one endpoint, and API monitoring keeps checking it after release.
Frequently Asked Questions
What metrics matter most in API performance testing?
Response time percentiles (p50, p95, p99) per endpoint, throughput in requests per second, and error rate. Add server-side metrics during the run, such as CPU, database time and connection pool waits, so you can explain any change you see.
How many requests per second should an API load test use?
Start from production: take the peak rate from your gateway or access logs and test at that rate, then at 1.5x to 2x for headroom. For a new API, estimate from expected users and requests per user per minute, and confirm with a stress test that ramps past it.
How long should an API load test run?
Long enough for caches to warm and pools to settle, usually 15 to 60 minutes at the target rate. A CI check can be one or two minutes. Soak tests that look for memory leaks or connection drift run for hours.
How often should you run API performance tests?
Run a short check in CI on every merge to the main branch and a full load test nightly or before each release. Re-run the full test after infrastructure changes such as new instance types, database upgrades or a new gateway.
What is the difference between API load testing and API monitoring?
Load testing applies heavy, controlled traffic for a limited time to find limits before release. API monitoring sends a few requests at regular intervals, around the clock, to catch slowdowns and outages in production. Teams use both.
Sources
- k6
constant-arrival-rateexecutor (open model,rate,preAllocatedVUs,maxVUs): grafana.com/docs/k6/latest/using-k6/scenarios/executors/constant-arrival-rate (October 2026) - k6 thresholds: grafana.com/docs/k6/latest/using-k6/thresholds (October 2026)
- Apache JMeter component reference, Open Model Thread Group and Precise Throughput Timer: https://jmeter.apache.org/usermanual/component_reference.html (October 2026)
- Little, J. D. C. (1961), “A Proof for the Queuing Formula: L = λW”, Operations Research 9(3): https://doi.org/10.1287/opre.9.3.383