Why Performance Testing
We all want our websites to be responsive and useful. However, the biggest correlation between website performance and business results is seen by improving the performance and speed of your website.
Users get bored if they have to wait for too long to load your website or application.
Is Your Infrastructure Ready for Global Traffic Spikes?
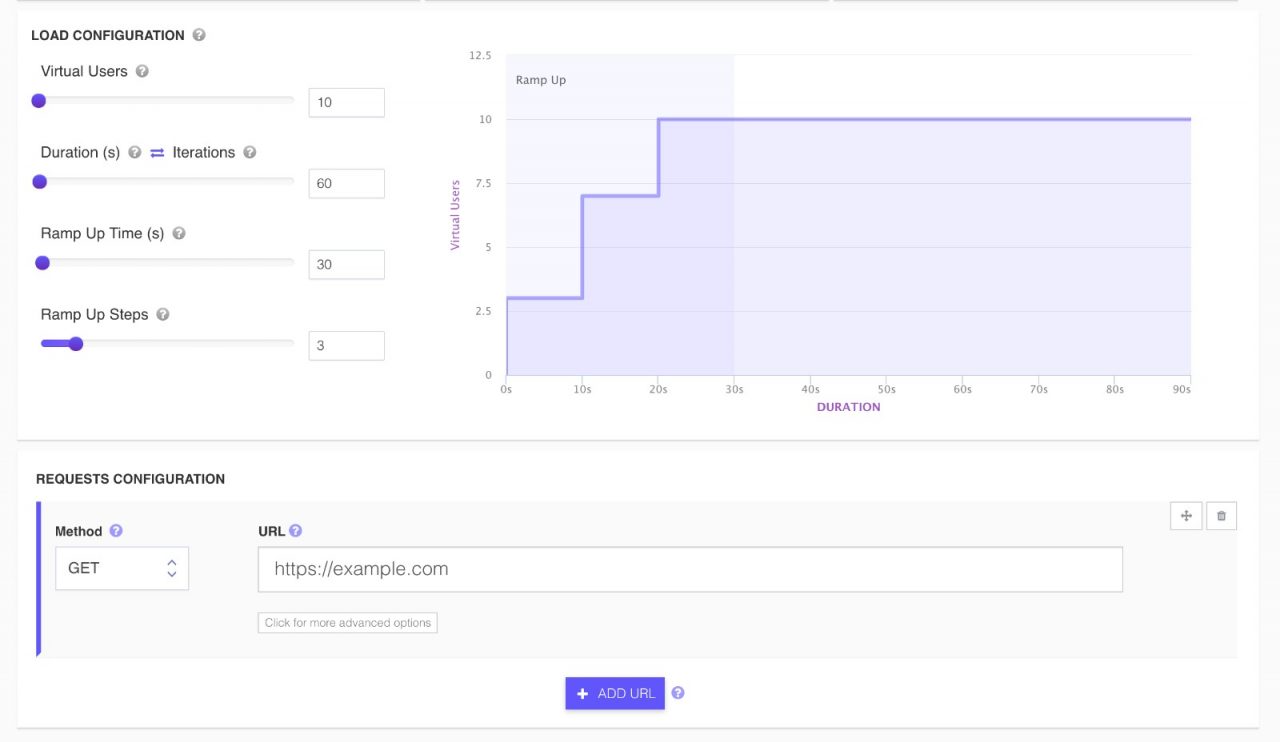
Unexpected load surges can disrupt your services. With LoadFocus’s cutting-edge Load Testing solutions, simulate real-world traffic from multiple global locations in a single test. Our advanced engine dynamically upscales and downscales virtual users in real time, delivering comprehensive reports that empower you to identify and resolve performance bottlenecks before they affect your users.
Performance Testing and Load Testing your website and restful APIs will help you understand better how your website and web services behave when a lot of users access your website at the same time.
Performance Testing questions that website owners ask
- is my website going to crash?
- is everything going to be slow or will freeze when doing certain actions?
- will my users encounter errors? how many errors and of what type?
- is my website going to recover after a heavy load?
- which are the most sensitive areas and how will they behave during a load test?
What are Percentiles
A percentile is defined as the value where x percent of the data falls below the value.
Think your website can handle a traffic spike?
Fair enough, but why leave it to chance? Uncover your website’s true limits with LoadFocus’s cloud-based Load Testing for Web Apps, Websites, and APIs. Avoid the risk of costly downtimes and missed opportunities—find out before your users do!
The Percentile metric tells you the value at which a certain percentage of your data is included.
The median, or the middle value, is also known as the 50th percentile (the middle percentile out of 100). This is the value at which 50% of the data is less than the value, and 50% is greater than the value (or equal to it).
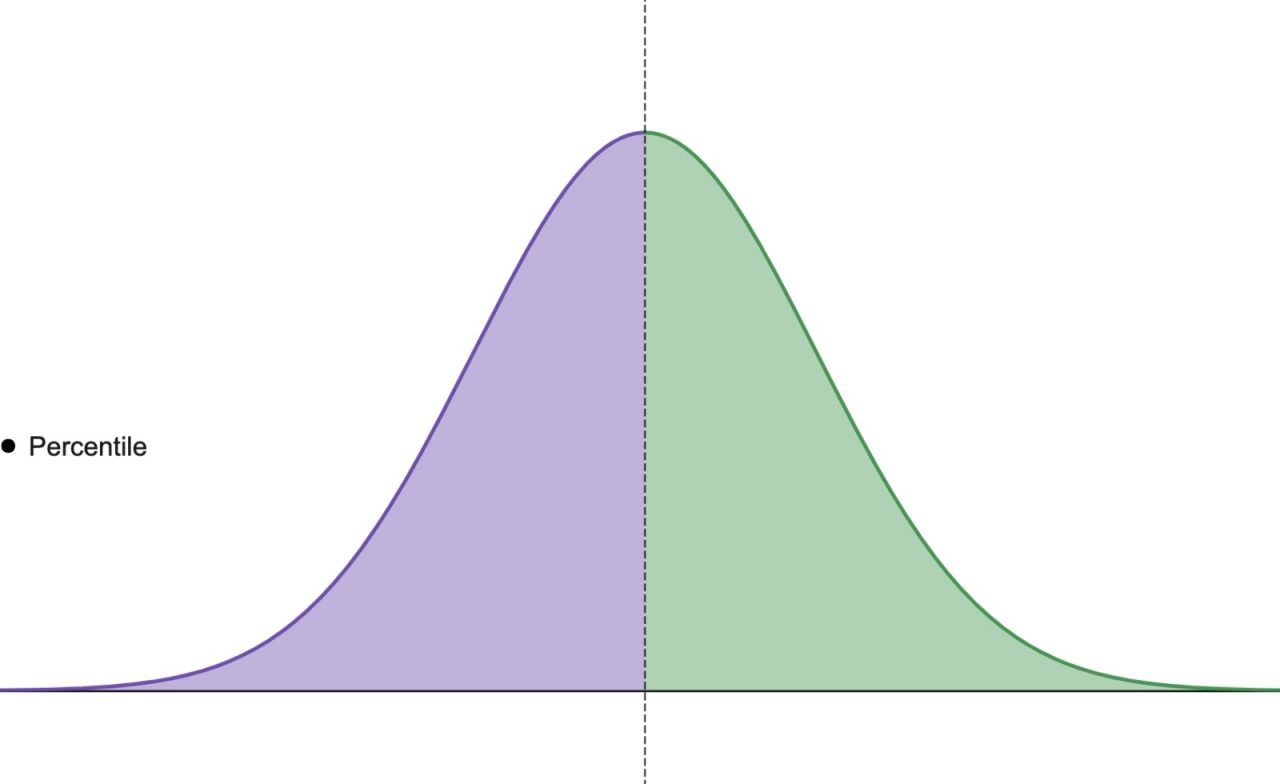
For example, if we call something “the 10th percentile,” we mean that 10% of the data is less than the value and 90% is greater than (or equal to) the value.
LoadFocus is an all-in-one Cloud Testing Platform for Websites and APIs for Load Testing, Apache JMeter Load Testing, Page Speed Monitoring and API Monitoring!
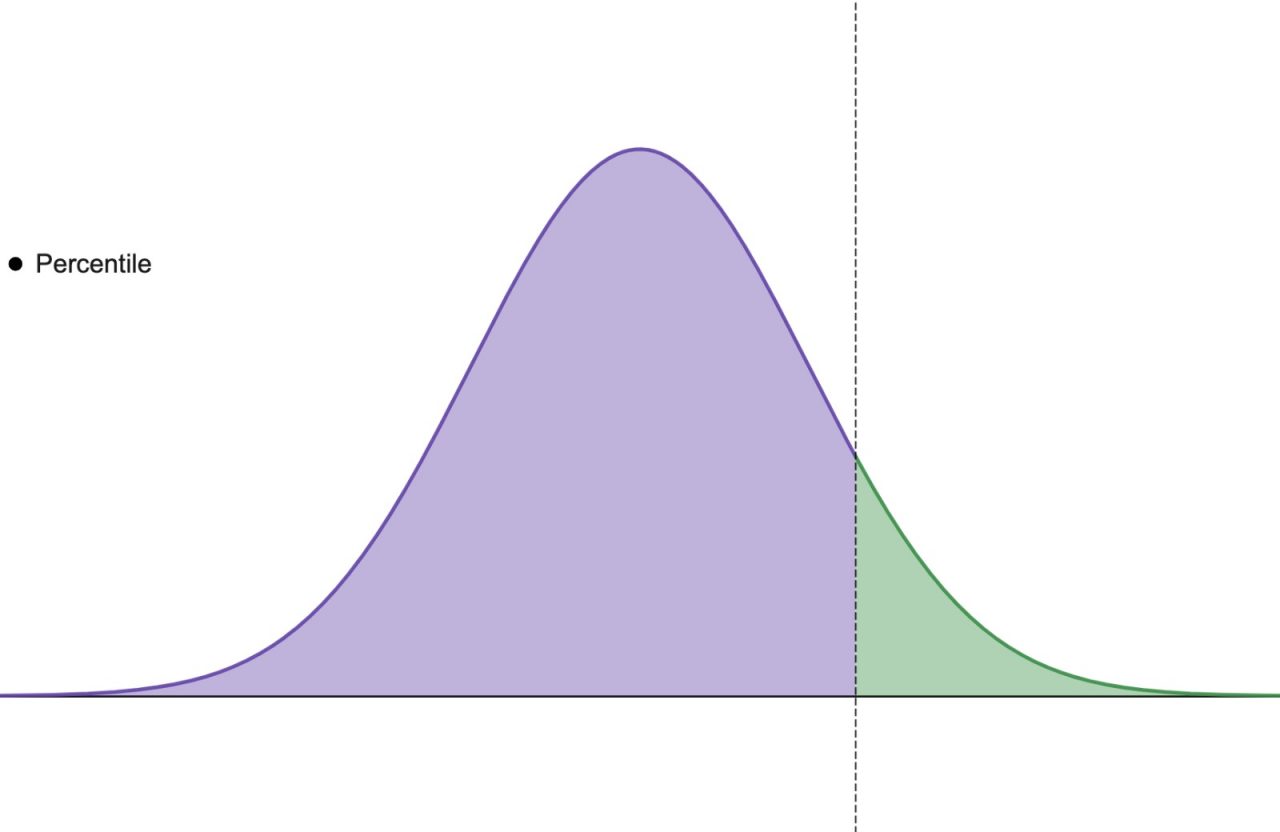
And the 90th percentile is where 90% of the data is less than the value and 10% is greater:
So a 95% percentile tells you the value which is greater than or equal to 95% of your data.
Most people use basic statistics like min, mean, median or max, which for a large number of data they hide the truth.
Mean and median tend to hide outliers, wherease min/max are distorted by a single outlier.
Why are Averages so Misleading
Basic averages are an awful way to paint the world and the numbers around it. Using averages instead of percentiles can lead to false alarms or missed opportunities.
The median is the middle value, where half of the data is above and half is below. The mean (aka average) is defined as the sum(value) / count(value).
Let’s see one example: if the average monthly salary in your area is 2000 dollars, but 1 out of 10 people earns 11,000 dollars per month, this does not mean the rest of 9 people out of ten earn 2000 dollars, it means we have an outlier data, which is the 11,000 dollar salary, and 9 other people that earn 1000 dollars per months.
This is how the averages tend to hide outliers.
How to Improve your Website Performance using Percentiles
Using averages can have a dramatic (and negative) impact on how values are reported, while percentiles can help you get closer to the “truth.”
Percentiles are great for monitoring in improving your website or application. Percentile approximations are very useful for working with large time-series data sets because they offer the benefits of using percentiles (rather than averages or other counting statistics).
If your website is too slow, and you want to improve the response time, or an API load time is slow when it’s requests by a large number of concurrent users, you can focus on improving the 90th percentile.
Improving the 90th percentile will ensure that the overall response time of your website goes down.
However, your 90th percentile can look very good, but we see a lot of websites with very bad 95th or 99th percentiles.
These kind of observations are only possible using percentiles, with basic performance stats like averages, min, max these observations would’ve not been possible.
Hopefully, now you are beginning to see applications of percentiles all over your data and your performance metrics.
People often use averages and other summary statistics more frequently than percentiles because they are significantly “cheaper” to calculate over large datasets, both in computational resources and time.
The point is that the averages don’t give us a good way to distinguish between outliers and real effects and can give odd results when we have a long-tail or asymmetric distribution.
Why You Should Monitor your Website
To understand how our website performed and find ways to improve you need to test and monitor at a scheduled basis.
Monitoring an API is a common scenario whcih can help you catch and fix issues before they impact too many production users, which may cause a lot of losses to the bottom line of your business.
Percentiles in Load Testing
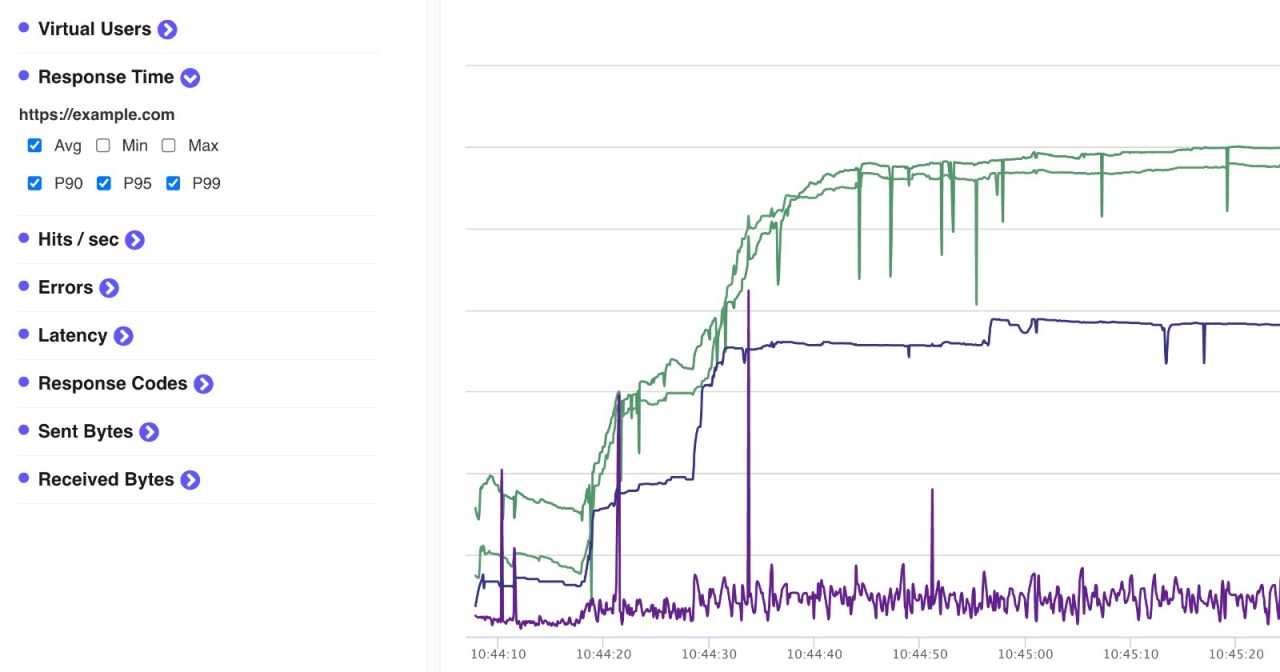
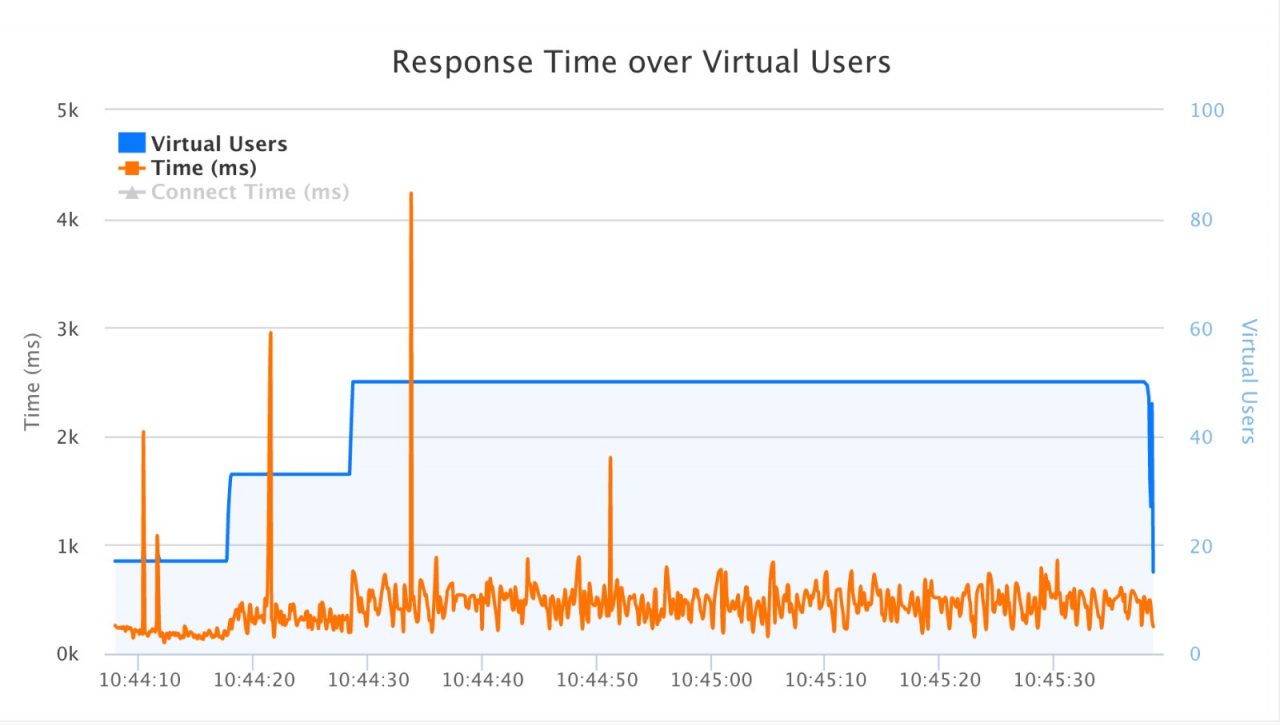
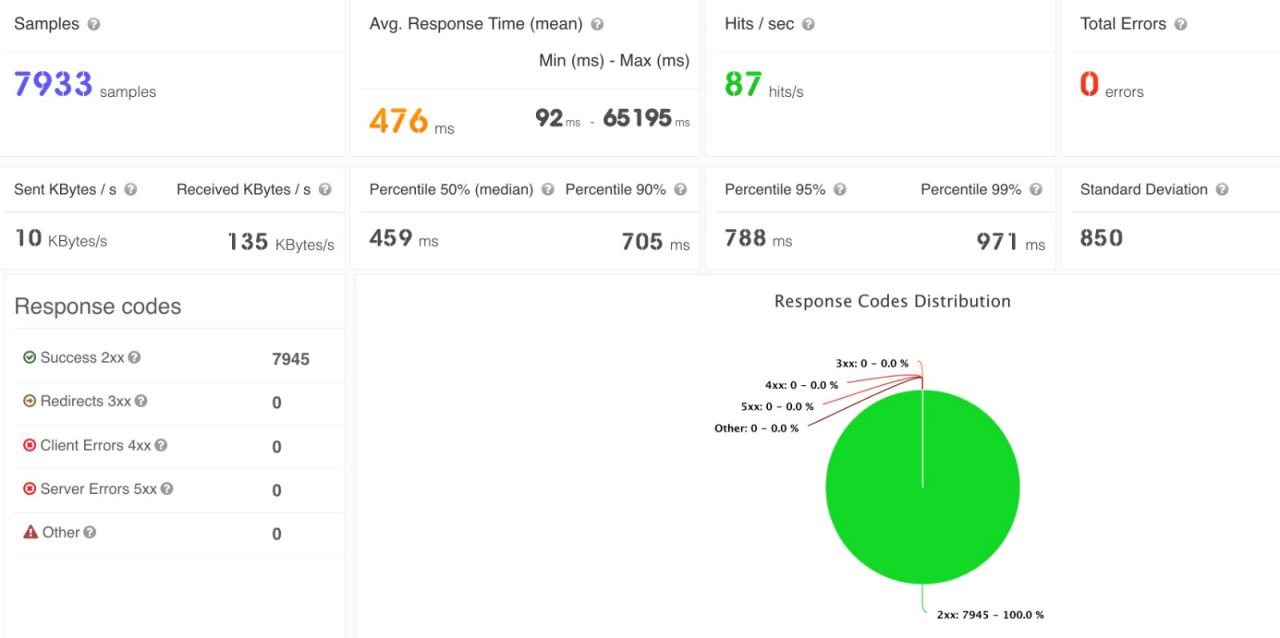
Using the Cloud Load Testing tool from LoadFocus, you can easily inspect raw response times, min, max, along with all percentiles:
- 50th percentile
- 90th percentile
- 95th percentile
- 99th percentile
Similar results can be inspected when using JMeter scripts and running them in the cloud using the JMeter Cloud Load Testing Tool.
Conclusion
Hopefully, now you are beginning to see applications of percentiles all over your data and your performance metrics.
Written by Bogdan Vazzolla.
LoadFocus is a cloud testing platform, a load and stress testing tool which provides the infrastructure to run tests with thousands of concurrent users, from multiple cloud locations, in less than a few minutes, keep history of the results, compare different runs to inspect performance improvements or performance degradation. It also supports running JMeter load tests from the cloud and monitoring and audit web and mobile performance.