


Load testing and monitoring for DevOps
In the pipeline, not beside it.

A performance check that runs only when someone remembers to run it is not a check. LoadFocus runs load tests and uptime monitors on a schedule and from your pipeline, and sends failures to the channel your team already watches.


Performance regressions ship on a Friday

Most performance problems are not discovered, they are reported, usually by a customer and usually at the worst time. The gap is not tooling, it is placement: the test lives outside the release process, so it runs after the decision it was supposed to inform. Moving it into the pipeline changes what it is for.


Wiring it into delivery

Define monitors as code

Keep monitor definitions in version control next to the service they watch, so a new endpoint arrives with its check already written and reviewed.

Run tests from CI

Trigger a load test as a build step and fail the build on a threshold, so a regression stops at the pipeline rather than at a customer.

Route alerts where people already are

Send failures and recoveries to Slack, PagerDuty, Opsgenie, Microsoft Teams, Discord or a plain webhook, and use retries and thresholds so a single network blip does not page anyone.


Where to go next


LoadFocus for DevOps: FAQ

Can I run a load test from CI?

Yes. Tests can be triggered as a build step and gated on a threshold, so a build fails when performance regresses rather than after release.

What is monitoring as code?

Monitor definitions kept in version control rather than clicked into a dashboard. They get reviewed like any other change, travel with the service they watch, and can be recreated from the repository.

Which alert channels are supported?

Email, Slack, PagerDuty, Opsgenie, Microsoft Teams, Discord and generic webhooks. A channel is shared across your team and attached per check.

How do I stop flaky checks from paging on-call?

Configure retries and an alert threshold so a check has to fail more than once before it alerts, and schedule maintenance windows around planned work.

Can I monitor things that are not HTTP?

Yes. TCP monitors check that a port accepts connections, DNS monitors confirm records resolve to the values you expect, and heartbeat monitors catch a scheduled job that did not run.

Does a failed check tell me why it failed?

Browser checks capture screenshots, console logs, network logs, per-step timings and a replayable trace, so the failure comes with evidence rather than just a status.

Learn more. Read on our blog.

Outgrown your testing tools?

Load test websites and APIs from 25+ cloud regions, monitor page speed and uptime, and get AI analysis that explains your results in plain English.Start for free
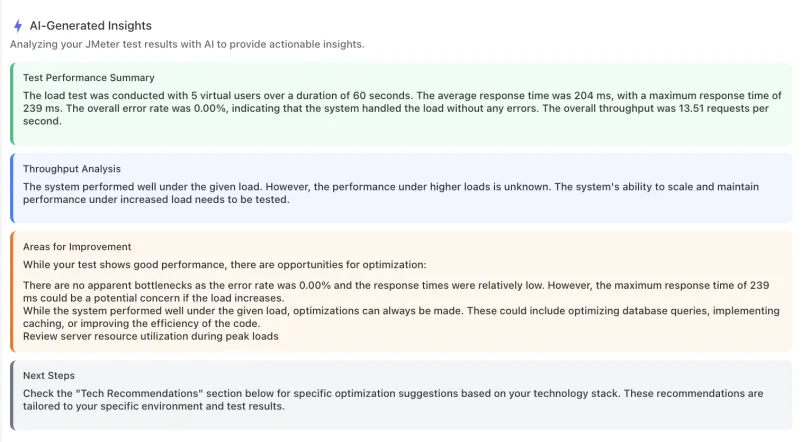
AI analysis of a load test result: performance summary, throughput analysis, and recommended improvements in plain English

We'll help you get started

Browse use cases, getting started videos, tutorials, and our showcase to find what you need to succeed with LoadFocus, and as a business.

Learn

Browse our documentation covering everything from use cases to getting started guided and videos.

Explore

Tools to make your testing development and overall experience much better.


A newsletter that sparks joy

Get notified about our upcoming features and articles.


×