




Page speed and Core Web Vitals for SEO
Measured on a schedule, not on a hunch.

Core Web Vitals move when the site changes, and the change is rarely announced. LoadFocus tests your pages on a schedule, shows lab results next to real-user field data, and tells you when a page slips instead of leaving you to notice.


A one-off score tells you almost nothing

Running a speed test by hand gives you one number, from one place, at one moment, on one connection. It cannot tell you whether the page got slower this week, whether real visitors see what the lab saw, or which of last month's releases caused it. Only a scheduled series can answer those.


Keeping vitals honest

Watch the pages that matter

Import URLs straight from your sitemap rather than adding them one at a time, so the pages earning traffic are the pages being measured.

Read lab and field data together

Lab runs are reproducible and good for debugging. Field data from the Chrome UX Report is what Google assesses. Seeing both stops you optimising the number nobody is scored on.

Set a budget and get told when it breaks

Define a performance budget per metric and alert on it, so a regression reaches you as a notification rather than as a ranking drop three weeks later.


Where to go next


Page speed for SEO: FAQ

Which Core Web Vitals does Google actually assess?

Largest Contentful Paint, Interaction to Next Paint and Cumulative Layout Shift, judged on real-user field data rather than on a lab run.

What is the difference between lab and field data?

Lab data comes from a controlled test run, which makes it reproducible and useful for debugging. Field data is aggregated from real Chrome users over the trailing 28 days, and it is what the Core Web Vitals assessment uses.

How often should I test?

On a schedule rather than ad hoc. The value is in the series: a single score cannot show a regression, and a regression is the thing you need to catch.

Can I monitor many pages at once?

Yes. URLs can be imported from your sitemap so a whole section is covered without adding pages by hand.

What is a performance budget?

A threshold you set per metric. When a page crosses it the check reports a failure, which turns performance from something you check into something that tells you.

Can I show a client the result?

Yes. Reports can be exported as PDF and branded, which is usually easier to hand over than a dashboard login.

Learn more. Read on our blog.

Outgrown your testing tools?

Load test websites and APIs from 25+ cloud regions, monitor page speed and uptime, and get AI analysis that explains your results in plain English.Start for free
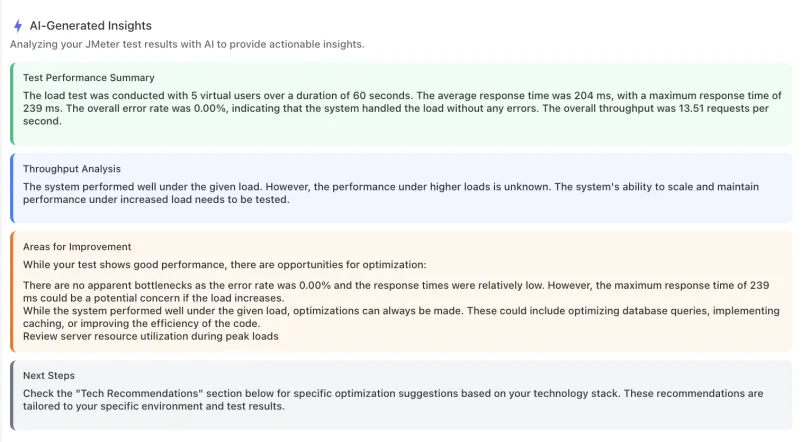
AI analysis of a load test result: performance summary, throughput analysis, and recommended improvements in plain English

We'll help you get started

Browse use cases, getting started videos, tutorials, and our showcase to find what you need to succeed with LoadFocus, and as a business.

Learn

Browse our documentation covering everything from use cases to getting started guided and videos.

Explore

Tools to make your testing development and overall experience much better.


A newsletter that sparks joy

Get notified about our upcoming features and articles.


×