- Basic Performance Metrics
- Single Location Test
- Desktop Device Only
- Limited Insights
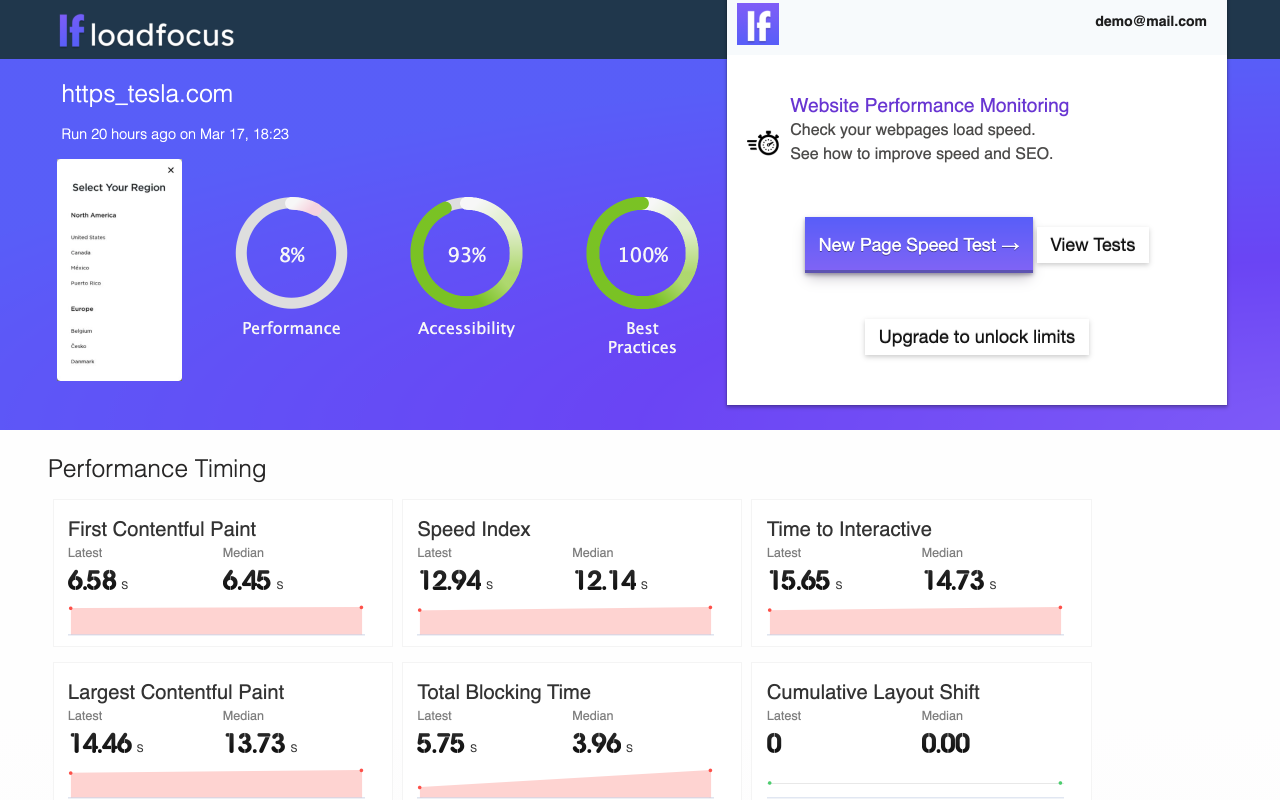
Discover Website Performance Improvements
Receive page speed metrics and performance improvements instantly using the visual tool powered by Google Lighthouse.
Get Started
Monitor every page, not just the homepage
Import your whole sitemap in one click
Point LoadFocus at your sitemap.xml and pick the pages to monitor.
We fetch your sitemap and list its URLs: filter the list, select the pages you care about, and one monitor per page is created with the location, device and schedule you choose. Index sitemaps, gzipped sitemaps and plain text lists are supported, and pages you already monitor are detected so re-importing never creates duplicates.
How sitemap import works
How sitemap import works
Get Started
Monitor pages behind a login
Staging environments, admin dashboards and member areas, monitored like any public page.
Each monitor can send HTTP authentication with every audit: Basic Auth, a Bearer token or a custom header such as a session cookie. Credentials are removed from stored results before anything is displayed or shared.
How HTTP authentication works
Read all Page Speed Monitoring guides
How HTTP authentication works
Read all Page Speed Monitoring guides
Speed Recommendations & Compare with Competitors
Monitor web page performance, inspect performance metrics, and discover best practices.
Get StartedUnderstand better your website performance with rendering screenshots and in-depth performance analysis.
Understand performance rendering metrics for your device using bandwidth and CPU simulation.
Understand performance rendering metrics for your device using bandwidth and CPU simulation.
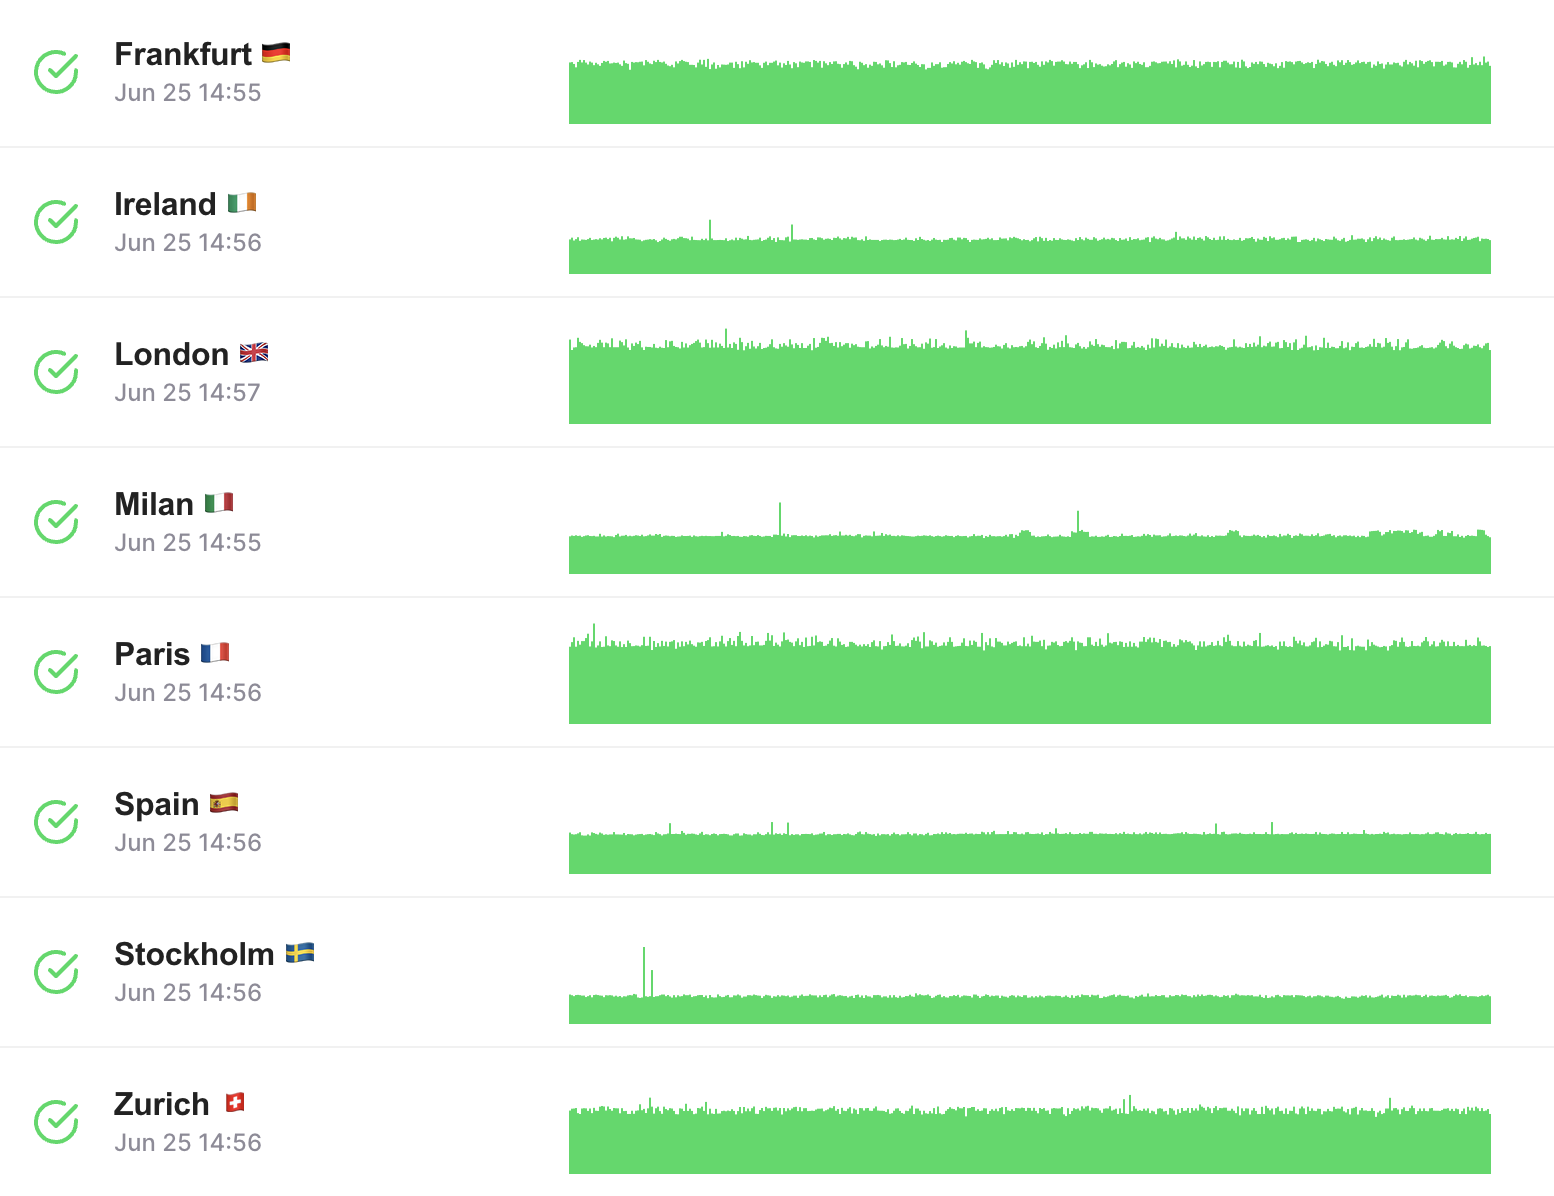
Schedule automated web page performance tests for your sites
Encounter real conditions your customers experience while they browse your sites.
Get StartedContinuous website speed and performance audits, regression testing and reporting with comparison between test runs and best practice guidelines.
No coding & no configuration required
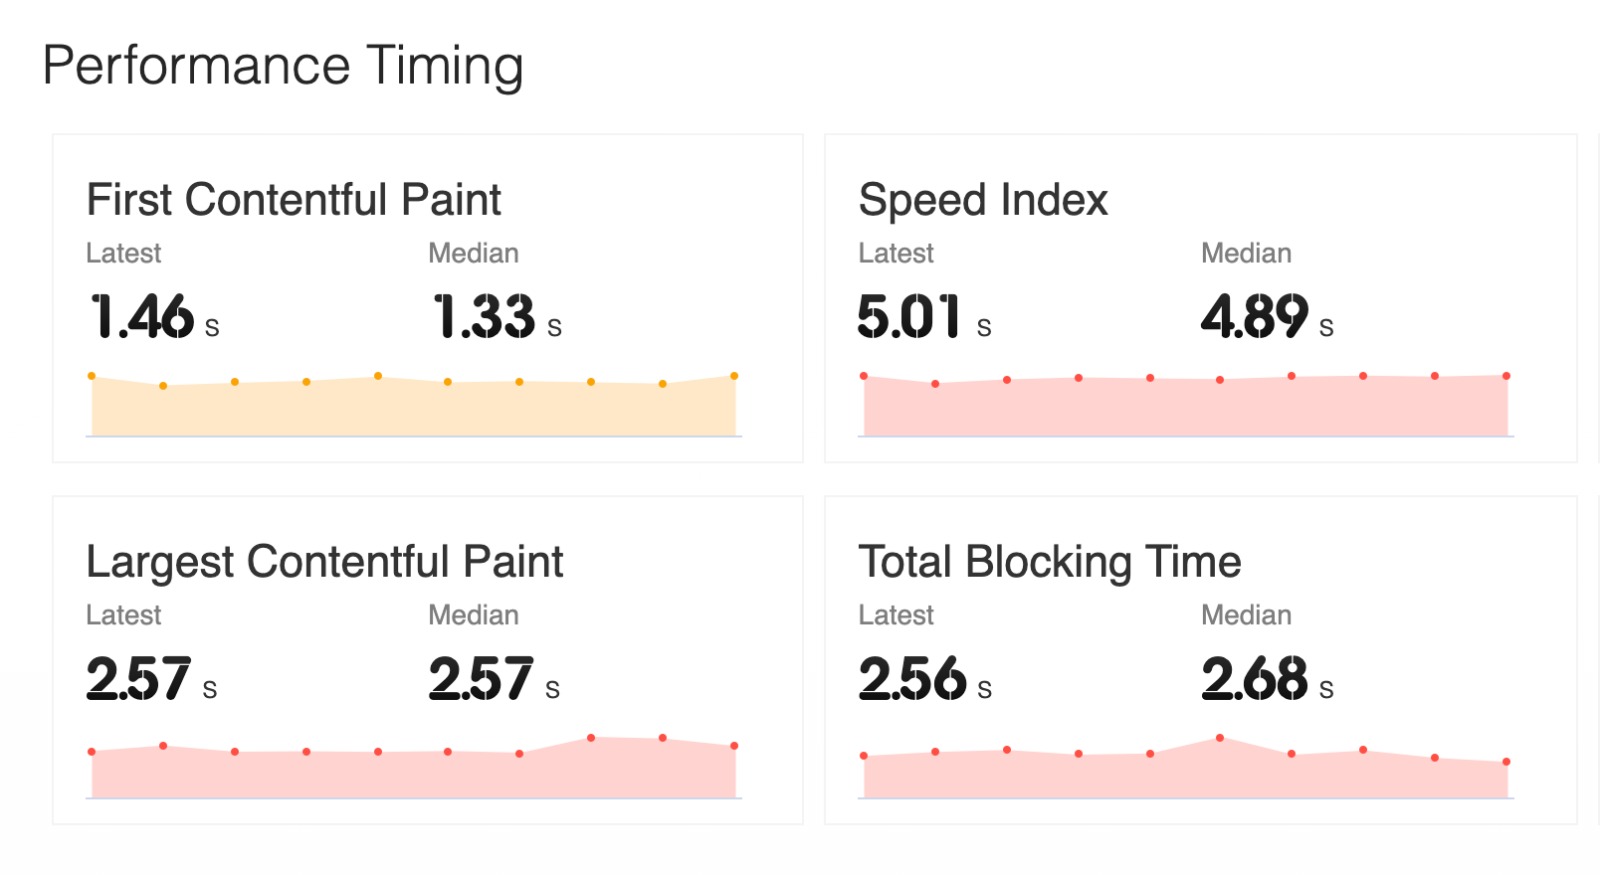
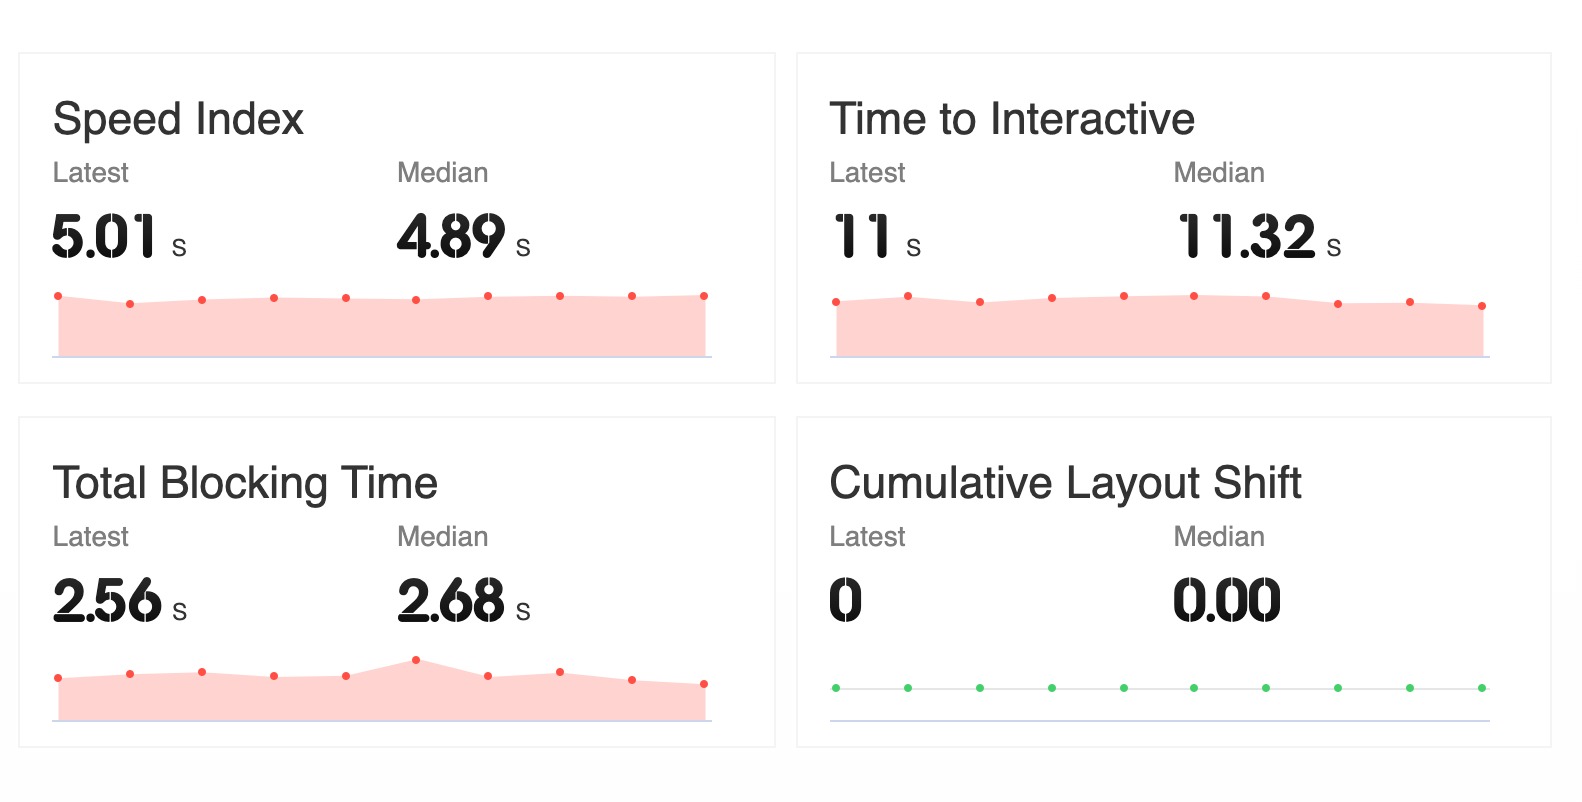
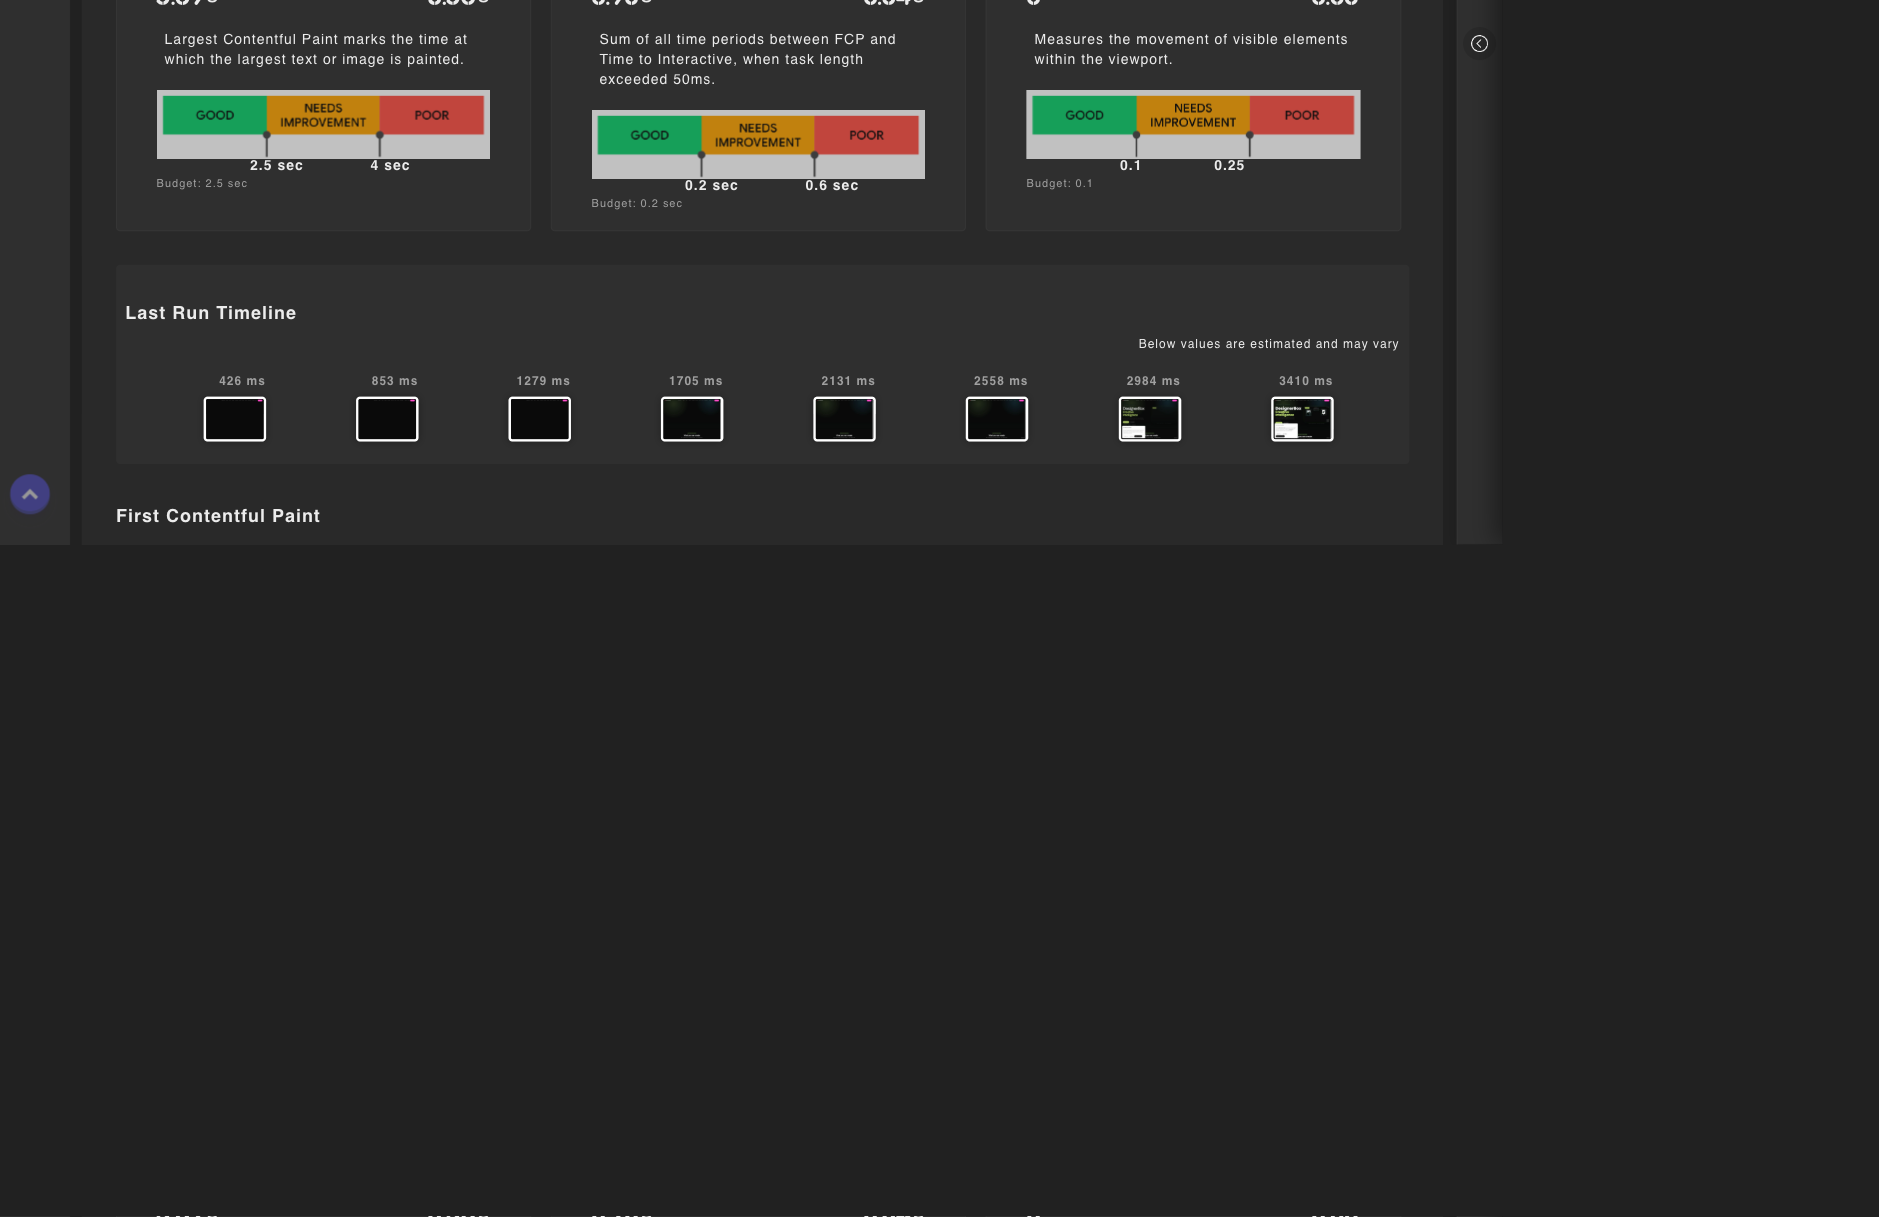
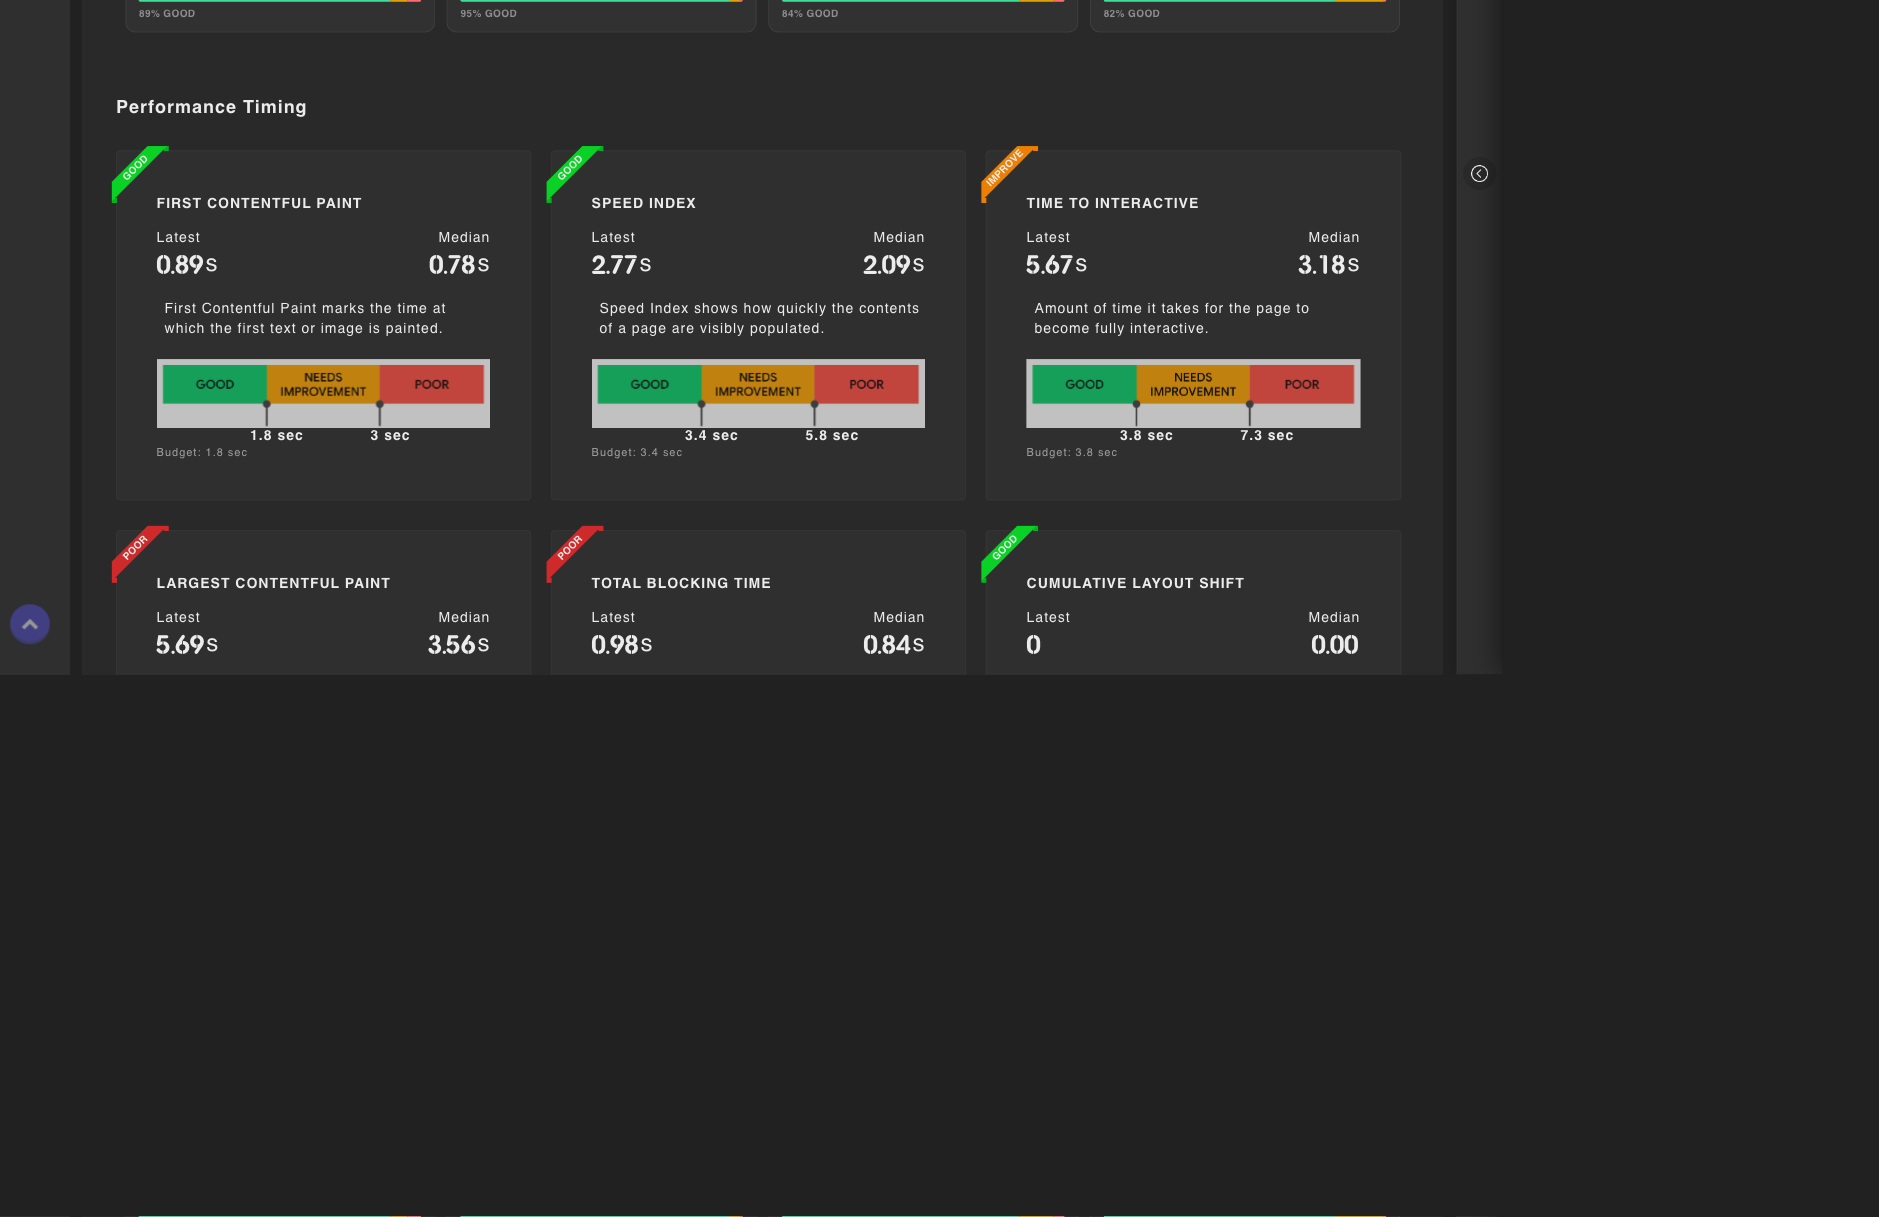
Speed insights on the metrics that matter: Core Web Vitals, Largest Contentful Paint, Time to Interactive, Speed Index and more.
First Meaningful Paint - the time required to begin rendering content within the browser.
Get StartedTime to Interactive – a measure of the point at which a page has loaded enough for a user to interact with it.
Chrome Extension: Page Speed monitoring
Website Speed and Performance Monitoring extension for webpage speed, best practices, SEO & accessibility.
Monitor the speed of your web pages to deliver the best experiences to your customers. Get notifications and alerts for website performance issues.
Install Extension→LoadFocus Page Speed Monitoring is powered by Lighthouse and focuses on modern user experience and performance metrics to help you deliver the best experience to your customers.
ADVANCED PAGE SPEED MONITORING
Go beyond scores: prioritized fixes, budgets, real-user data and competitor benchmarks, built into every result.
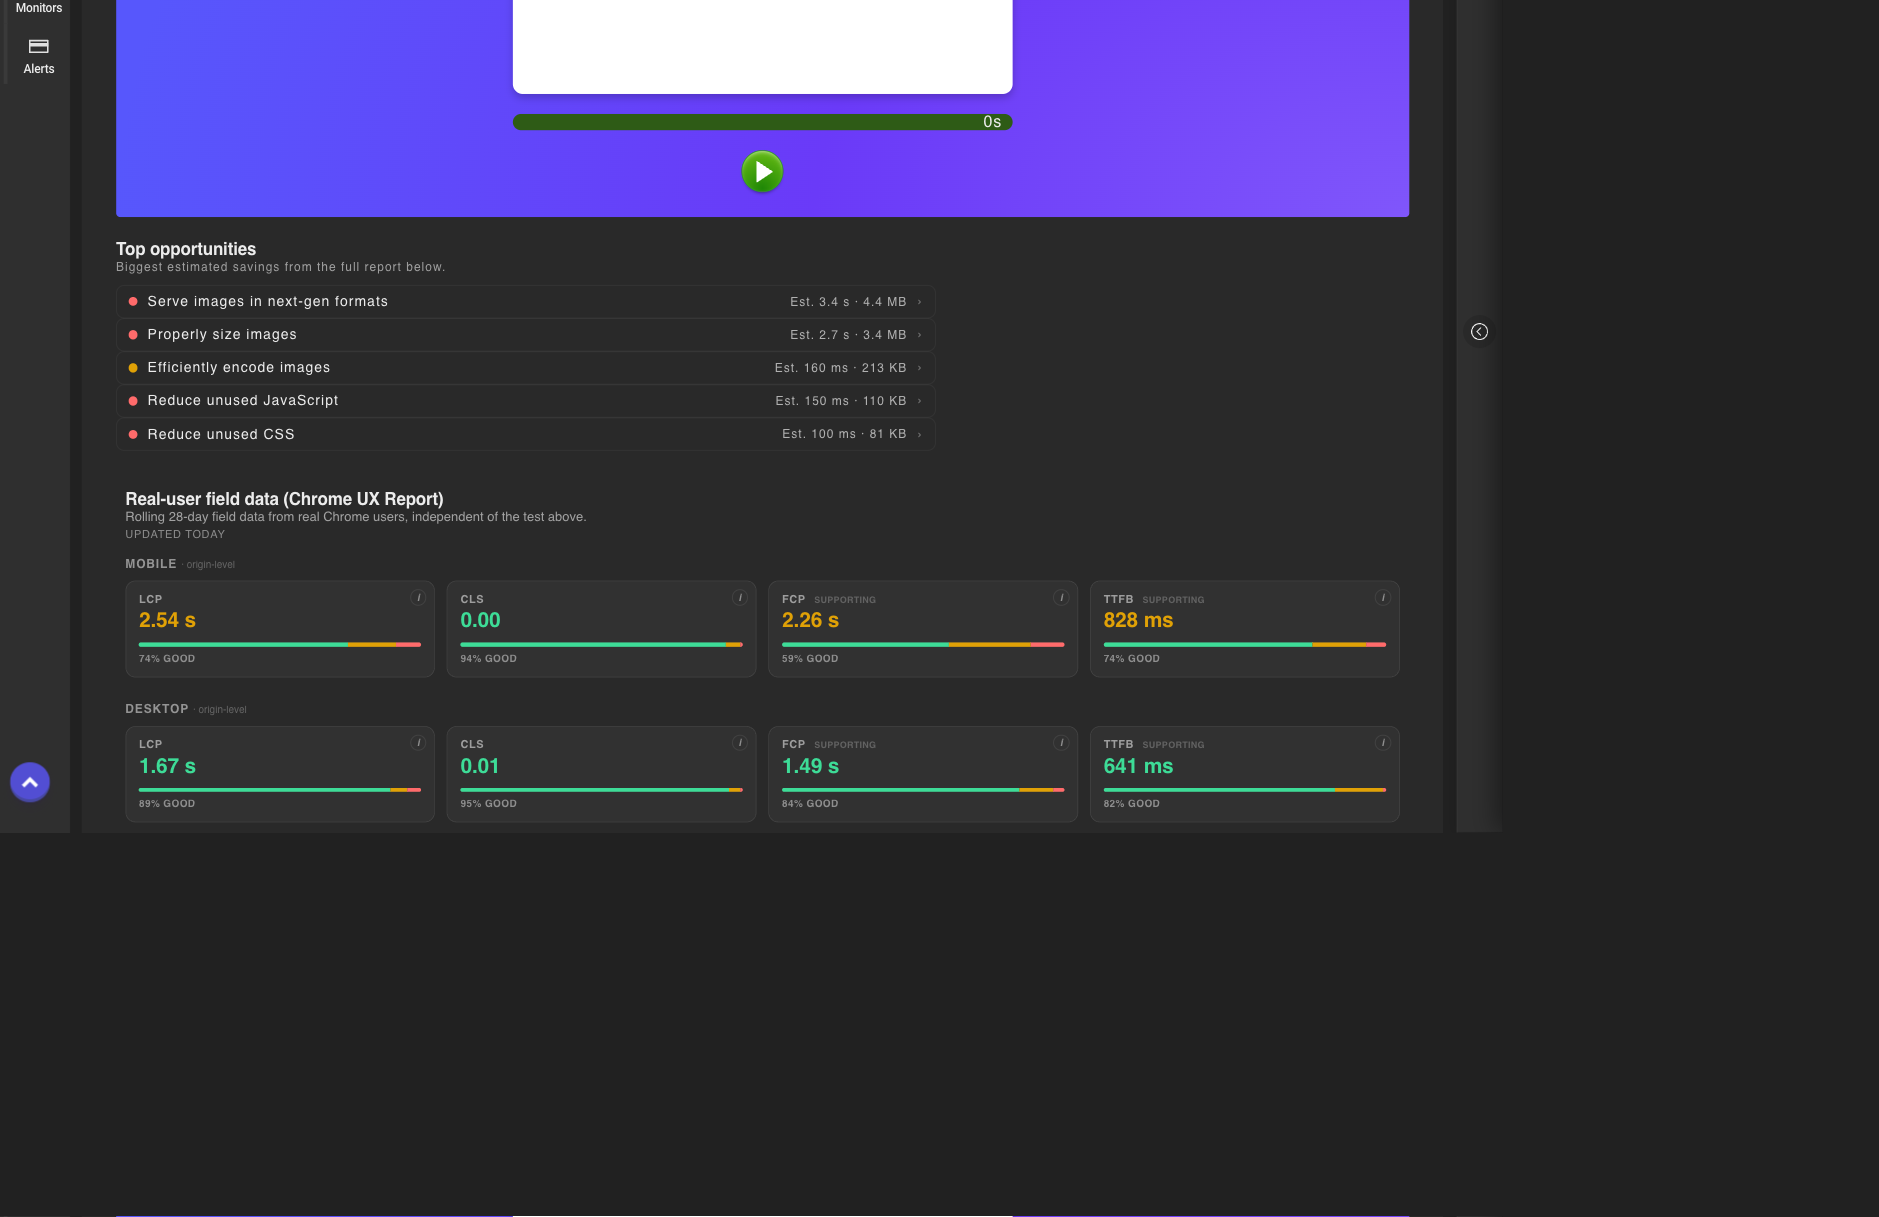
TOP OPPORTUNITIES
Every result surfaces the highest-impact fixes ranked by estimated savings, so you know what to do first.
PERFORMANCE BUDGETS & ALERTS
Set Core Web Vitals budgets and get alerted the moment a metric regresses past Google's recommended thresholds.
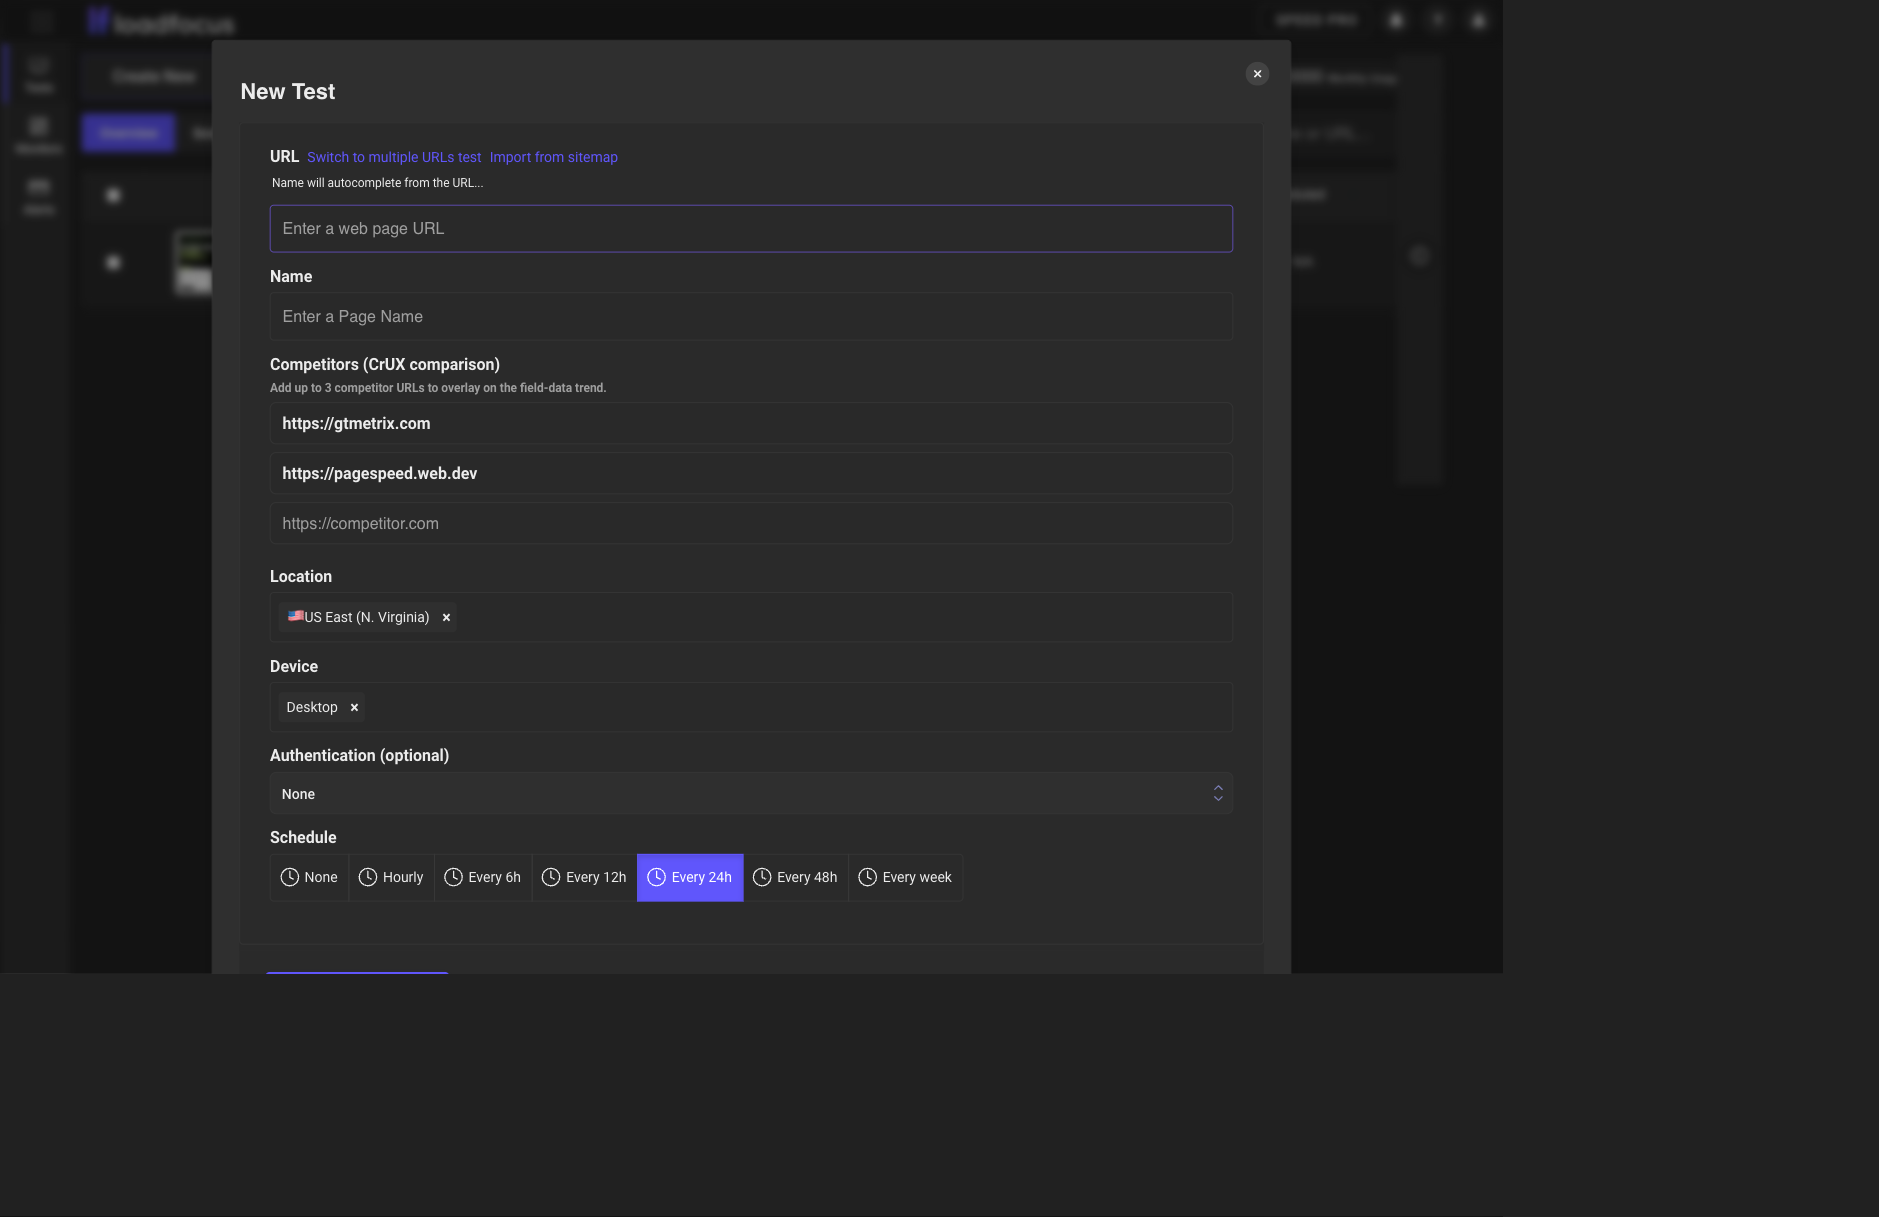
COMPETITOR COMPARISON
Overlay up to three competitors' real-user Core Web Vitals against yours, straight from the Chrome UX Report.
REAL-USER FIELD DATA
See what real visitors experience with Chrome UX Report data, a pass/fail Core Web Vitals badge and weekly trends.
Frequently Asked Questions
Quick answers about page speed monitoring with LoadFocus.
What is page speed monitoring?
Page speed monitoring runs automated Lighthouse audits against your web pages on a schedule and stores the results, so you can track Performance, SEO, Accessibility and Best Practices scores over time and catch regressions when they happen.
How do I monitor all pages of my website at once?
Use the sitemap import: paste your sitemap.xml URL, LoadFocus fetches it and lists the pages, you filter and select the ones to monitor, and one monitor per page is created in a single step. Index sitemaps, gzipped sitemaps and plain text URL lists are supported.
Can I monitor pages that are behind a login?
Yes. Each monitor can send HTTP authentication with every audit: Basic Auth, a Bearer token or a custom header such as a session cookie. Credentials are removed from the stored results.
How often do the monitors run?
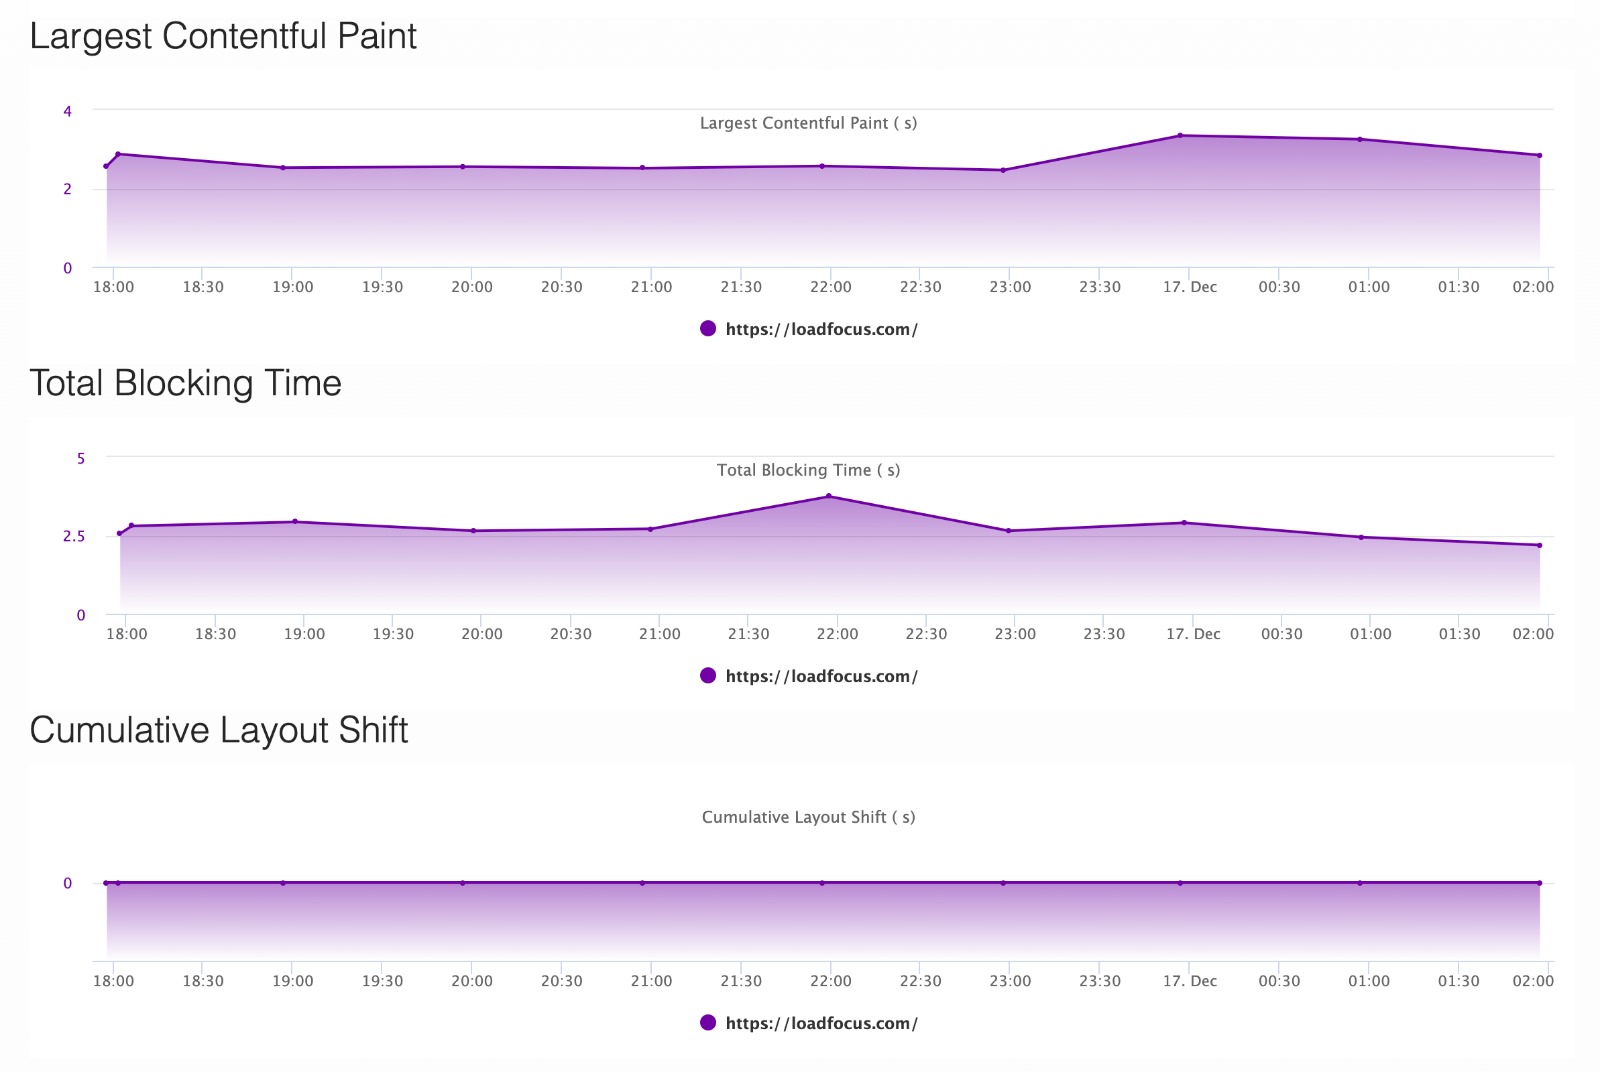
You choose the schedule per monitor: hourly, every 6, 12, 24 or 48 hours, or weekly. Every scheduled run is kept in the history so you can compare any two runs.
Which metrics does LoadFocus track?
Every audit captures the Lighthouse categories (Performance, SEO, Accessibility, Best Practices, PWA) plus Core Web Vitals and timing metrics such as Largest Contentful Paint, Cumulative Layout Shift, Total Blocking Time, First Contentful Paint, Speed Index and Time to Interactive.
How do I get notified when my website slows down?
Create alerts on any score or metric and connect Email, Slack or Microsoft Teams channels. When a scheduled run crosses your threshold, LoadFocus notifies you with a link to the full report.
Outgrown your testing tools?
Load test websites and APIs from 25+ cloud regions, monitor page speed and uptime, and get AI analysis that explains your results in plain English.Start for free→