What is GTmetrix?
GTmetrix is one of the longest-running web performance testing tools, originally built around Google PageSpeed Insights and YSlow scoring before migrating to a custom GTmetrix Grade based on Lighthouse. It runs single-page synthetic tests from 28 test locations worldwide, measures Core Web Vitals and waterfall data, and produces detailed visual reports popular for developer audits and client deliverables.
GTmetrix has a generous free tier (limited monthly tests, single location, basic metrics), paid PRO plans for scheduled monitoring with alerts, and an API for programmatic access. The product is widely used as a one-off page audit tool, "run a GTmetrix on this page and send me the report" is common shorthand in many web teams.
When GTmetrix is the right tool
GTmetrix is genuinely useful for these workflows:
- Ad-hoc page audits. "What's slow about this specific page right now?". GTmetrix delivers a full waterfall and grade in under 30 seconds.
- Client-facing PDF reports. The polished report format is widely accepted as a deliverable for agency work and SEO audits.
- Free single-location quick checks. The free tier covers basic single-location tests adequately for one-off troubleshooting.
- Familiar metric vocabulary. GTmetrix Grade and YSlow scores are widely recognized and part of common web team vernacular.
If your need is "run an audit, look at the report", GTmetrix is a reasonable default.
Where GTmetrix stops being enough
GTmetrix is built for ad-hoc auditing, not continuous performance management. Several gaps show up as soon as you try to operationalize it:
- No load testing. GTmetrix measures one user's page-load experience under normal conditions. It cannot simulate concurrent users to test how your site behaves under traffic spikes.
- No API monitoring. Backend APIs (login, checkout, third-party integrations) need separate validation; GTmetrix only renders pages.
- Limited scheduled monitoring on entry tiers. The free tier and lower paid tiers cap monthly test runs and don't support hourly or sub-hourly cadences without higher-tier plans.
- Locations depend on the plan. GTmetrix lists 28 test locations, and the lower plans include only some of them.
- Reports oriented toward humans, not pipelines. The GTmetrix output is excellent for reading; integrating it as a build-failing assertion in CI requires custom API parsing and is not the primary use case.
LoadFocus vs GTmetrix: feature comparison
The table below compares LoadFocus against GTmetrix's standard PRO plan. GTmetrix prices are approximate, based on its PRO plan list (gtmetrix.com/pro) as of October 2026.
| Feature | LoadFocus | GTmetrix |
|---|---|---|
| Cost | Free tier; page speed from $39/mo ($29/mo billed yearly) | Free tier; PRO from about $5/mo (Lite) |
| Page speed monitoring | Yes | Yes (specialty) |
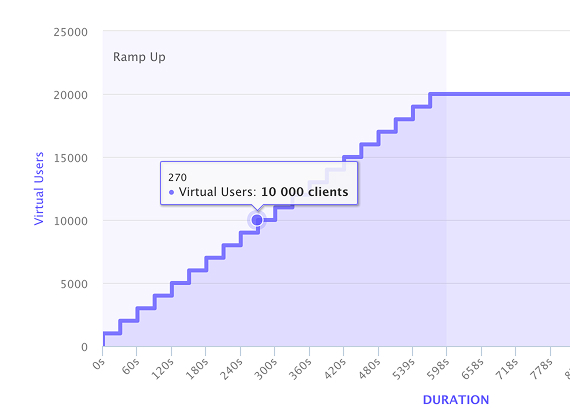
| Load testing | Yes (up to 20,000 VUs on Enterprise) | No |
| API monitoring | Yes | No |
| Lighthouse-based scoring | Yes | Yes (GTmetrix Grade) |
| Test locations | 25 cloud regions | 28 locations (plan-dependent) |
| Scheduled monitoring frequency | Hourly to weekly | Daily/hourly (plan-dependent) |
| Real Chromium browser | Yes | Yes |
| Core Web Vitals tracking | Yes | Yes |
| Real User Monitoring (RUM) | No RUM script of its own; Google CrUX field data with alerts | No |
| GitHub PR comments | Load tests only (GitHub Action workflow) | API integration (manual) |
| CI/CD assertions | Load tests only (CLI, GitHub Action, Jenkins) | API only |
| White-label PDF reports | Yes (paid plans) | PDF reports |
| Budget alerts | Yes | Yes (PRO) |
| Combined platform (load + speed + API) | Yes | Page speed only |
When LoadFocus is the right upgrade from GTmetrix
The decision usually comes down to whether you're doing one-off audits or continuous monitoring with traffic-load context.
You need load testing alongside page speed
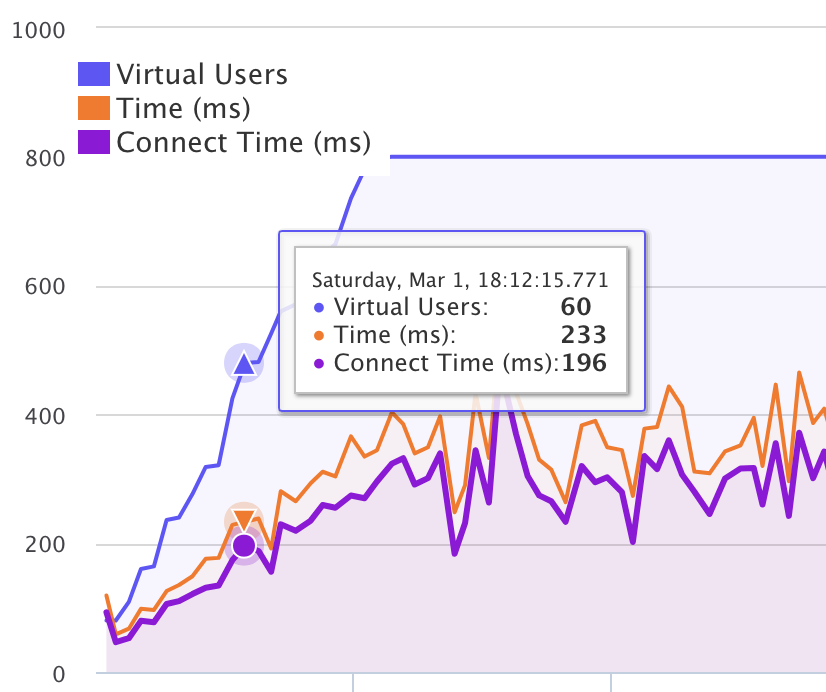
GTmetrix tells you how fast a page loads for one user. It can't tell you what happens when 1,000 users hit the site simultaneously. LoadFocus does both, and the combination matters when investigating regressions, because page speed problems often manifest only under load.
You need API monitoring
If your application has backend APIs, GTmetrix won't help. LoadFocus monitors HTTP/REST endpoints with assertions, scheduled checks, and alerting, same dashboard as page speed.
You want a load test in the build pipeline
GTmetrix can be called through its API, but it is not a build-pipeline tool. LoadFocus load tests run from a CLI, a GitHub Action or the Jenkins plugins and fail the build when response times or error rates miss your thresholds. Page speed checks on LoadFocus run on a schedule rather than from CI.
You hand page speed reports to clients
On paid plans, every LoadFocus page speed result has a printable report you can save as PDF, and you can add your logo, company name and accent colour and remove the LoadFocus branding, which suits agencies that send reports under their own name. For one-off checks there is also the free website speed test and Core Web Vitals checker.
Free GTmetrix alternatives
For a one-off check, several free tools give you the same Lighthouse data GTmetrix starts from:
- Google PageSpeed Insights. Lighthouse lab results plus Google's field data (CrUX) for the URL, from Google's own servers.
- Lighthouse in Chrome DevTools. Runs on your own machine, so the results reflect your connection and hardware.
- WebPageTest. Detailed waterfalls and filmstrips, with a free plan that has a monthly test allowance.
- The LoadFocus website speed test. A Lighthouse audit from US East, on mobile or desktop, with no account; signing up unlocks the other regions. The Core Web Vitals checker adds the field data Google holds for the page.
None of these watch a page over time. For scheduled tests and alerts, GTmetrix PRO and LoadFocus page speed monitoring are both paid; the LoadFocus free plan includes 1 test a month to try it.
Migration from GTmetrix
- Sign up at loadfocus.com/signup.
- Add the URLs you currently monitor in GTmetrix to LoadFocus's page speed monitoring.
- Replicate your GTmetrix schedule (LoadFocus schedules run from hourly to weekly).
- Set Web Vitals budgets matching the thresholds you used in GTmetrix.
- Optionally extend with load testing or API monitoring on the same account.
Run both tools in parallel for a week to verify metric agreement before fully cutting over.
FAQ: LoadFocus vs GTmetrix
Does LoadFocus produce reports as polished as GTmetrix's?
Each LoadFocus result opens the full Lighthouse report, and paid plans add a printable PDF report you can brand with your own logo and colours, or white-label completely. GTmetrix PDFs are well known to clients; LoadFocus PDFs can carry your agency name instead.
Are LoadFocus and GTmetrix scores comparable?
Both use Lighthouse as the underlying engine, so Core Web Vitals values should be within typical run-to-run variance. The composite scores differ. GTmetrix Grade is a custom blend that's not directly equivalent to LoadFocus's Lighthouse score, though they correlate strongly.
Can LoadFocus replicate GTmetrix's waterfall view?
Not as a waterfall chart. Each LoadFocus result includes the full Lighthouse report: filmstrip screenshots, the network requests table with sizes and timings, render-blocking resources and the LCP breakdown. GTmetrix's waterfall, with DNS, connect and SSL time for every request, goes deeper on the network side.
Does LoadFocus offer location-specific testing?
Yes. LoadFocus runs page speed tests from 25 cloud regions, including Mumbai, São Paulo, Cape Town and Tel Aviv. GTmetrix has a similar spread with 28 locations, so pick based on where your users are rather than on the count.
Can I use both tools in parallel?
Yes. GTmetrix is widely used for ad-hoc audits and PDF deliverables, while LoadFocus handles continuous monitoring and combined load/API testing. Many teams use both during transition.
How does pricing compare?
GTmetrix's paid plans now start at about $5/month (Lite, billed yearly) according to its plan list, with one monitored page; higher tiers add more monitored pages, locations and frequency. If you only need scheduled speed checks on a single page, GTmetrix is the cheaper option. LoadFocus page speed monitoring starts at $39/month ($29/month billed yearly) for 300 tests a month, and adds load testing and API monitoring on the same account. The total-cost comparison depends on how many monitoring categories you need.
Try LoadFocus free
If you're using GTmetrix today and want to add scheduled monitoring, load testing, or API checks without managing multiple vendors, LoadFocus consolidates the toolchain. Sign up for a free tier at loadfocus.com/signup, no credit card, and run your first page speed test alongside your existing GTmetrix setup. Decide after.