- Basic Performance Metrics
- Single Location Test
- Desktop Device Only
- Limited Insights
Reduce the risk of downtime
Monitor site availability
Synthetic monitoring runs tests at periodic intervals.
Real Browsers
Checks run in real Chromium browsers to match real-world conditions.
Script Real-World Scenarios
Easily build complex user journeys that replicate real business functionality.
Load Testing
Find out how many users your website or API can handle, with live results as the test runs.
JMeter Load Testing
Run your existing JMeter scripts unchanged from 25 cloud regions.
Page Speed Monitoring
Track your pages' load times from multiple regions and get alerted when they slow down.
Feature-rich synthetic monitoring tool
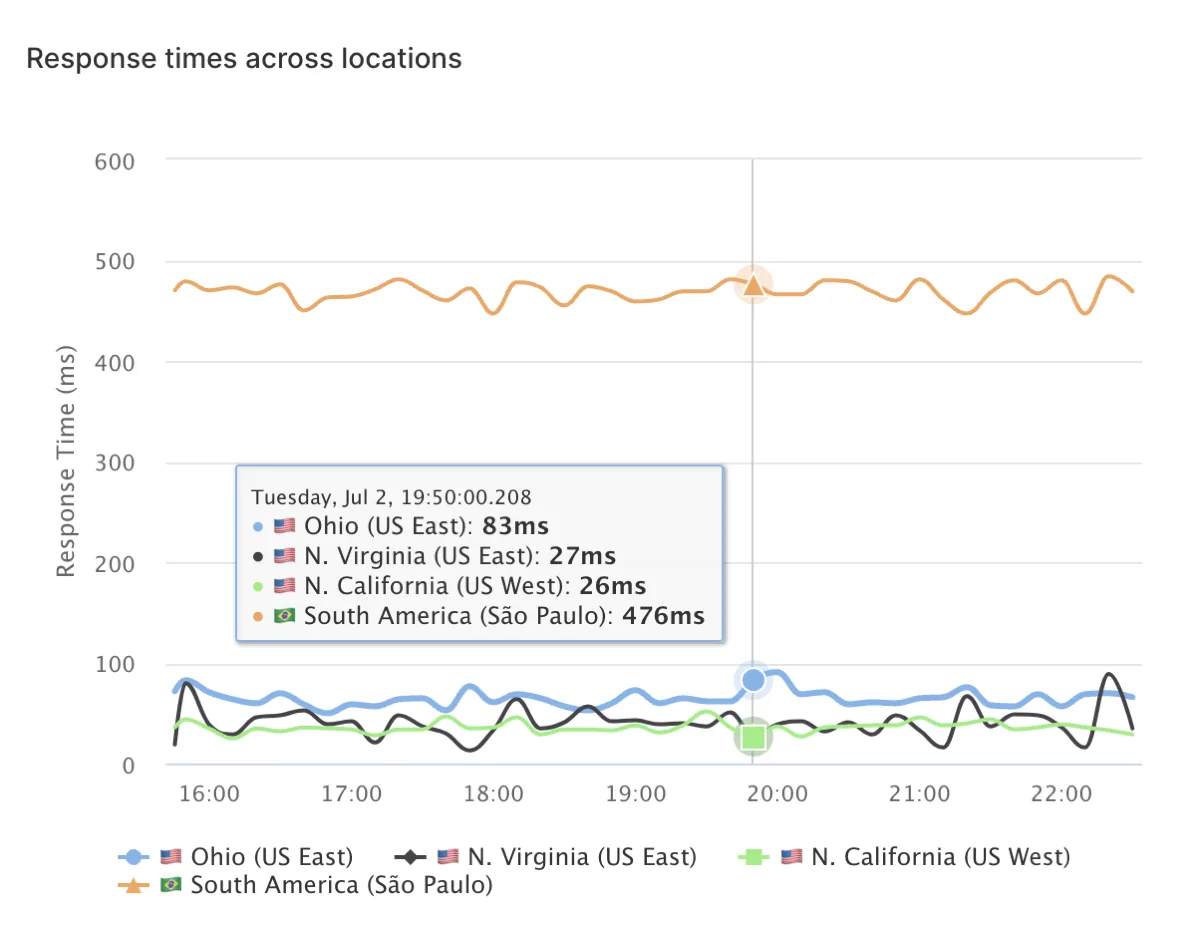
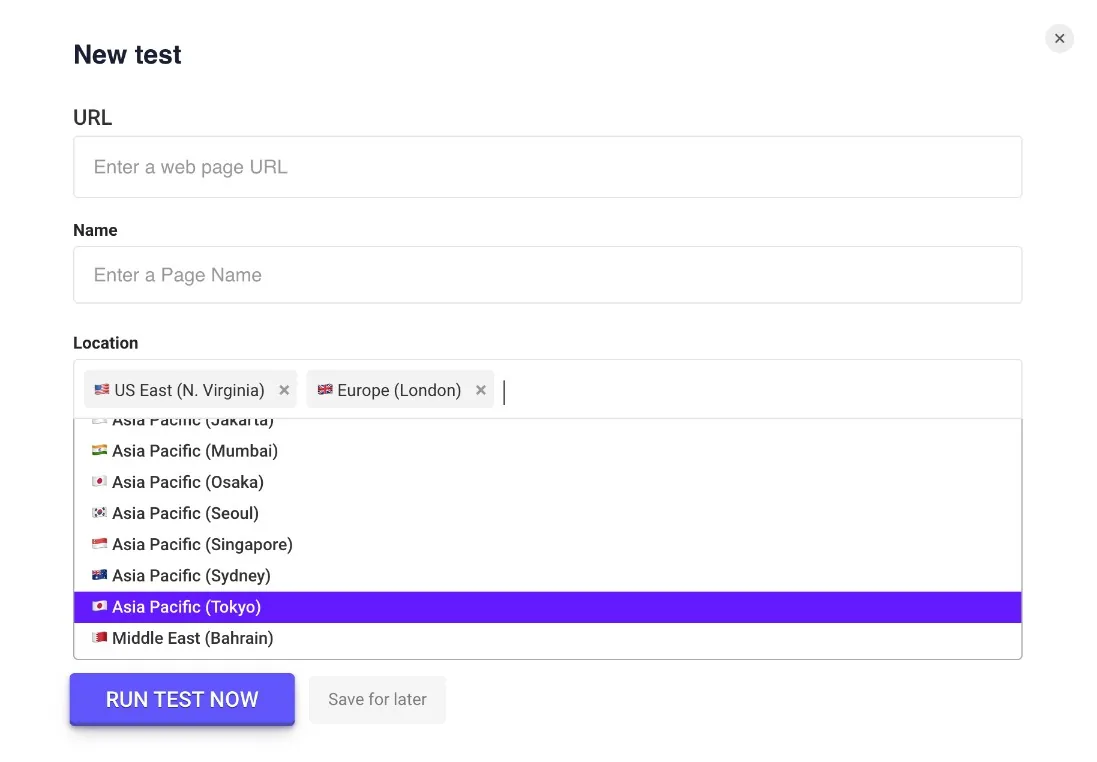
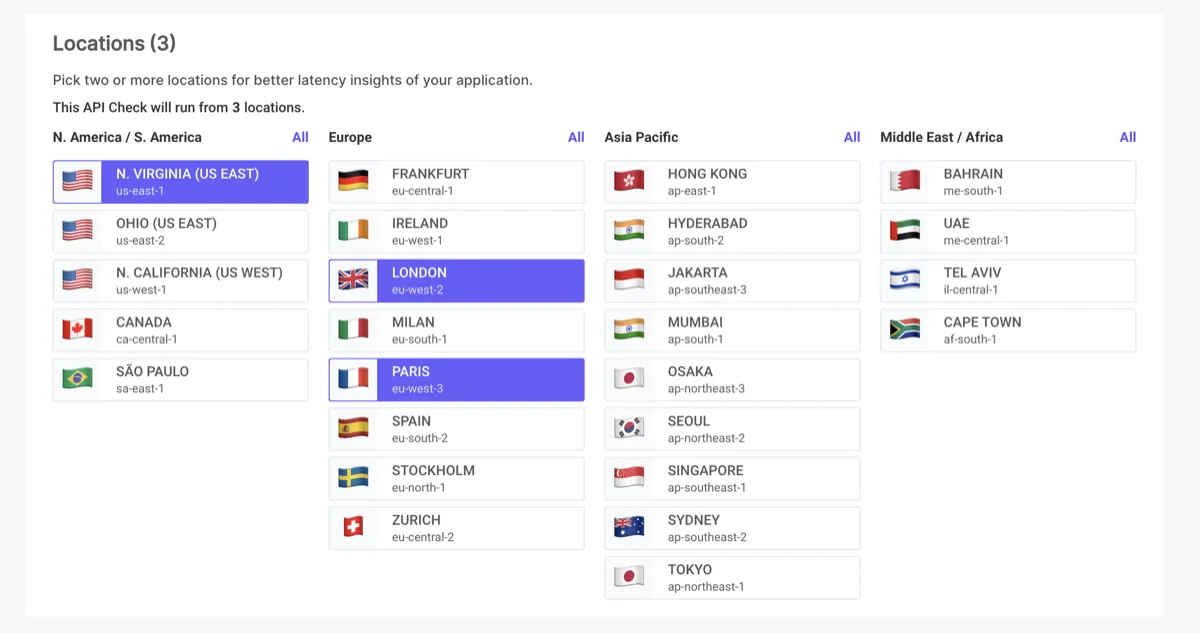
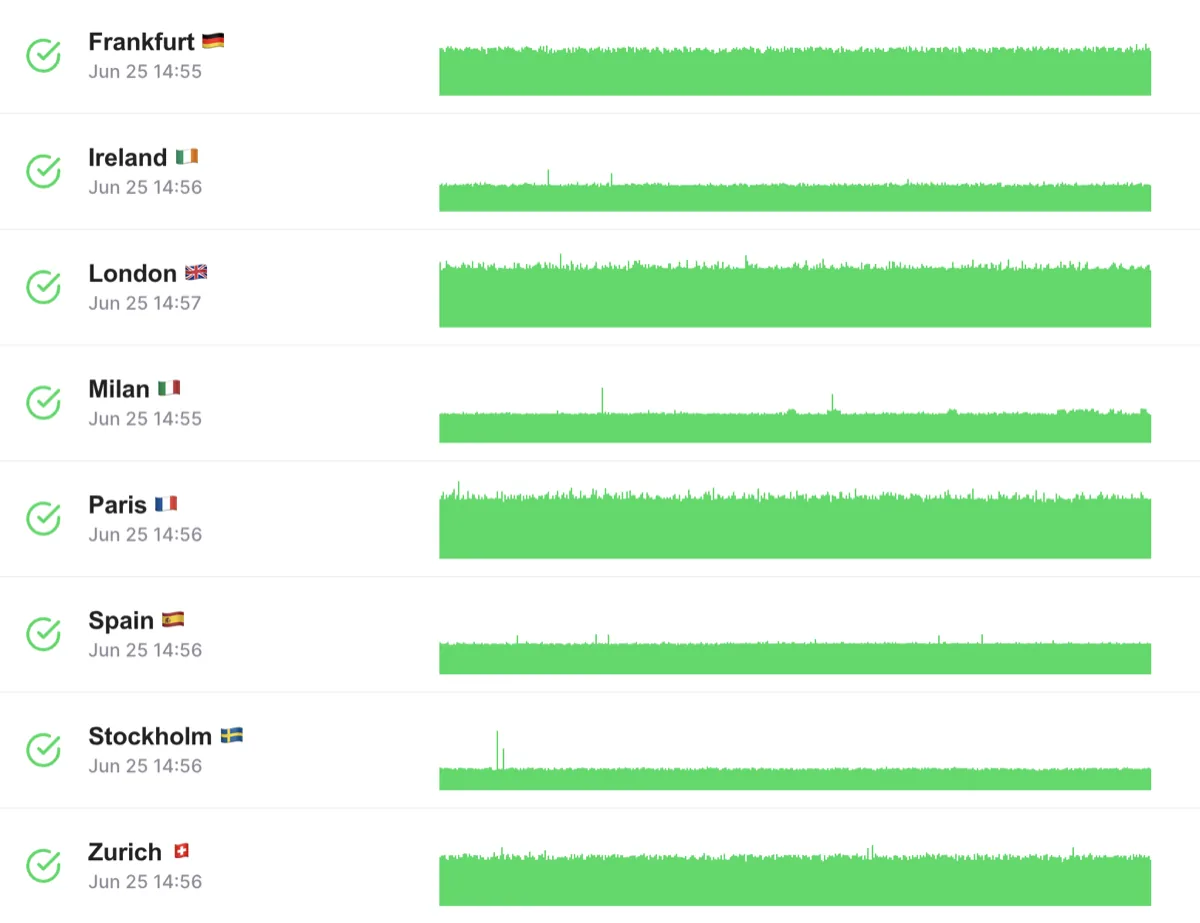
25 cloud regions
Run tests from where your customers are.
Anomaly detection in Monitoring
Easily spot regressions.
Screenshots, Trace & Video
Capture step screenshots, a full Playwright trace and a video on failure.
How it works
Powered by Playwright
Accurately simulate real user interactions in real Chromium browsers.
Browser Checks
Check for specific responses, errors and items.
Collect and Debug Errors
We capture console and network logs, per-step screenshots, and a Playwright trace plus video on failure.
Start using
Synthetic Monitoring
Simulate visitor interaction with your site to monitor the end user experience.
Works with the rest of LoadFocus
Synthetic monitoring runs alongside the rest of the platform, in the same account and on the same alert channels.
API monitoring · Uptime monitoring · Status pages · Monitoring as Code · What is synthetic monitoring? · Synthetic monitoring vs RUM · New Relic Synthetics alternative · Synthetic monitoring docs
Synthetic monitoring FAQ
What is synthetic monitoring?
Synthetic monitoring runs scripted checks against your site and APIs on a schedule from external locations, instead of waiting for real traffic to reveal a problem. It tells you an endpoint or a user journey is broken before a customer finds it.
What is the difference between synthetic monitoring and real user monitoring?
Synthetic monitoring runs your own scripted checks on a fixed schedule, so you get consistent data even when traffic is low. Real user monitoring reports what actual visitors experienced. Synthetic tells you something is down, real user monitoring tells you how many people it affected.
Which synthetic monitoring tools does LoadFocus include?
API checks for single endpoints, multi-step API checks for chained request flows, and browser checks that drive a real browser through a full user journey with Playwright. All three run from the same cloud regions and share the same alert channels.
Which browser do synthetic browser checks use?
Browser checks run a Playwright script in headless Chromium from LoadFocus cloud regions, so the flow is exercised the way a visitor would experience it rather than as a plain HTTP request.
What do I get when a synthetic check fails?
Every run captures screenshots of the pages visited, browser console logs, network logs for every request, per-step timings and a Playwright trace you can replay step by step. Video on failure can be enabled as well.
How many locations can synthetic checks run from?
Checks run from 25 cloud regions, so you can see how a journey performs from where your users actually are, not just from one data centre.
Is synthetic monitoring included on the free plan?
Browser checks run on paid plans and have their own monthly browser-run quota, separate from API check runs. API and uptime checks are included on the free plan.
Can I monitor a multi-step user journey?
Yes. A browser check can sign in, search, add to basket and walk through checkout in one script, then report which step failed or slowed down. Multi-step API checks do the same for chained request flows such as login, token and call.
Further reading
In-depth guides on the same topic from the LoadFocus blog.