Optimize Your API Performance
Are your APIs responding slowly?
Poor API performance can impact user experience and business operations.
Pinpoint Performance Issues
Analyze API metrics, validate payloads, and track response times.
Solutions for Robust APIs
Utilize LoadFocus for comprehensive advice on enhancing API performance and reliability.
Advantages of Real-time API Monitoring
Why focus on API monitoring?
Efficient APIs improve user experience and business workflows.
Tailored Monitoring Strategies
Get insights specific to your API's performance and areas for improvement.
Beyond Speed and Uptime
Use LoadFocus to enhance API reliability, reduce downtimes, and improve overall service quality.
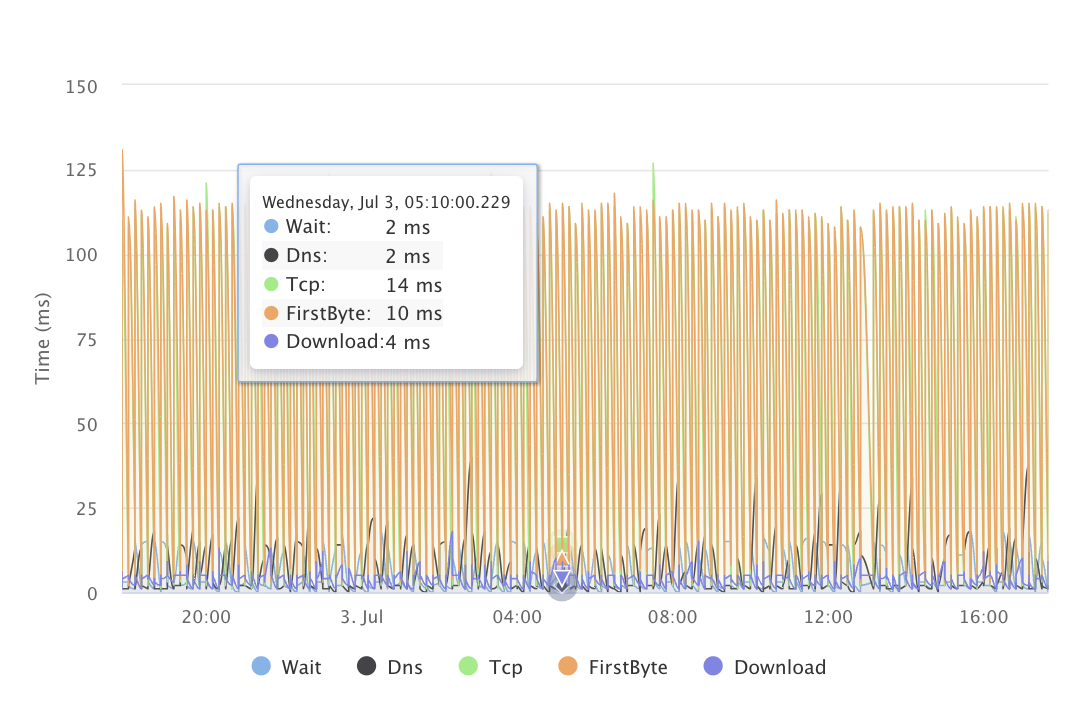
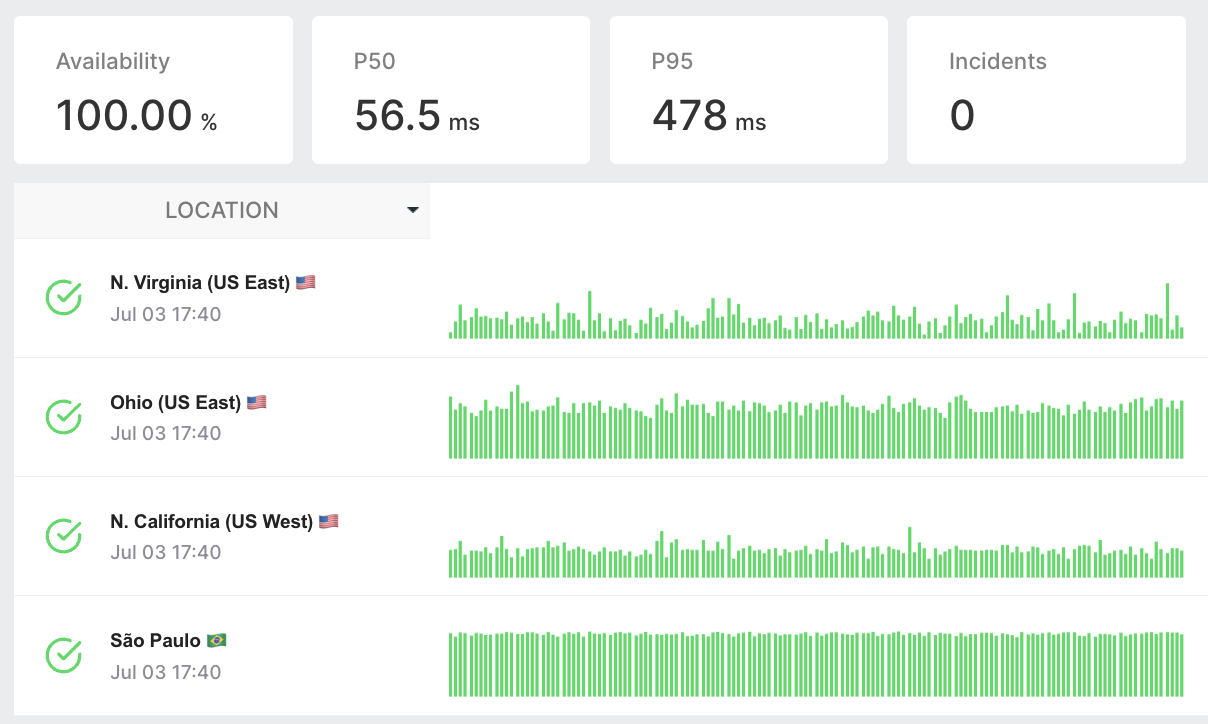
Comprehensive API Health Analysis
Ensure your APIs are always up and running.
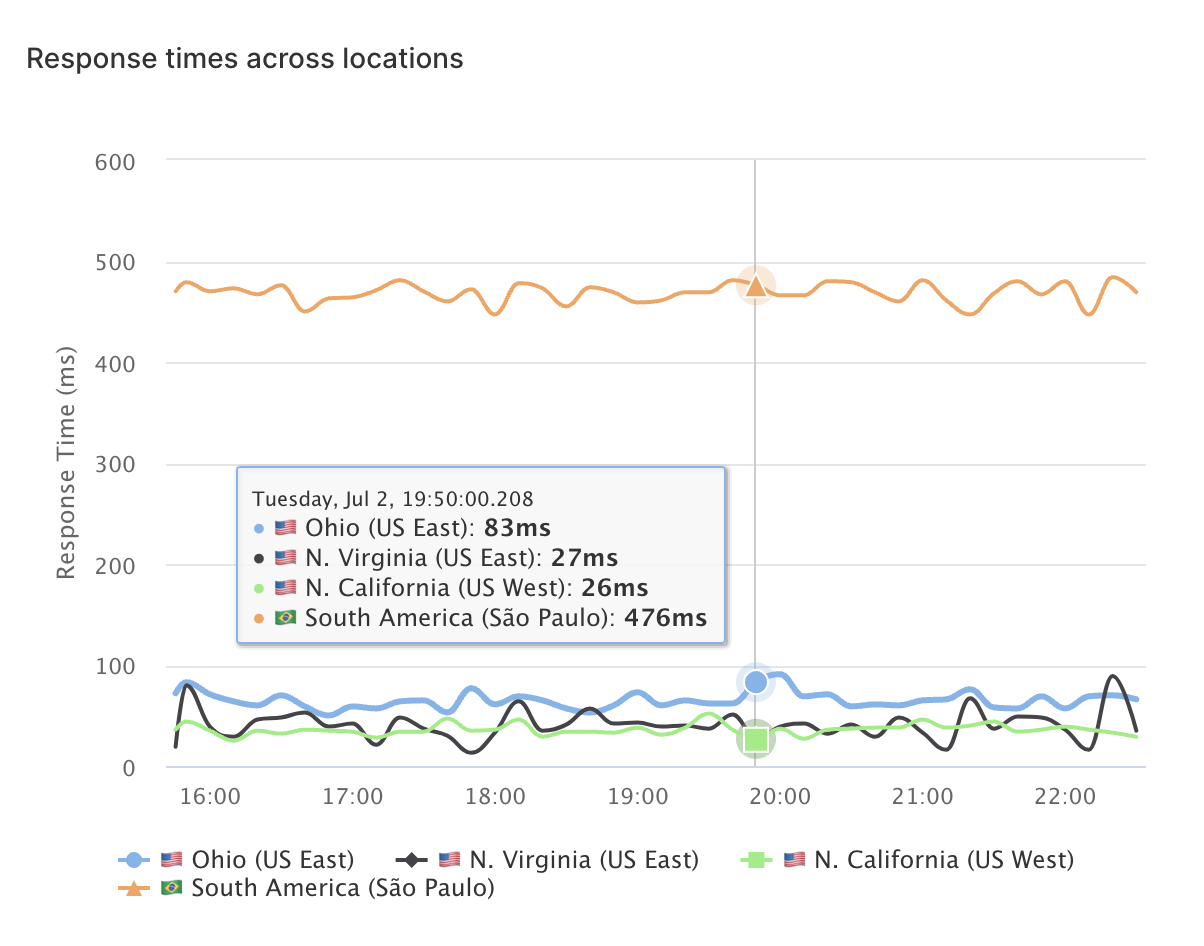
Monitor API availability and response times from multiple global cloud locations.
Real-time Anomaly Detection
Quickly identify and resolve API issues.
Monitor API Agreements
Keep track of SLAs and ensure your APIs meet expected performance standards.
Choose LoadFocus for API Monitoring 🚀
Seeking detailed API insights?
Users trust us for in-depth, real-time API performance monitoring.
Extensive API Metrics
Beyond basic checks, LoadFocus offers deep insights into API health and performance.
Intuitive Interface
Our platform is user-friendly, enabling easy understanding and management of API health.
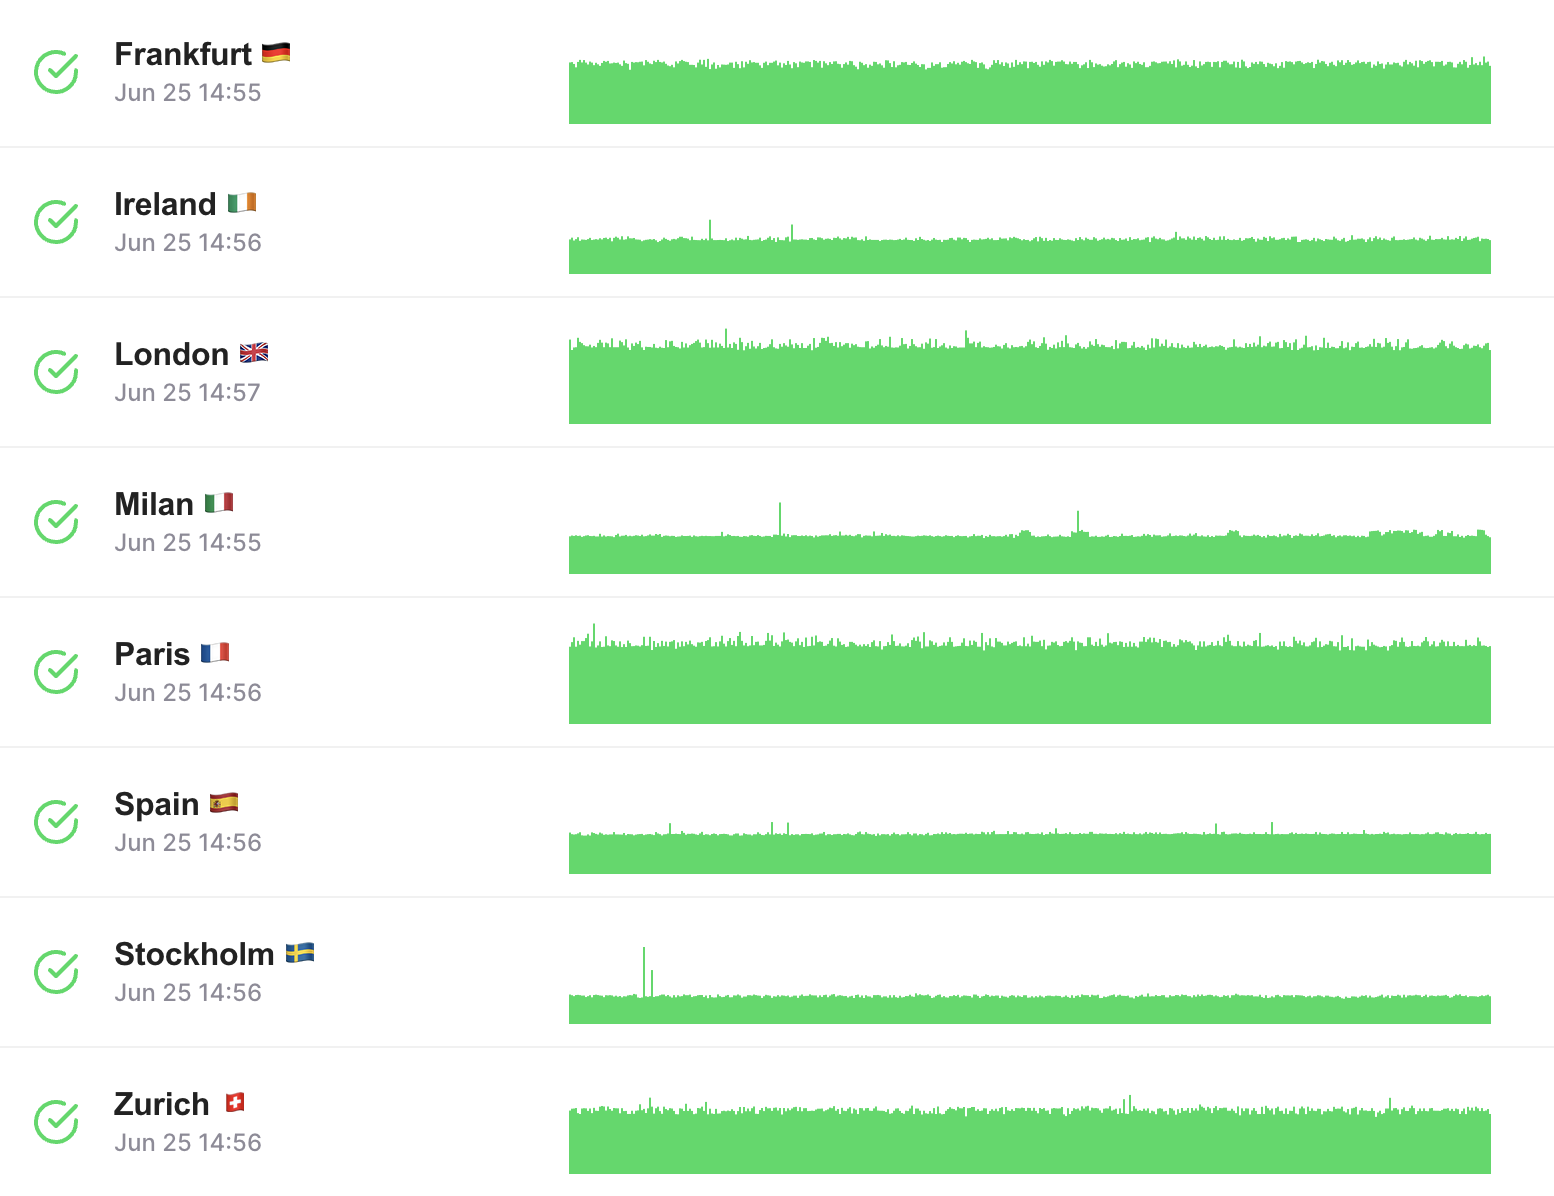
Global API Monitoring 🌍
Curious about how your APIs perform globally?
Businesses worldwide use LoadFocus to monitor API performance across different regions.
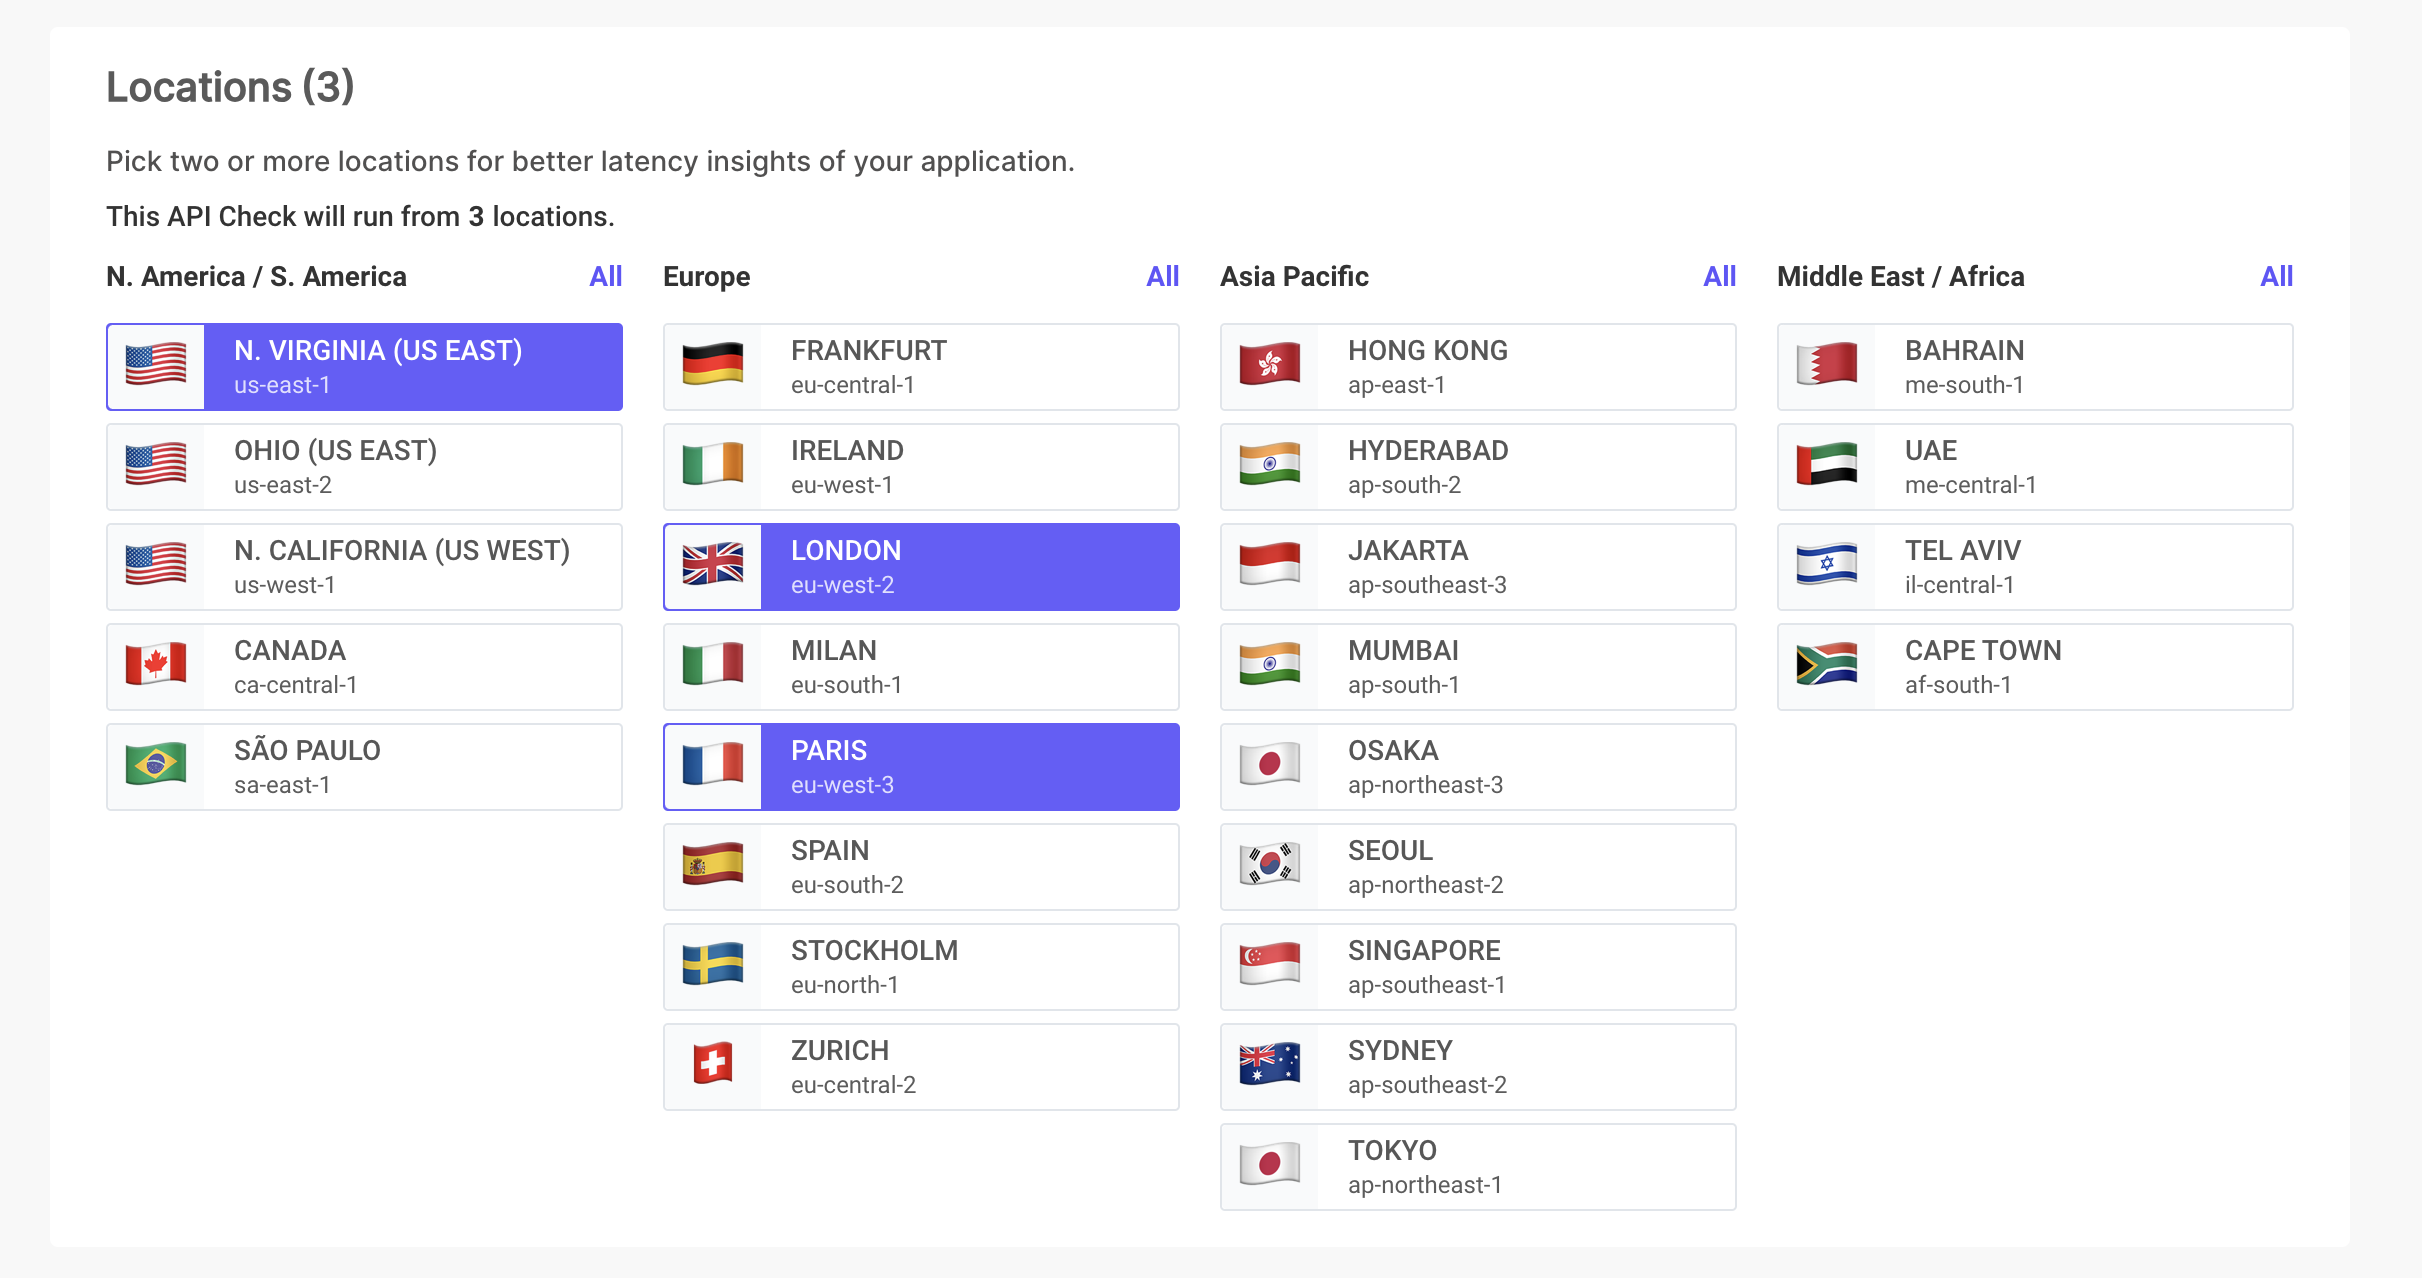
Diverse Monitoring Locations
Test and monitor your APIs from various locations to ensure global performance consistency.
Optimize for Worldwide Reach
Adjust your APIs to serve an international audience effectively, ensuring reliability everywhere.
Browser Checks and Multistep API Flows
Do your user flows break between API calls?
Replay real Playwright scripts across 26 regions to catch failures in login, checkout, and other critical paths before your users do.
Chained Requests with Data Passing
Pass values from one step to the next - pull a token from the login response and inject it into the next request header. No scripting workarounds needed.
Reusable Code Snippets
Share common logic across checks with require('./snippets/name'). Update the snippet once and every check that uses it picks up the change.
TCP, DNS and Heartbeat Monitors
Need to monitor more than HTTP?
TCP monitors verify that any port is open and accepting connections. DNS monitors confirm your records resolve to the right values from 26 regions.
Heartbeat and Cron-job Monitoring
Send a ping after each scheduled job runs. If the ping stops arriving, LoadFocus alerts you. Catches silent failures in background jobs, data pipelines, and batch processes.
Catch What HTTP Checks Miss
A TCP check tells you the database port is open. A DNS check catches propagation issues. A heartbeat check tells you the nightly backup actually finished.
Status Pages, Dashboards and Check Groups
Want a single view of all your service health?
Public and private status pages show real-time uptime, incident history, and response time charts. Subscribe your customers to incidents the moment they start.
Check Groups and Maintenance Windows
Group related checks together and mute alerts during planned maintenance windows. No alert storms during deployments, no false pages to your on-call team.
Dashboards for Every Team
Shared dashboards surface the checks your team cares about. Every metric in one view, from API response times to uptime percentage across regions.
Monitoring as Code and OpenAPI Import
Want to manage your monitors the same way you manage your infrastructure?
Define checks in YAML or JSON and push them via the API or CLI. Version-control your monitoring config alongside your code and roll out monitor changes in CI.
OpenAPI and Swagger Import
Point LoadFocus at an OpenAPI 3.x or Swagger 2.0 spec and it generates one monitor per operation automatically. No manual setup for each endpoint.
Consistent Coverage from Day One
New endpoints added to your spec get monitors on the next import. Deleted endpoints get cleaned up. Your monitoring stays in sync with your API as it evolves.