Key takeaways
- You can run a load test in LoadFocus without writing a script, then ask the AI to analyse the finished run. You tell it your tech stack (languages, frameworks, database, server, cloud) and it phrases its recommendations for that stack.
- It reads the run’s numbers: response times, error rates, throughput and percentiles. It does not see your code, your database or your servers.
- The analysis is a starting list of suspects, not a benchmark. A small test cannot say how your system scales, and the AI says so itself.
Can I do AI load testing without writing code?
Yes, for the common case. LoadFocus’s cloud load test takes URLs and a load profile (virtual users, duration, ramp-up) from a form, with no script. When the run finishes, the AI Assist tab can analyse it: a plain-language summary, the bottlenecks the metrics point to and recommendations tailored to the stack you selected. LoadFocus lists the analysis for cloud, JMeter and k6 tests (AI load test analysis, read 2026-10-23). If you want a script, “Create with AI” writes a k6 or JMeter one from a plain-English description, but that is a different feature from the no-code form.
What the AI actually reads
The input is the result of a run you already did: average and maximum response time, error rate, throughput and percentiles. From those it correlates, for example, response-time degradation with the point in the ramp-up where it began. That is the part that takes longest by hand.
Two limits follow from that:
- It cannot see inside your system. “MongoDB queries are slow” is an inference from latency patterns plus the database you named, not something it measured. Confirm it with your own database profiler or traces.
- A tiny test says little. The example below used 5 virtual users for 60 seconds. The AI’s own output says the system’s behaviour under higher load is unknown and still needs testing.
Step by step: run a test and analyse it
1. Run the load test
Create a load test in LoadFocus (or run a JMeter test there), set virtual users, duration and ramp-up, and run it. For a first look, a short low-load run is enough to try the analysis, but do not read capacity conclusions from it. For how the ramp-up settings behave, see the JMeter ramp-up guide.
2. Set your tech stack
Open the AI Assist tab on the result and choose New AI Analysis (marked beta in the docs). Pick a saved tech stack or create one: programming languages, frameworks and libraries, database, application or web server, cloud provider, plus optional notes. Give it a name so you can reuse it.
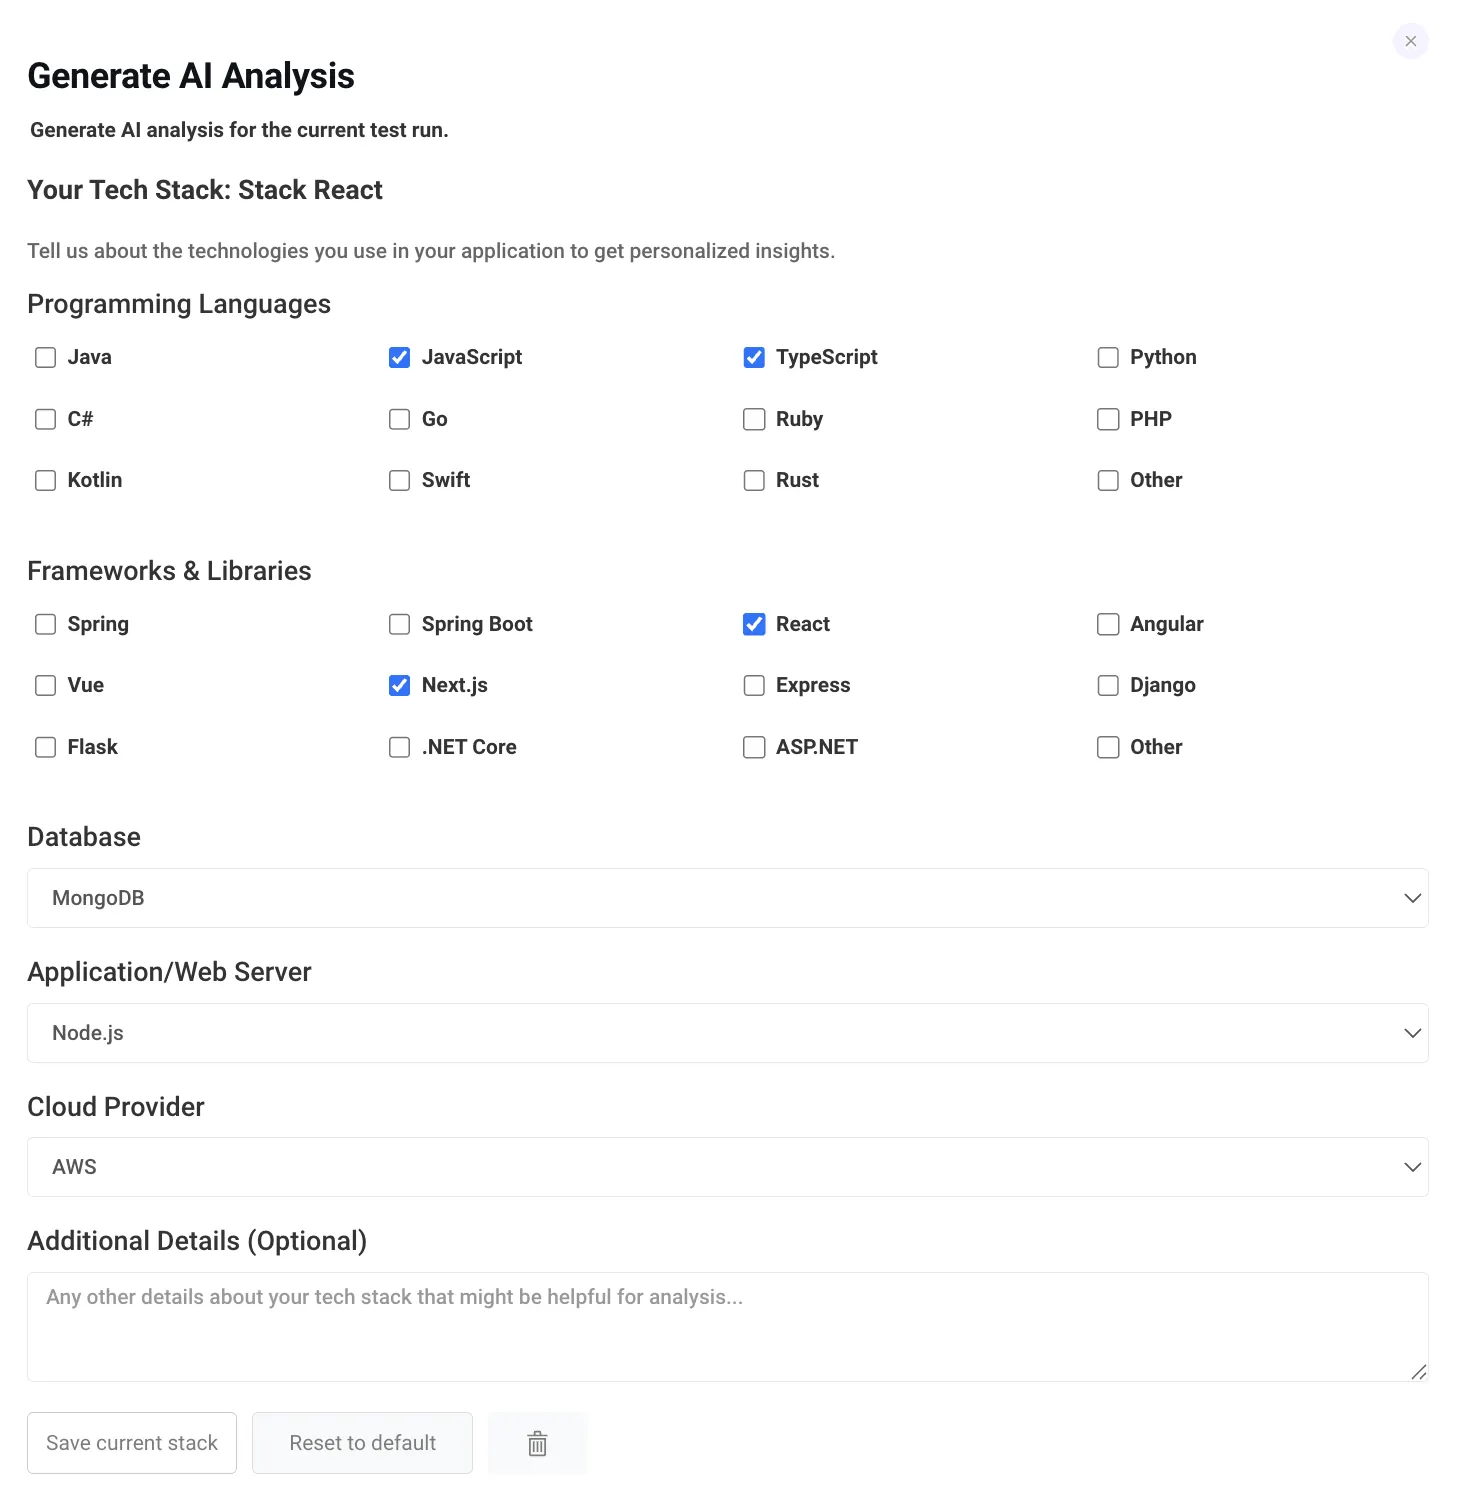
The stack form, with a React, Next.js, MongoDB, Node.js and AWS stack selected.
3. Read the analysis
Each analysis shows a performance summary (average and maximum response time, error rate, throughput), a throughput analysis, areas for improvement and next steps. This one came from a real 5 user, 60 second JMeter run:
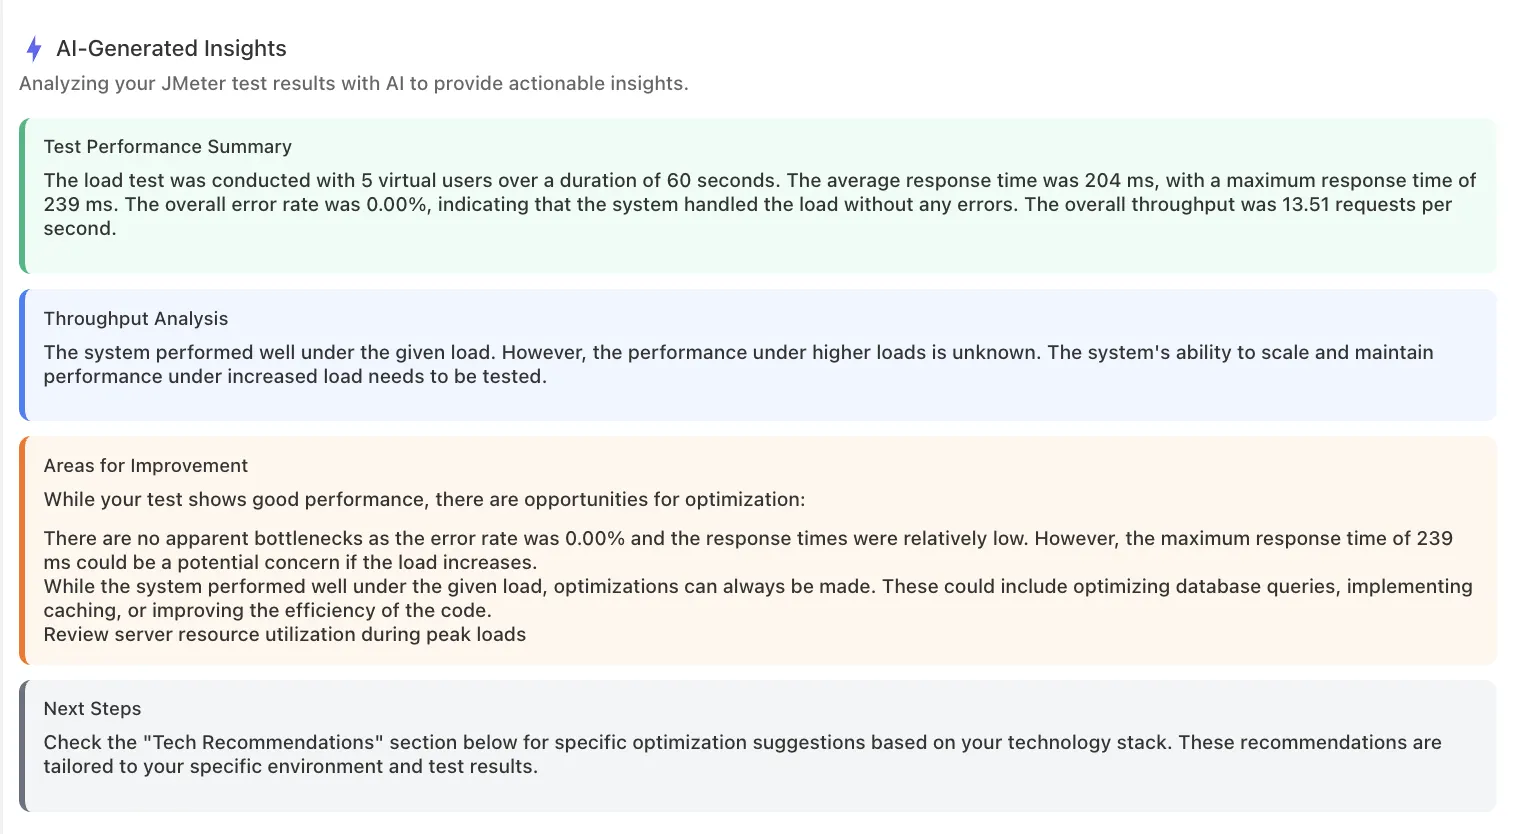
Summary of a small JMeter run: 204 ms average, 239 ms maximum, no errors, 13.51 requests per second. Note the analysis itself says performance under higher load is unknown.
Below the insights, a Tech Stack Recommendations section lists prioritised actions with High, Medium or Low impact:
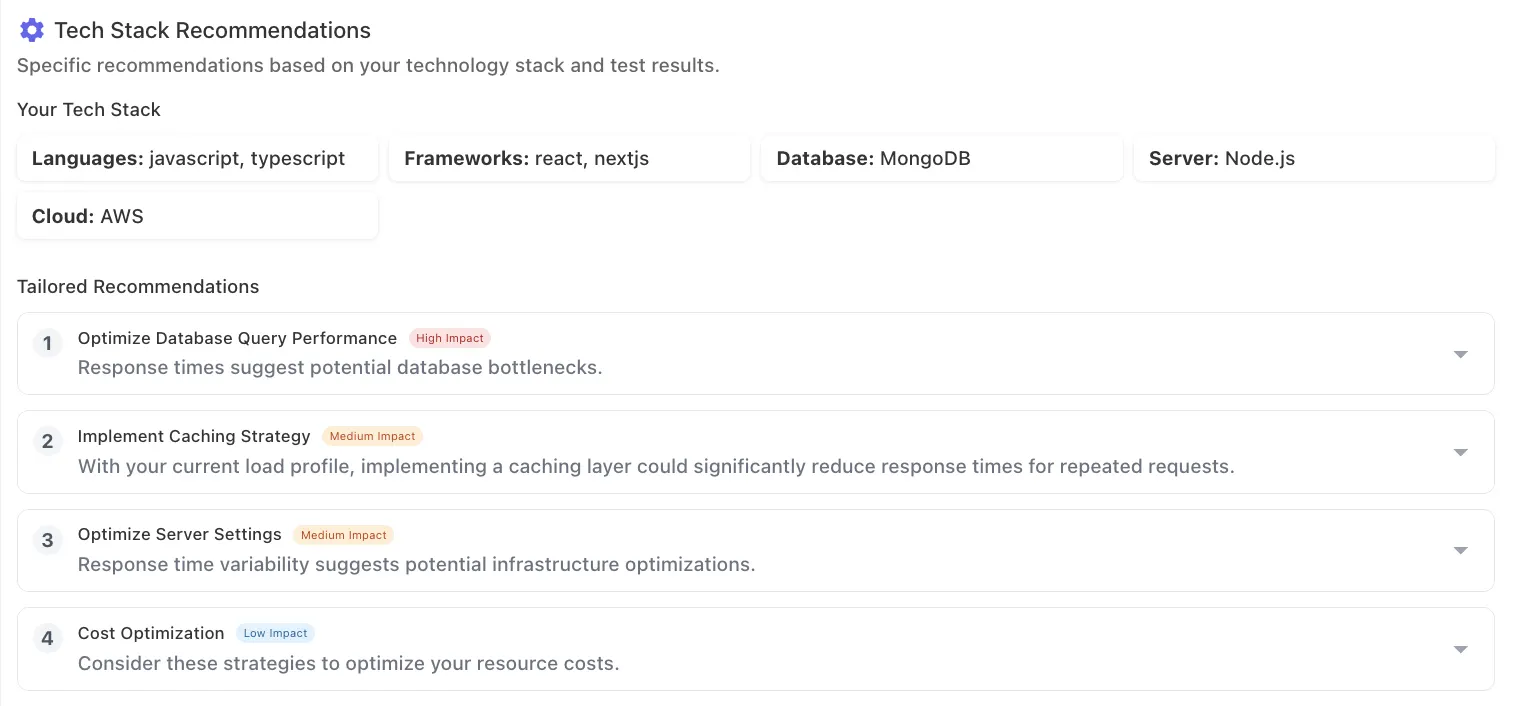
Recommendations for the stack above. The first two read “Response times suggest potential database bottlenecks” and “implementing a caching layer could significantly reduce response times for repeated requests”.
The LoadFocus docs give example recommendations of the same kind for that stack: optimise MongoDB indexes, use Next.js server-side rendering, add a caching layer such as Redis or CloudFront, configure AWS auto scaling, consider Lambda or Fargate for cost. These are examples of the format from the docs, not findings about your system.
4. Save or share it
Each entry in the analysis list has a Print icon; your browser’s print dialog then lets you choose Save as PDF. You can delete an analysis and generate a new one for the same run.
How many analyses do I get?
Every plan includes AI analysis, with a monthly allowance: 3 analyses every 30 days on Free, 5 on Starter and Basic, 10 on Essential, 50 on Pro and 100 on Enterprise, and credit packs top up the allowance (loadfocus.com/ai-load-test-analysis, 2026-10-23). The docs page on AI credits explains how plan credits, packs and team sharing work. See the pricing page for plan details; this post prints no prices.
Is it a benchmark?
No. The word fits a repeatable measurement against a fixed baseline, and an AI summary of one run is not that. If you want to compare two builds or two stacks, run the same test, with the same load profile and the same test data, against each and compare the numbers directly; LoadFocus has a baseline comparison feature for that, described in how to compare two load tests. Use the AI to explain a difference, not to establish it. An earlier version of this post claimed stack-by-stack benchmarking and time savings with no source; they are removed.
Check what the AI says before acting on it
An analysis can sound plausible and still point at the wrong thing. Three habits help:
- Treat each recommendation as a hypothesis, and confirm it with a profiler, slow query log or trace.
- Change one thing, rerun the identical test and compare. If the number did not move, the recommendation was wrong for your system.
- If the AI wrote your test script, read it first. The checklist for AI-generated test scripts lists what to verify, and what AI can and cannot do for script maintenance covers the follow-up work.
For the wider picture, what AI performance testing tools actually do and scripted versus codeless API load testing cover when no-code is enough and when you need a script.
Frequently Asked Questions
Does performance testing need coding?
Not for a basic load test of URLs: LoadFocus’s form needs no script. Custom logins, correlation and multi-step flows usually need a JMeter or k6 script, which you can write, import or have the AI draft and then review.
Does JMeter require coding?
JMeter is built mostly in its GUI, but dynamic values and custom logic often call for scripting elements such as JSR223 with Groovy. JMeter scripts run on LoadFocus unchanged; see the JMeter load testing page.
What is a tech stack in load testing?
The languages, frameworks, database, web server and cloud provider your application runs on. In LoadFocus you select them so the AI can phrase its suggestions in terms of, for example, Node.js, MongoDB and AWS.
Which tests can the AI analyse?
LoadFocus states that analysis works on finished cloud, JMeter and k6 tests.
Can the AI replace a performance engineer?
No. It speeds up the first read of a result. Deciding which test to run, whether the data is realistic and whether a suggested fix is safe still takes a person.
Sources
- LoadFocus AI load test analysis, loadfocus.com/ai-load-test-analysis (read 2026-10-23)
- LoadFocus docs, Load Testing Results AI Analysis, loadfocus.com/docs/guides/load-testing/load-test-result-ai-analysis (read 2026-10-23)
- LoadFocus load testing, loadfocus.com/load-testing (read 2026-10-23)
- The three screenshots are from LoadFocus’s own AI Assist feature, each viewed this session