Why Most Web Applications Fall Short on Performance Benchmarks
When web applications miss the mark on performance benchmarks for web applications, the consequences are immediate and costly. Users leave after just a few seconds of sluggishness. Conversion rates drop as visitors abandon slow checkouts. Even SEO rankings can suffer, since search engines prioritize user experience. This is not theoretical – if your app lags in speed or reliability, you risk losing both users and revenue to faster competitors.
Key Insight: Many web apps that appear fast in controlled tests struggle under real-world traffic and unpredictable user behavior.
The Mirage of Initial Speed
It’s common for teams to celebrate a successful launch after their app posts strong results in synthetic benchmarks. Yet, as real users begin uploading files, creating accounts, or making API calls, performance often degrades. Issues like cache thrashing, memory leaks, and third-party scripts can quietly erode speed and responsiveness over time. Without ongoing monitoring, these problems accumulate, undermining the initial gains.
Is Your Infrastructure Ready for Global Traffic Spikes?
Unexpected load surges can disrupt your services. With LoadFocus’s cutting-edge Load Testing solutions, simulate real-world traffic from multiple global locations in a single test. Our advanced engine dynamically upscales and downscales virtual users in real time, delivering comprehensive reports that empower you to identify and resolve performance bottlenecks before they affect your users.
Common Patterns Behind Long-Term Slowdowns
- Static tests only: Relying solely on lab tools such as WebXPRT 4 or Basemark Web 3.0, while ignoring live traffic patterns.
- Ignoring mobile: Optimizing for desktop and overlooking the impact on mobile users, leading to higher bounce rates on mobile devices.
- Neglecting cumulative impact: Overlooking how incremental changes – like extra scripts or uncompressed images – compound over weeks or months.
The Hidden Costs of Poor Performance
Missing performance benchmarks doesn’t just slow your site – it directly affects user retention and revenue. Even modest delays in Largest Contentful Paint (LCP) or Time to First Byte (TTFB) can increase bounce rates. On mobile, slow performance is especially punishing, often leading to higher abandonment in regions with slower networks.
Lab Tests vs. Real-World Users
Synthetic benchmarks are valuable for catching regressions and comparing frameworks. For example, Fiber achieved 11,987,976 responses per second in plaintext tests, far surpassing Express’s 1,204,969. However, these numbers only tell part of the story. Real-user monitoring uncovers issues that controlled tests miss, such as network variability, outdated devices, and unpredictable user actions. A site may excel in lab scores but still frustrate users if a new third-party widget slows load times.
Effective teams combine synthetic tools with continuous real-world monitoring. Automated tests catch code-level issues, while platforms like LoadFocus track user metrics across geographies and devices. This dual approach is essential for identifying and resolving issues before they impact your business.
Think your website can handle a traffic spike?
Fair enough, but why leave it to chance? Uncover your website’s true limits with LoadFocus’s cloud-based Load Testing for Web Apps, Websites, and APIs. Avoid the risk of costly downtimes and missed opportunities—find out before your users do!
Performance is not a one-time achievement. It’s a dynamic metric shaped by user habits, device diversity, and ongoing feature development. The fastest web apps treat speed as a continuous priority.
The Fundamentals: What Are Performance Benchmarks for Web Applications?
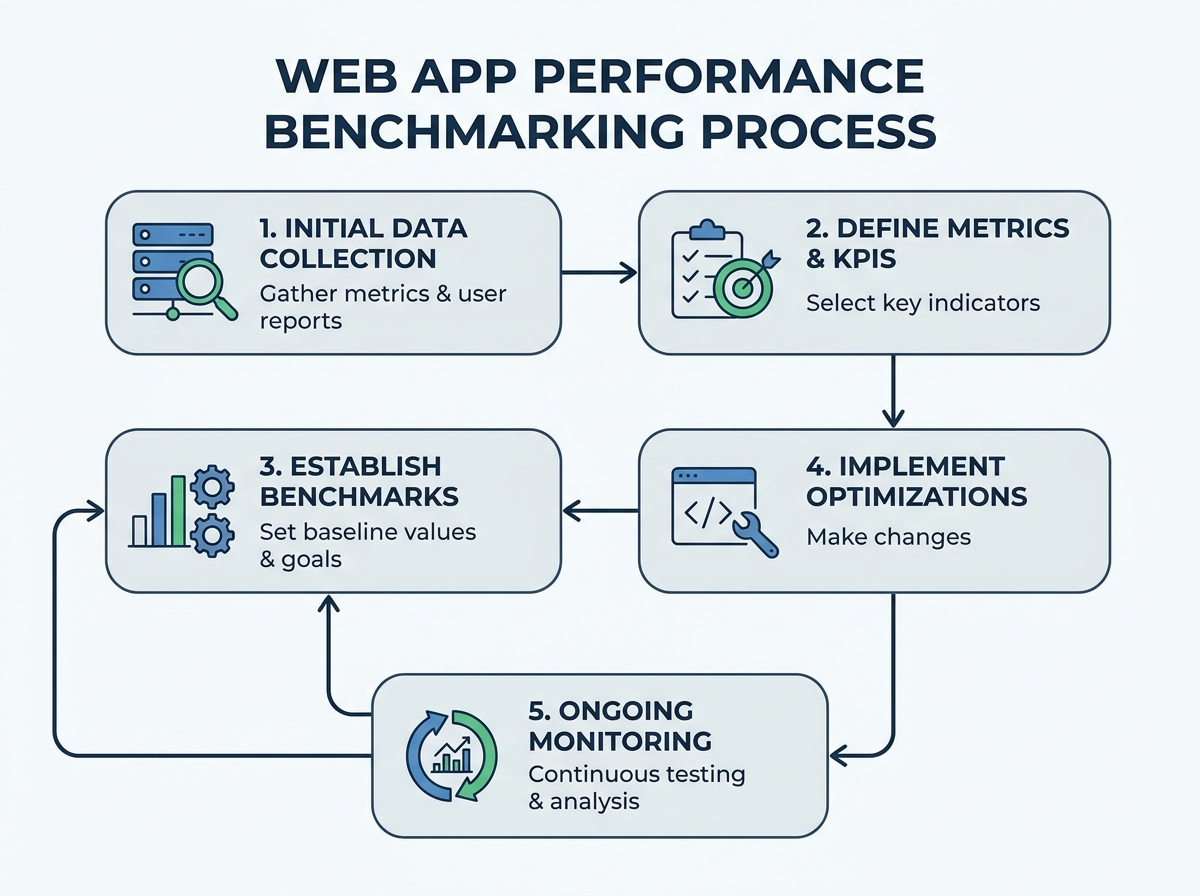
Performance benchmarks for web applications are standardized metrics and tests that measure an application’s speed, responsiveness, and stability in repeatable ways. Unlike ad-hoc metrics, benchmarks provide consistent reference points to track progress, compare technologies, and identify bottlenecks over time.
Think of benchmarks as guardrails for your application’s long-term health. Running a single performance test may catch a glaring issue before launch, but benchmarks establish a baseline you revisit regularly. They show how each release affects core metrics such as Largest Contentful Paint (LCP), Time to First Byte (TTFB), and overall page load time. This ongoing approach is vital for meeting user expectations and business goals – whether that means better SEO, higher conversions, or fewer support tickets related to slow performance.
Benchmarks also clarify technical debates. For instance, Fiber’s 11,987,976 responses per second in plaintext tests outpaces Express’s 1,204,969, providing concrete data for framework decisions.
LoadFocus is an all-in-one Cloud Testing Platform for Websites and APIs for Load Testing, Apache JMeter Load Testing, Page Speed Monitoring and API Monitoring!
| Component | What It Does | Why It Matters |
|---|---|---|
| Largest Contentful Paint (LCP) | Measures time to render the largest visible element | Directly impacts user-perceived load speed and SEO |
| Interaction to Next Paint (INP) | Captures input latency for real user interactions | Reveals responsiveness issues during navigation and form entry |
| Cumulative Layout Shift (CLS) | Tracks unexpected layout movements | Prevents visual disruptions that frustrate users |
| Speedometer | Simulates user actions across frameworks | Highlights real-world responsiveness, especially in apps built with React or Angular |
| WebXPRT 4 | Benchmarks cross-device/browser performance | Ensures consistent experience across platforms |
Types of Performance Benchmarks
Synthetic benchmarks use controlled lab tests – such as Speedometer or JetStream – to measure app performance under predefined conditions. These are ideal for comparing frameworks or testing optimizations before deployment.
Real-user benchmarks collect data from actual users, capturing nuances of network variability and device performance that synthetic tests may miss. Metrics like LCP and INP, gathered via tools such as Google’s Core Web Vitals, provide this perspective.
Custom benchmarks target workflows or endpoints unique to your business. For example, a retailer might monitor checkout latency under different loads, while an API provider tracks throughput and error rates for key endpoints. Combining these approaches gives you a comprehensive view of your application’s strengths and weaknesses, allowing you to focus on metrics that matter most for your users and business.
Key Metrics to Track: The Metrics That Matter Most in 2026
For performance benchmarks for web applications, four metrics continue to dominate in 2026: Largest Contentful Paint (LCP), Interaction to Next Paint (INP), Cumulative Layout Shift (CLS), and Time to First Byte (TTFB). Each measures a distinct aspect of user experience, and together, they form the foundation of effective performance optimization. Understanding these metrics – and knowing how to respond when they fall short – is essential for anyone responsible for a web app’s success.
| Metric | Formula | 2026 Benchmark | Action Trigger |
|---|---|---|---|
| Largest Contentful Paint (LCP) | Time (ms) until largest visible element loads | < 2.0s (mobile), < 1.5s (desktop) | >2.5s: Optimize images, reduce render-blocking resources |
| Interaction to Next Paint (INP) | Longest user interaction latency (ms) | < 200ms | >250ms: Audit JavaScript, limit main thread blocking |
| Cumulative Layout Shift (CLS) | Sum of layout shift scores | < 0.10 | >0.15: Reserve space for images/ads, fix dynamic content jumps |
| Time to First Byte (TTFB) | Time from request to first byte received (ms) | < 400ms | >500ms: Investigate server response, optimize backend |
| Page Load Time | Total time from navigation to complete load (ms) | < 3.0s | >3.5s: Enable CDN, minimize third-party scripts |
Key Insight: The fastest sites in 2026 use LCP, INP, CLS, and TTFB as non-negotiable targets – meeting these benchmarks consistently leads to better SEO and user retention.
Why LCP, INP, CLS, and TTFB Are Industry Standards
These core metrics are grounded in extensive UX research and technical audits. LCP signals when main content is visible. INP (which replaced FID in 2024) tracks responsiveness for all user interactions, exposing bottlenecks beyond the first input. CLS addresses the frustration of shifting elements, which can cause accidental clicks and user drop-off. TTFB provides early warning of server or network delays that can impact subsequent metrics.
For SEO, these metrics are crucial. Search engines use them as ranking signals. For users, a page that loads quickly, responds instantly, and remains visually stable feels faster and more trustworthy.
Choosing the Right Metrics for Your Project
There is no universal formula for performance benchmarks for web applications. A media site may prioritize LCP, while a SaaS dashboard relies on INP and TTFB. E-commerce apps should closely monitor CLS, since layout shifts near purchase buttons can directly affect revenue. Your audience and business goals should determine your priorities. For mobile-heavy audiences, every millisecond of LCP and TTFB is magnified. In contrast, an internal enterprise tool may focus more on transactional speed than on layout stability.
Use real user monitoring to identify which metrics most closely correlate with bounce rates and conversions for your context. High-performing teams build dashboards tailored to their unique mix of traffic sources, device types, and business KPIs. Platforms like LoadFocus enable teams to analyze metrics by geography, device, and network, revealing outliers that averages might hide.
Metric Pitfalls and Limitations
Focusing on a single metric can be counterproductive. For example, optimizing LCP without considering INP may result in a fast-loading page that feels unresponsive during interaction. Relying exclusively on synthetic data from lab tools risks missing issues experienced by users on slow mobile connections or less common devices. Always review the distribution of scores, not just the median, to uncover hidden pain points. And remember, while LCP and INP are strong proxies for user experience, they cannot capture every source of frustration – such as confusing interfaces or misleading loading indicators.
The most effective teams treat metrics as a compass for ongoing investigation, not as a finish line.
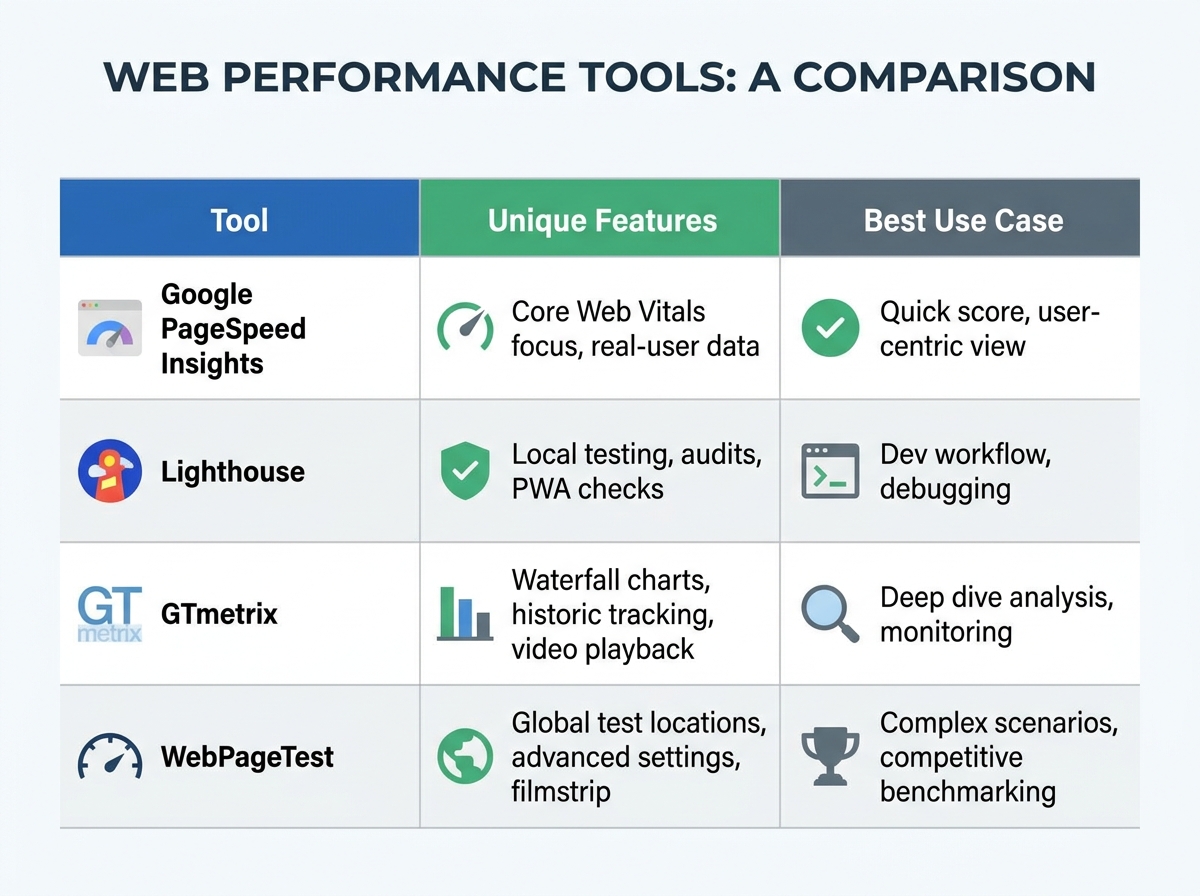
Tools for Setting and Measuring Performance Benchmarks
Selecting the right cloud testing and monitoring tools is essential for meeting the performance benchmarks that users and search engines expect in 2026. The field is crowded, but a few platforms stand out: LoadFocus, JMeter, Speedometer, WebXPRT, and Basemark Web 3.0. Each offers a distinct approach, from simulating user loads to running real-world browser tests. Understanding their strengths helps you move from one-off testing to sustained improvement.
| Tool | Test Type | Best Use Case | Key Features |
|---|---|---|---|
| LoadFocus | Cloud Load & Performance Testing | Continuous monitoring, API & website stress tests | Real-user data collection, JMeter script execution, alerting, CI/CD integration |
| JMeter | Local/Cloud Load Testing | Heavy scripting, custom test scenarios | Open-source, protocol-level testing, extensible plugins, on-premises control |
| Speedometer | Browser Benchmark | Front-end framework responsiveness | Simulates user actions, tests React/Angular/Vue, straightforward scoring |
| WebXPRT 4 | Cross-Platform Benchmark | Device/browser performance comparison | Tests photo enhancement, AI tasks, compatibility across mobile & desktop |
| Basemark Web 3.0 | Web Performance Benchmark | Graphics, computation & DOM manipulation | Measures rendering, JavaScript speed, cross-browser consistency |
Cloud-Based vs. Local Testing Solutions
Most teams benefit from a blend of cloud-based and local testing tools. Platforms like LoadFocus excel at simulating thousands of users from multiple global locations and automating recurring tests in your pipeline. Integrating LoadFocus with your CI/CD system ensures every deployment receives a real-world stress test, with metrics like LCP and TTFB tracked automatically.
Meanwhile, JMeter is ideal for deep, scriptable load tests, especially when protocol-level control or on-premises execution is required. Local browser benchmarks such as Speedometer, WebXPRT, and Basemark Web 3.0 are essential for understanding front-end performance across devices. For example, Fiber’s nearly 12 million responses per second in plaintext tests highlight the importance of framework choice when optimizing for scale.
When to Use Synthetic vs. Real-User Testing
No matter how advanced your test suite, relying only on lab data gives an incomplete picture. Synthetic testing – using tools like Speedometer or scripted JMeter runs – measures specific scenarios under controlled conditions and is ideal for catching regressions before launch.
However, real-user monitoring, as provided by LoadFocus, reveals performance issues that synthetic tests may overlook, such as network variability and device fragmentation. Combining both approaches is best practice: use synthetic testing to set baselines and track improvements, but validate gains with field data from real users. This ensures your performance benchmarks for web applications are both ambitious and grounded in reality.
How to Define Realistic and Actionable Benchmarks
Setting performance benchmarks for web applications is a strategic process tied to your business goals and user expectations. Effective benchmarks must be specific, data-driven, and tailored to your priorities – not copied from generic sources.
Start with Business and UX Priorities
Begin by identifying what matters most for your users and business. Are you aiming to reduce bounce rates on mobile, speed up checkout for logged-in users, or improve SEO for your product catalog? Each objective requires different targets.
Engage stakeholders early. Product leads, designers, engineers, and support teams each see performance from different perspectives. Aligning on clear goals prevents benchmarks that look good on paper but miss real-world needs.
Anchor Benchmarks in Real Data
Use historical performance data from your current site as a baseline. Tools like LoadFocus, Speedometer, and MotionMark highlight strengths and weaknesses. Speedometer, for example, simulates real user flows in popular frameworks, offering practical insights into app performance under typical loads.
Include competitor analysis for context. If a rival’s homepage loads in 1.4 seconds on 4G and yours takes 3.2, you’re likely losing conversions. Cross-platform benchmarks from tools like WebXPRT 4 help you understand your standing across devices and networks.
Set SMART Performance Benchmarks
Replace vague goals like “make the site faster” with specific, measurable, and time-bound targets. For example, “achieve LCP under 1.8 seconds for 90% of users by Q3” is actionable and trackable. Every benchmark should be:
- Specific – Define the exact metric and user segment.
- Measurable – Use tools that provide repeatable, transparent results.
- Achievable – Set goals your current stack can realistically reach.
- Relevant – Tie each benchmark to a business or UX outcome.
- Timely – Attach a deadline or review cycle.
| Before | After |
|---|---|
“Make the site faster.”
| “Reduce Largest Contentful Paint (LCP) to under 1.8 seconds for 90% of users globally by September, measured via LoadFocus real-user monitoring.”
|
Clear, data-driven benchmarks create accountability and drive measurable gains in both user satisfaction and business outcomes.
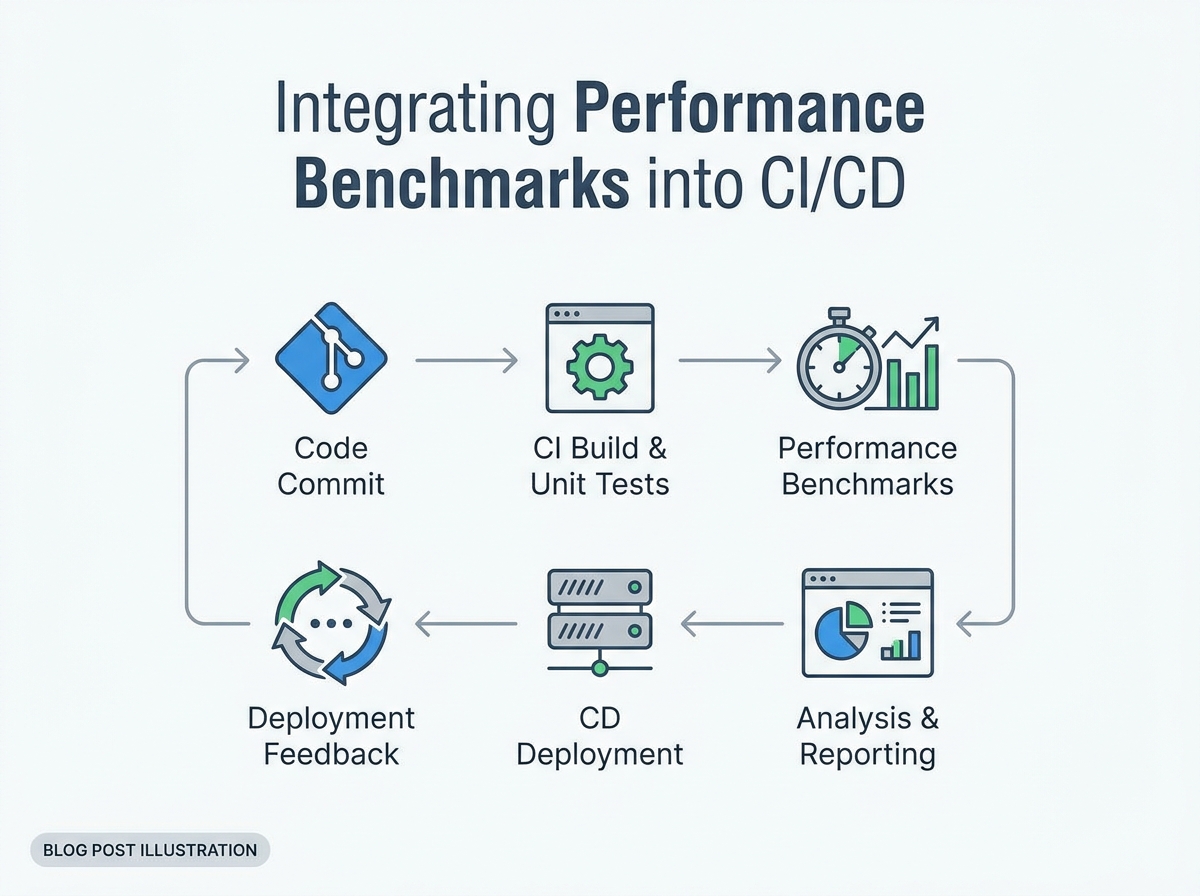
Implementing Performance Benchmarks in Your Development Workflow
Performance benchmarks for web applications should be integrated into every stage of development, QA, and deployment. Each step, from the first line of code to production release, presents an opportunity to catch regressions before they affect users.
Key Insight: Embedding automated performance benchmarks into your CI/CD pipeline turns regressions into routine, fixable feedback – rather than post-release surprises.
Automating Performance Checks with Cloud Testing Tools
Manual browser testing does not scale. Cloud-based load testing platforms execute repeatable, standardized tests across devices and network conditions, providing objective data on metrics like LCP, INP, and TTFB with every commit.
- Run scheduled performance tests nightly to monitor trends.
- Trigger targeted load tests on every pull request or deployment branch.
- Generate real-time dashboards that immediately flag regressions.
Cloud platforms also simulate user behavior at scale, validating not just speed but stability and scalability under real-world conditions. Cross-platform benchmarking tools help you spot device- or browser-specific issues before users encounter them.
Integrating Benchmarks into Pull Requests and Deployment Gates
The most effective teams treat performance benchmarks for web applications as deployment blockers. If a pull request increases average page load time or worsens CLS, it does not get merged. This is achieved by integrating automated tests into your CI/CD workflows.
- Run performance scripts automatically for every code change.
- Compare results against baseline metrics.
- Fail the build if a threshold is exceeded, requiring remediation before release.
This approach prevents “performance drift” – the gradual degradation that can occur with each release. It also fosters a culture where speed and stability are primary concerns.
Continuous Feedback Loops for Ongoing Improvement
Embedding benchmarks in the workflow is about more than catching problems. It enables continuous improvement. Real-time alerts, historical dashboards, and trend analysis help teams spot recurring issues and prioritize long-term fixes. Over time, your web application becomes not just fast, but consistently fast – even as complexity grows.
One limitation: synthetic tests may miss edge cases from real users. Supplement automated checks with real-user monitoring for a complete view of performance in the wild.
Example: Automated Load Testing with LoadFocus
To set up automated load testing, connect your code repository to LoadFocus’s cloud platform. Define test scenarios, such as simulating 2,000 users logging in and browsing high-traffic pages. LoadFocus supports importing JMeter scripts or building tests via its UI.
Integrate these tests into your CI/CD pipeline – using tools like GitHub Actions or GitLab CI – so every pull request triggers a load test. Results are posted back to the pull request, flagging regressions in LCP or TTFB beyond your benchmarks.
When a test fails, LoadFocus provides detailed logs and performance charts, enabling engineers to quickly identify bottlenecks. Making these checks a routine part of your workflow ensures that performance remains a continuous priority as your application evolves.
Advanced Strategies: Mobile-First, AI-Driven, and Cross-Platform Benchmarking
Mobile Performance: Beyond Desktop Benchmarks
Mobile-first benchmarking is essential for any serious web application. Most users access sites from phones or tablets, facing variable network speeds and higher expectations for instant access. A page that loads quickly on fiber but drags on 4G will lose users.
Modern benchmarks must reflect these realities. Tools like Speedometer and WebXPRT 4 simulate real-world mobile interactions, including slower CPUs and unreliable connections. Leading teams test under throttled network conditions, not just in local labs. To retain users, optimize images, reduce JavaScript, and keep LCP well below two seconds on mobile.
Key Insight: Mobile-first performance benchmarks now define the baseline for real user experience – desktops are the exception, not the rule.
AI-Powered Monitoring: Smarter Insights, Fewer Blind Spots
Manual spot checks cannot keep pace with modern web applications. AI-driven monitoring tools automate anomaly detection and root cause analysis, providing actionable alerts when user experience is at risk.
These systems continuously track key metrics like INP and CLS, flagging issues before they escalate. Some platforms even recommend specific fixes based on real-user data and historical patterns. While automation boosts efficiency, certain issues – like sudden CDN outages or rare device-specific bugs – still require human oversight.
Cross-Platform Consistency: Benchmarking Across Devices
Users switch between devices and browsers, from mobile to desktop and from Chrome to Safari. Cross-platform performance benchmarking is essential for consistent experiences and brand trust.
Frameworks like Basemark Web 3.0 and WebXPRT 4 allow teams to compare performance across devices and browsers. For example, a React app may meet LCP targets on Chrome desktop but struggle on Safari mobile. Running standardized tests everywhere helps you identify and address these gaps early. If your monitoring platform supports multi-device analysis, you gain a comprehensive view of performance benchmarks for web applications across your stack.
However, synthetic benchmarks have limits. They cannot fully replicate real-world usage or network variability. Complement lab tests with real-user monitoring for a complete perspective.
The most successful teams in 2026 treat mobile-first, AI-powered, and cross-platform benchmarking as ongoing disciplines. Performance is a continuous cycle of measuring, optimizing, and retesting as user habits and technologies evolve.
Case Study: Benchmarking Web Frameworks – Fiber vs. Express
Performance benchmarks can reveal dramatic differences between frameworks. In plaintext response tests, Fiber delivered 11,987,976 responses per second, while Express reached 1,204,969. This nearly tenfold gap is significant, but what does it mean for real projects?
| Framework | Test Type | Responses/sec | Best Use Case |
|---|---|---|---|
| Fiber (Go) | Plaintext | 11,987,976 | High-scale APIs, latency-sensitive microservices |
| Express (Node.js) | Plaintext | 1,204,969 | Rapid prototyping, small-to-medium web apps |
If you’re building high-throughput APIs or need massive concurrency, Fiber’s efficiency offers a clear advantage. For example, a real-time analytics pipeline handling millions of events per second would benefit from Fiber’s scalability.
However, Express remains popular due to its deep ecosystem and ease of onboarding, making it ideal for projects where rapid iteration and developer familiarity matter more than raw speed. If your app serves a moderate number of users, Express may be more than sufficient.
It’s important to note that benchmarks like these are often “hello world” scenarios – minimal logic, no database calls, and no authentication. Real applications involve complex middleware and dynamic content, which can reduce the performance gap. Use benchmarks as guidance, but always test in your own environment.
How to Benchmark Your Own Stack
To benchmark your stack effectively:
- Define your test cases: Focus on scenarios that reflect real user behavior, such as static file serving or full end-to-end flows.
- Choose the right tool: Platforms like LoadFocus simulate thousands of users and measure core metrics like TTFB and LCP.
- Automate your tests: Integrate performance tests into your CI/CD pipeline to catch regressions early.
- Analyze, don’t just collect: Look for consistent bottlenecks and investigate persistent issues.
- Repeat and refine: Revisit benchmarks regularly, especially after major updates or infrastructure changes.
Numbers provide direction, but context matters. Treat performance benchmarking as an ongoing process to build web applications that remain fast and responsive as they grow.
What to Avoid: Common Mistakes in Setting and Using Performance Benchmarks
Performance benchmarks are only as effective as the habits behind them. Teams often fall into predictable traps that undermine their efforts. Here are the most persistent mistakes – and how to avoid them:
- “Set and Forget” Mentality: Treating benchmarks as a one-time task leads to obsolescence. Web technologies and user expectations evolve rapidly. For example, Fiber’s leap in plaintext responses per second signals when it’s time to revisit your targets.
- Ignoring Real-User Monitoring and Mobile Users: Lab tests are useful, but they cannot capture the experience of real users on diverse devices and networks. With most traffic now on mobile, skipping mobile-first testing means optimizing for a shrinking minority.
- Chasing Vanity Metrics: Impressive numbers from tools like Speedometer or MotionMark are tempting, but if you ignore metrics like LCP, INP, or CLS – the ones that affect user conversion and SEO – you risk prioritizing the wrong goals.
| Before | After |
|---|---|
A team sets up Speedometer and TTFB tests once, using only desktop browsers on office Wi-Fi. Benchmarks are reviewed annually, and results are rarely shared outside the dev team. No mobile testing, no real-user data. | The team adopts a continuous benchmarking cycle using LoadFocus for cloud-based testing. They include mobile devices, simulate slow networks, and monitor LCP and INP in real time. Benchmarks are reviewed each sprint, with results driving optimization priorities. |
The improved approach closes the loop between testing and real-world impact, ensuring every update is measured against actual user experience across devices and networks.
Maintaining and Evolving Your Performance Benchmarks
Establish a Regular Review Cycle
Performance benchmarks for web applications are not static targets. Technology, frameworks, and user expectations change quickly. The best teams schedule formal reviews – quarterly or even monthly – to examine their metrics against real-world results and industry standards. Use tools like LoadFocus or metrics such as LCP, INP, or CLS to compare your performance with the latest benchmarks.
Incorporate Analytics & User Research
Numbers alone do not tell the full story. Pair performance analytics with user research and real-user monitoring. If your LCP is under 2.5 seconds but users still report slow load times on mobile, dig deeper with field data. Use heatmaps, feedback forms, and session recordings to identify friction points. Be open to findings that challenge assumptions, such as shifts in traffic patterns or network speeds.
When and How to Raise the Bar
Benchmarks lose value if they lag behind the market. When new frameworks like Fiber demonstrate significant performance gains, it may be time to update your targets. Raise the bar when you consistently exceed goals or when user behavior changes. Make incremental adjustments, documenting each change and its rationale, so the team understands why targets evolve.
Keeping performance benchmarks for web applications relevant requires structured reviews, actionable user feedback, and a willingness to adapt standards. This ensures your applications remain fast and user-friendly as the landscape shifts.
Frequently Asked Questions
What are performance benchmarks for web applications?
Performance benchmarks for web applications are standardized tests and metrics that measure how quickly and reliably a web app loads, responds, and functions. They cover aspects like Largest Contentful Paint (LCP), Interaction to Next Paint (INP), Cumulative Layout Shift (CLS), and Time to First Byte (TTFB). Tracking these helps teams identify optimization opportunities and compare against industry standards.
Which tools should I use to measure web app performance?
Effective teams use a mix of browser-based and cloud testing platforms. Tools like Speedometer, JetStream, and MotionMark assess responsiveness and graphics performance. For comprehensive monitoring, platforms such as LoadFocus provide cloud-based load testing and real-time analytics, making it easier to spot regressions and bottlenecks during development and after deployment.
How often should benchmarks be reviewed or updated?
Benchmarks should be reviewed regularly – monthly or quarterly – to ensure they reflect current user needs and technical realities. This cadence also accounts for changes in devices, browsers, and network speeds.
What’s the difference between lab benchmarks and real-user monitoring?
Lab benchmarks use controlled environments to measure metrics like LCP or TTFB with repeatable tests. Real-user monitoring (RUM) collects anonymized data from actual visitors, capturing variability caused by location, hardware, or connectivity. Both are valuable: lab data highlights technical potential, while RUM reveals genuine user experiences and edge cases.
How do performance benchmarks impact SEO and user experience?
Search engines use page speed and core web vitals as ranking signals. Sites that consistently meet recommended benchmarks are more likely to achieve better crawlability and higher keyword rankings. For users, faster loads and smoother interactions reduce bounce rates and boost engagement, especially on mobile.
What are the most common mistakes when setting or using benchmarks?
- Testing only in lab conditions and ignoring real-user data
- Focusing exclusively on desktop performance while neglecting mobile
- Failing to update benchmarks as technology shifts
- Optimizing for the wrong metrics or targeting unrealistic goals
The best results come from using objective metrics, validating with real-user data, and revising targets as both technology and user needs evolve.