Key takeaways
- An SPA does its work after the initial HTML, so a test that only requests the page URL measures almost nothing of what users experience.
- Load test the API calls the app makes, weighted the way real users make them, and test the static assets and CDN separately.
- Add a small browser-level test for render timing (LCP, INP, CLS), since protocol-level tools do not execute JavaScript.
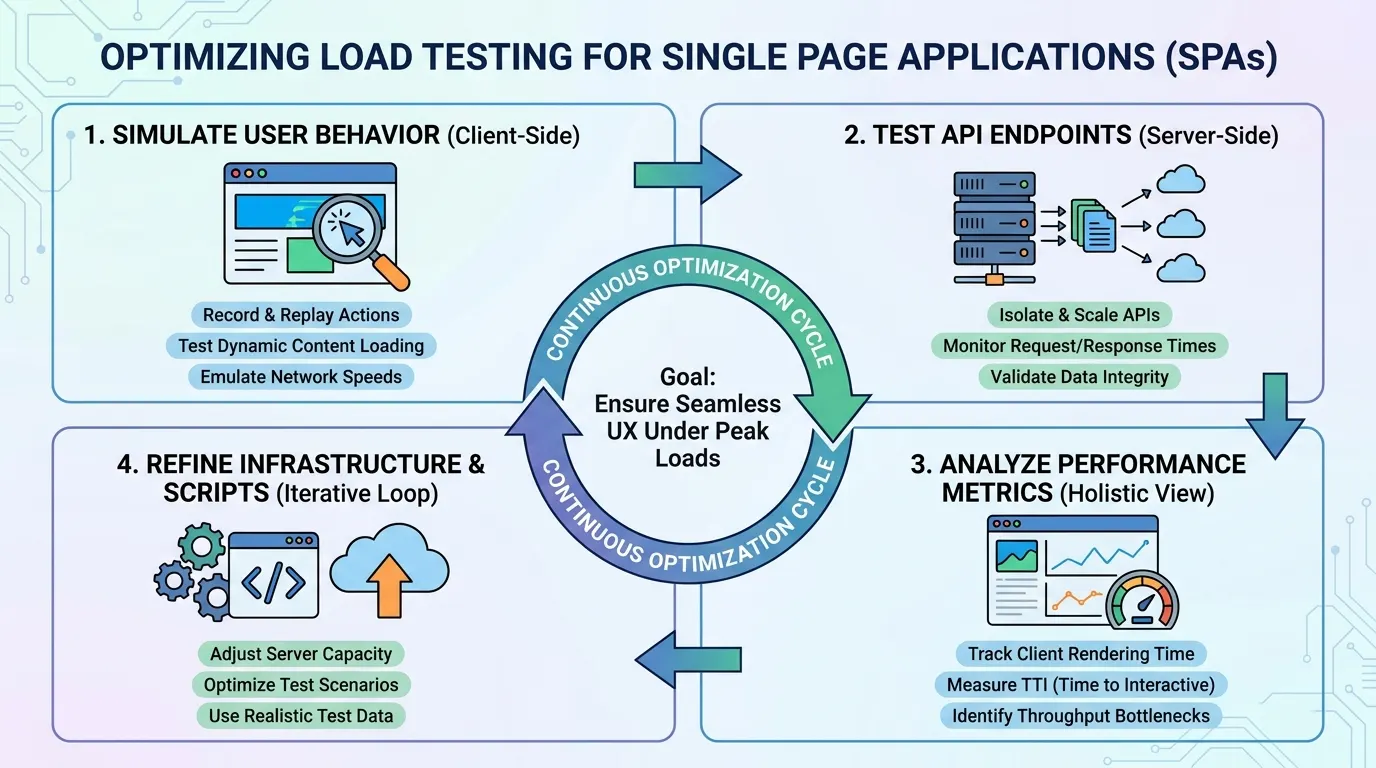
Load testing a single page application (SPA) means testing the API and asset traffic the app generates after the first page load, with realistic user journeys, and checking in a real browser how fast the interface becomes usable. A test that fetches the home page URL 500 times a second only exercises a web server returning a small HTML shell.
Why do standard load tests miss SPA bottlenecks?
A server-rendered page arrives as finished HTML, so one request roughly equals one page view. An SPA delivers an HTML shell and a JavaScript bundle, then the browser runs the app, which calls APIs (REST, GraphQL, sometimes WebSockets) and renders the result. Navigating to another “page” usually triggers new API calls but no new HTML request.
That has three consequences for testing:
- The load lands on your API, not on the HTML route. A script hitting
/and/loginleaves the endpoints that matter untouched. - Protocol-level tools such as JMeter, k6 and Locust send HTTP requests and do not run the app’s JavaScript. They never see rendering, hydration or main-thread delays.
- Backend dashboards can look healthy while the interface is slow, because the delay is in the browser (a large bundle, a long task, a waterfall of dependent calls).
What should you load test in an SPA?
Test each layer with the tool that can actually see it.
| Layer | What to test | Tool type | What you read |
|---|---|---|---|
| API and backend | The XHR/fetch calls a real session makes, with real payloads and auth | Protocol-level (JMeter, k6, Locust) | p95 response time per endpoint, error rate, throughput |
| Static assets and CDN | JS, CSS, images, fonts, cache headers | Protocol-level, from several regions | Transfer time, cache hit ratio, error rate |
| Real-time connections | WebSockets or server-sent events, if the app uses them | k6 (k6/websockets), JMeter with a WebSocket plugin | Connection success, message latency, dropped connections |
| Browser rendering | A few key journeys in a real browser under backend load | Browser-level (k6 browser module, Lighthouse) | LCP, INP, CLS, TTFB |
How do you build a realistic SPA load test scenario?
Start from what the browser really does. Open DevTools, go to the Network tab, filter to Fetch/XHR, and walk through a journey: sign in, open the dashboard, filter a report, open a record. Export a HAR file if you want a record of it. Then turn the journey into a script:
- Replay the calls in order, in parallel where the app does. A dashboard that fires five requests at once should do the same in the test, not call them one after another.
- Handle auth like the app. Log in once per virtual user, store the token, send it on each call and refresh it when the app would. Tokens that expire mid-test are a common cause of false 401 errors.
- Add think time. Real users pause between actions; without pauses you test a robot, not your users.
- Weight the journeys. Use your analytics: if 70% of sessions only browse and 5% check out, the mix should show it. The guide to designing load testing scenarios covers the method, and realistic e-commerce scenarios shows a worked mix.
- Use varied data. One user ID or one search term for every virtual user is served from cache and flatters the result.
Here is a protocol-level k6 journey for a dashboard that loads three API calls in parallel. The URLs are placeholders, and the script has not been run against a real app:
import http from 'k6/http';
import { check, sleep } from 'k6';

export const options = {
  stages: [
    { duration: '2m', target: 50 },
    { duration: '5m', target: 50 },
    { duration: '1m', target: 0 },
  ],
  thresholds: {
    http_req_duration: ['p(95)<800'],
    http_req_failed: ['rate<0.01'],
  },
};

export default function () {
  const login = http.post('https://staging.example.com/api/login',
    JSON.stringify({ user: `user${__VU}`, password: 'test-password' }),
    { headers: { 'Content-Type': 'application/json' } });
  check(login, { 'logged in': (r) => r.status === 200 });
  const auth = { headers: { Authorization: `Bearer ${login.json('token')}` } };

  const responses = http.batch([
    ['GET', 'https://staging.example.com/api/profile', null, auth],
    ['GET', 'https://staging.example.com/api/reports?limit=20', null, auth],
    ['GET', 'https://staging.example.com/api/notifications', null, auth],
  ]);
  check(responses[1], { 'reports ok': (r) => r.status === 200 });
  sleep(Math.random() * 4 + 2);   // think time of 2 to 6 seconds
}
How do you measure what the browser experiences?
A protocol-level test cannot tell you when the interface becomes usable. For that, run a few real-browser journeys while the load test pushes the backend. k6 has a browser module (k6/browser) that drives Chromium and reports Web Vitals as metrics: browser_web_vital_lcp, browser_web_vital_inp, browser_web_vital_cls, browser_web_vital_fcp and browser_web_vital_ttfb. A starter script comes from k6 new --template browser browser-script.js. Keep browser iterations to a handful, because each one runs a full browser and is far heavier than an API-only virtual user.
Judge the results against Google’s Core Web Vitals thresholds, measured at the 75th percentile: LCP at or under 2.5 seconds, INP at or under 200 milliseconds, CLS at or under 0.1 (web.dev, October 2026). INP replaced FID as a Core Web Vital in March 2024. For the monitoring side of the same metrics, see how to monitor Core Web Vitals with alerts.
Which metrics matter for an SPA load test?
- Per-endpoint p95 and p99 response time, not one blended average (why percentiles beat averages). A slow reports endpoint hides inside a fast overall number.
- Error rate by status code: 401 (token handling in the script), 429 (rate limiting hitting your single load generator), 5xx (the app).
- Throughput in requests per second, to compare against what the journey mix should generate.
- Backend resources (CPU, memory, database connections, queue depth) in the same time window, to find the cause of a slow endpoint.
- Web Vitals from the browser journeys, run at different load levels, to see whether rendering degrades when the backend slows.
When endpoints look fine but users complain, check the front end: bundle size, long tasks, dependent request waterfalls and third-party scripts. Backend load tests cannot find those.
What are common SPA load testing mistakes?
- Testing only the HTML URL or login route.
- Pointing the test at the origin when production traffic goes through a CDN, or the opposite. Decide which you are measuring and say so in the report.
- One IP for all load, which trips rate limits that real users spread across many IPs would not. Run from several regions where it matters.
- Ignoring GraphQL specifics: a single
/graphqlURL hides many different queries, so label requests by operation name. - Skipping WebSockets or server-sent events when the app depends on them.
- Running against a tiny test database. Query plans and cache behaviour change with data volume.
How do you add SPA load tests to CI/CD?
Run a short, strict test on every merge to a staging environment (for example 5 minutes, thresholds on p95 and error rate) and a longer test on a schedule. Make thresholds fail the pipeline, so a regression blocks the deploy instead of appearing in a report nobody reads. The types of performance testing page explains when to use load, stress, spike and soak runs.
How does LoadFocus help with SPA load testing?
LoadFocus runs k6 and JMeter scripts from 25 AWS regions with load split by percentage, so a journey script like the one above can run from where your users are. Paid plans go up to 20,000 concurrent virtual users per test. A GitHub Action, a Jenkins plugin and an API support pass/fail gates in CI, and each run can produce an AI analysis of bottlenecks (loadfocus.com/load-testing, October 2026). The load test page also says Core Web Vitals (LCP, CLS, FCP, TTFB) are sampled on your page while virtual users ramp up. For continuous Web Vitals tracking after release, see page speed monitoring.
Frequently Asked Questions
What makes load testing a single page application different?
The load is on the API and asset layer rather than on page requests, and much of the user-visible delay happens in the browser. You test the API calls the app makes and add browser-level measurements for rendering.
Which tools can load test an SPA?
k6, JMeter and Locust all generate API load at the protocol level. For browser rendering, k6’s browser module drives Chromium and reports Web Vitals. Pick the one your team can script and maintain.
Do load testing tools execute the SPA’s JavaScript?
Protocol-level tools do not. They send the HTTP requests you script. Only a browser-based test runs the app’s code, which is why the two are combined.
How many virtual users should I test with?
Work from your analytics: the peak number of concurrent sessions, then add headroom for growth and campaigns. Check the result with Little’s Law (concurrent users = session arrival rate x average session duration).
Is load testing enough to guarantee SPA performance?
No. Load testing finds backend limits. Front-end profiling, bundle analysis and real user monitoring find the problems that only appear in the browser.
Sources
- Grafana k6 documentation, browser module and metrics: grafana.com/docs/k6/latest/using-k6-browser (October 2026).
- Grafana k6 documentation,
k6/websockets: grafana.com/docs/k6/latest/javascript-api/k6-websockets (October 2026). - web.dev, Core Web Vitals thresholds: web.dev/articles/vitals (October 2026).
- LoadFocus product pages: loadfocus.com/k6-load-testing and loadfocus.com/load-testing (October 2026).