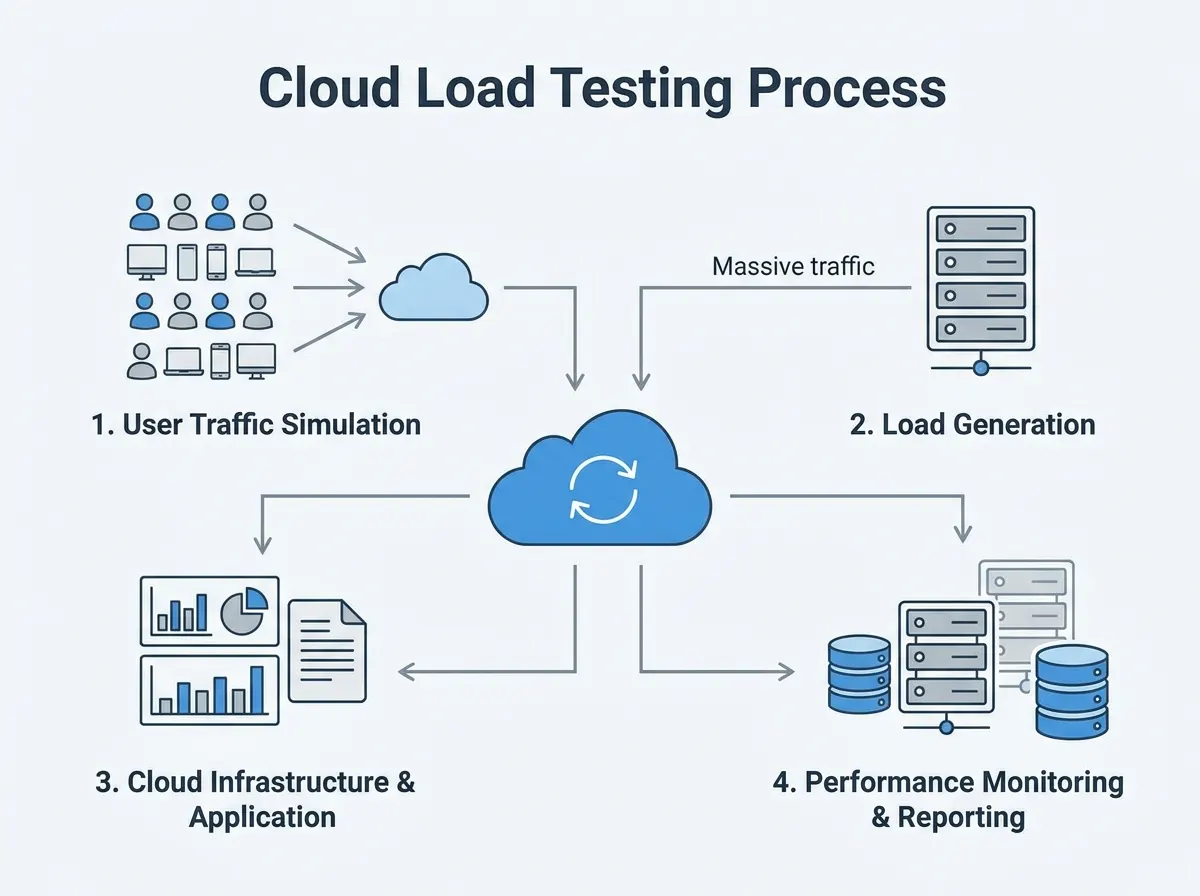
A cloud load test cannot time how long your app takes to draw its first screen, because it replays HTTP requests and never runs the app. What it can measure is the part of mobile app load times you do not control from the device: how fast your API, CDN and backend answer the requests the app fires at launch, from the regions your users are in, while many people launch at once. Pair that with device-side timings and you know whether a slow start is the phone or the server.
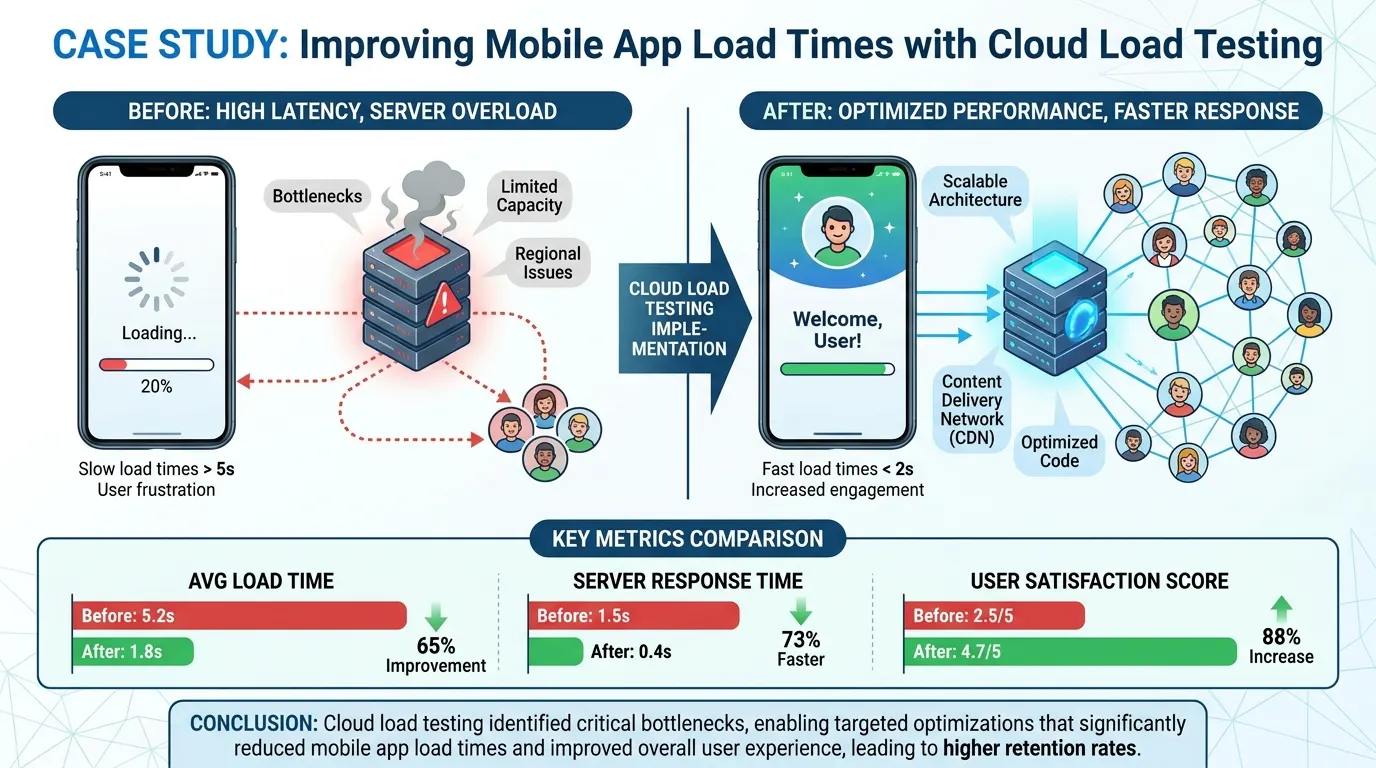
This post was first published as a case study of an unnamed app, with before and after figures that could not be verified, so it has been rewritten as a how-to. Every number below comes from a cited source or is labelled as an example.
Key takeaways
- Load testing measures what the backend does at launch under load. Device timings measure the rest.
- Record the requests your app makes at launch, replay them in order, and test from the regions your users are in.
- Read the 95th percentile and the error rate, not the average.
- Launch calls that wait on each other add up, so one slow endpoint can cost more than the sum suggests.
- Put a threshold in CI so a slow release fails before users see it.
What do mobile app load times actually include?
App load time has two parts, and a load test only sees one of them.
- On the device: starting the process, creating the first screen and drawing it. Android calls the first frame time to initial display (TTID) and the moment the app is usable time to full display (TTFD), which your code reports with
reportFullyDrawn()(developer.android.com/topic/performance/vitals/launch-time, read 23 October 2026). Play Console and Android Studio profile these; iOS has equivalent tools in Xcode. - On the network and backend: the config call, the login or token refresh, the first feed or catalog request and the images behind them. These are ordinary HTTP requests, and this is what cloud load testing exercises.
When users say the app is slow to start, the cause is usually one of the two, and you find out which by looking at both numbers for the same launch.
How do you measure mobile app load times with cloud load testing?
Follow these six steps. The first one is the one teams skip.
1. Record what the app really does at launch
Route a test phone or emulator through a proxy such as mitmproxy, launch the app cold, and save the list of requests. Note their order, which ones wait for an earlier response (a token before a feed), the headers and the typical payloads. Launch on a fresh install and on a logged-in install, because they differ.
2. Turn the recorded flow into a script
Write the sequence as a k6 or JMeter script. Keep the order and the dependencies; tag each request so the report shows them separately.
import http from 'k6/http';
import { check } from 'k6';

export const options = {
  stages: [
    { duration: '2m', target: 200 },
    { duration: '5m', target: 200 },
    { duration: '1m', target: 0 },
  ],
  thresholds: {
    http_req_failed: ['rate<0.01'],
    'http_req_duration{name:config}': ['p(95)<500'],
    'http_req_duration{name:home_feed}': ['p(95)<800'],
  },
};

export default function () {
  const base = 'https://api.example.com';
  const headers = { Authorization: `Bearer ${__ENV.TOKEN}` };

  const cfg = http.get(`${base}/v1/config`, { headers, tags: { name: 'config' } });
  check(cfg, { 'config 200': (r) => r.status === 200 });

  const feed = http.get(`${base}/v1/home-feed`, { headers, tags: { name: 'home_feed' } });
  check(feed, { 'feed 200': (r) => r.status === 200 });
}
The thresholds above are placeholders. Set yours from the number your launch budget leaves for each call (see step 5).
3. Run it from the regions your users are in
Distance adds a floor to every request (see how network latency affects load testing accuracy). If most users are in Europe and Southeast Asia, test from there, not only from the region next to your servers. LoadFocus runs JMeter and k6 scripts from 25 cloud regions (loadfocus.com/load-testing, 23 October 2026), so one script can be run from several of them and compared.
4. Ramp the load like a launch day
A flat load hides what a spike does. Ramp up to the number of simultaneous launches you expect at peak, hold it, and watch the percentiles over time. Shape the ramp from your own analytics: how many sessions start per minute after a push notification or a release.
5. Read the right numbers
Look at the 95th and 99th percentile of each launch call and the error rate, because an average hides the users who wait longest (why percentiles beat averages). Then add up the calls that wait on each other.
An illustrative example: a launch makes four calls in sequence. At light load each takes 200 ms, so the backend part of the launch is 4 x 200 = 800 ms. At peak the 95th percentile of each call rises to 600 ms, so the same chain takes up to 4 x 600 = 2,400 ms. Each call only tripled, but the chain moved from under a second to well past two. These figures are made up to show the arithmetic, not measurements of any app. Calls that can run in parallel add less, which is a good reason to fire independent requests together.
6. Combine it with device timings and fail builds on it
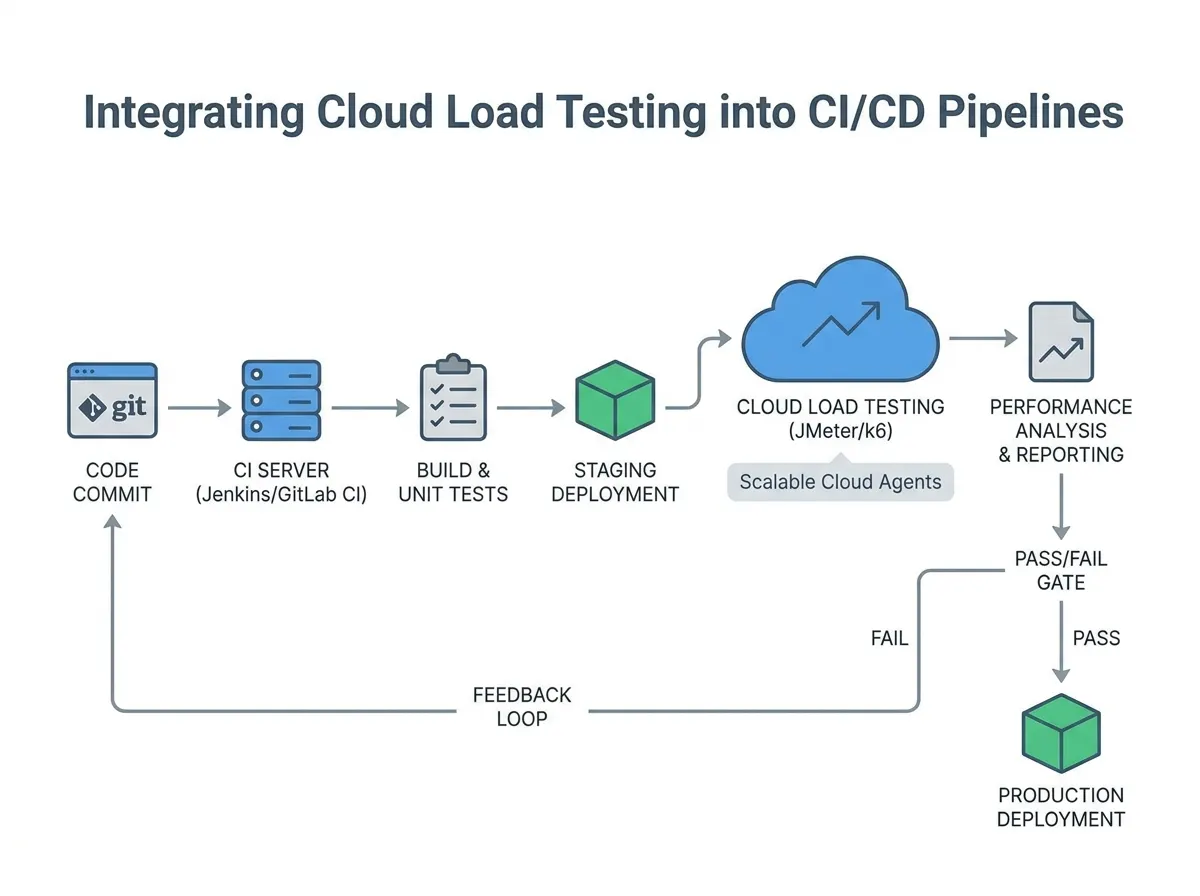
Compare the load test with TTID and TTFD from the same build. If the device timings are fine but the 95th percentile of your feed call is slow under load, fix the backend. If the backend is fast but TTFD is high, the problem is on the phone: bundle size, work on the main thread, image decoding. Then wire the thresholds into your pipeline so a regression fails the build; LoadFocus offers a GitHub Action, a Verdict API and a Jenkins plugin for that (loadfocus.com/load-testing, 23 October 2026).
What usually makes mobile app launches slow?
Typical causes are all measurable with the steps above:
- Too many sequential calls at launch, each waiting for the previous one.
- Large first responses, such as a feed that returns far more than the first screen shows.
- Images served from one region. A CDN keeps them close to users; test from a far region with and without it to see the difference.
- Slow database queries that only appear under concurrency. A load test shows them as a rise in the 95th percentile as users increase.
- Third-party calls (analytics, ads, feature flags) on the launch path.
Slower networks matter on the device side. Throttle the connection on an emulator or a test phone when you take device timings; a load test does not simulate a phone’s radio.
What should you do after the first test?
Fix the biggest single contributor first, then rerun the same script so the comparison is fair. Keep one baseline run per release and compare against it. When the launch path changes, rerecord step 1; scripts for an old flow test the wrong thing. For the wider picture on mobile-first systems, see performance testing for mobile-first businesses and cloud vs local mobile performance testing.
Frequently Asked Questions
Can load testing measure app launch time?
Not on the device. A load test replays the HTTP requests the app makes and times the responses. Measure the on-device launch with Android vitals, Android Studio or Xcode, and use load testing for the backend share.
How fast should a mobile app launch?
There is no single number that applies to every app. Set your own budget from your analytics, then split it between device work and backend calls so each call has a target. Use Android vitals in Play Console to see how your app compares with the thresholds Google applies.
Which regions should I test from?
The ones where most of your users are, plus the farthest one you serve. Compare the same script from each and look at the gap in the 95th percentile.
How many users should I simulate?
Use the number of simultaneous launches at your busiest minute, taken from your analytics, and a ramp to roughly double that to find where the backend bends.
Do I need real devices for load testing?
No. The load generators send the same requests the app sends, so no phones are needed. You still want real devices for the on-device timings.
Sources
- Android Developers, App startup time (TTID, TTFD,
reportFullyDrawn()), developer.android.com/topic/performance/vitals/launch-time (read 23 October 2026) - Grafana k6 documentation, thresholds and scenarios, grafana.com/docs/k6 (script syntax)
- LoadFocus load testing page, loadfocus.com/load-testing (read 23 October 2026)