Key takeaways
- To monitor an MCP server, send it a real JSON-RPC request on a schedule with the same credentials and headers a client uses, then assert on the HTTP status, the shape of the JSON-RPC answer and the response time.
- A plain uptime ping misses the failures that matter: expired tokens (
401), a protocol version the server no longer accepts (400), an empty tool list, and a tool call that returns an error inside a200. - The right request depends on the protocol revision your server speaks. Check which one before you build the monitor.
MCP servers are production endpoints once Claude, an agent or a connector calls your tools through them. This guide shows how to monitor a server that uses the Streamable HTTP transport, what to assert on, and what to alert on. A server that only runs over stdio is launched as a subprocess by the client, so an external HTTP monitor cannot reach it.
What does an MCP server speak, and what does that mean for a monitor?
MCP messages are JSON-RPC 2.0. The specification defines two standard transports: stdio, where the client launches the server as a subprocess, and Streamable HTTP, where each message is an HTTP POST to a single MCP endpoint and the reply arrives as a JSON object or an SSE stream (modelcontextprotocol.io, October 2026). A server offers tools, and can also offer resources and prompts.
The latest revision on modelcontextprotocol.io (read 2026-10-23) is 2026-07-28. It changed Streamable HTTP: every request now carries its protocol version and client details, there is no initialize handshake and no protocol-level session. Earlier revisions (through 2025-11-25) used an initialize call and an optional session header. Many servers in production still speak the earlier shape, so a monitor has to match the server.
| Revision 2026-07-28 | Revisions through 2025-11-25 | |
|---|---|---|
| First call | None required; send any request | initialize, then a notification |
| Version | MCP-Protocol-Version header and _meta in the body on every request | MCP-Protocol-Version header after initialization |
| Session | None | Optional MCP-Session-Id header; a server that requires it answers 400 without it and 404 once it ended the session |
| Extra headers | Mcp-Method on every request, Mcp-Name for tools/call | None |
Source for both columns: the Streamable HTTP pages of the 2026-07-28 and 2025-11-25 specifications (October 2026). A server that supports only the newer revision answers 400 with a JSON-RPC error when the version is unsupported or the headers do not match the body. For a monitor, that means a bare tools/list with no headers can pass on one server and fail on another, and can start failing after the server is upgraded.
Why is a normal uptime check not enough?
An HTTP check that expects 200 on the host passes while these are broken, all of which the specification defines:
- Auth. Invalid or expired tokens must receive
401; a token without enough scope gets403(modelcontextprotocol.io, authorization, October 2026). The port is open, nothing works. - Version or header mismatch. After a server upgrade, requests from a client that sends an older version, or headers that do not match the body, get
400. - Session loss. On the older revisions, a server that dropped a session answers
404to requests carrying its id. - Errors inside a 200. A JSON-RPC protocol error (such as an unknown tool) and a tool execution error (
isError: truein the result) both arrive as ordinary responses. - Latency. Cold starts or a slow dependency make a call outlast what an agent will wait, with no error at all.
- Buffering. For SSE replies the specification asks servers to send
X-Accel-Buffering: noso a reverse proxy does not hold events back.
What should a health check call?
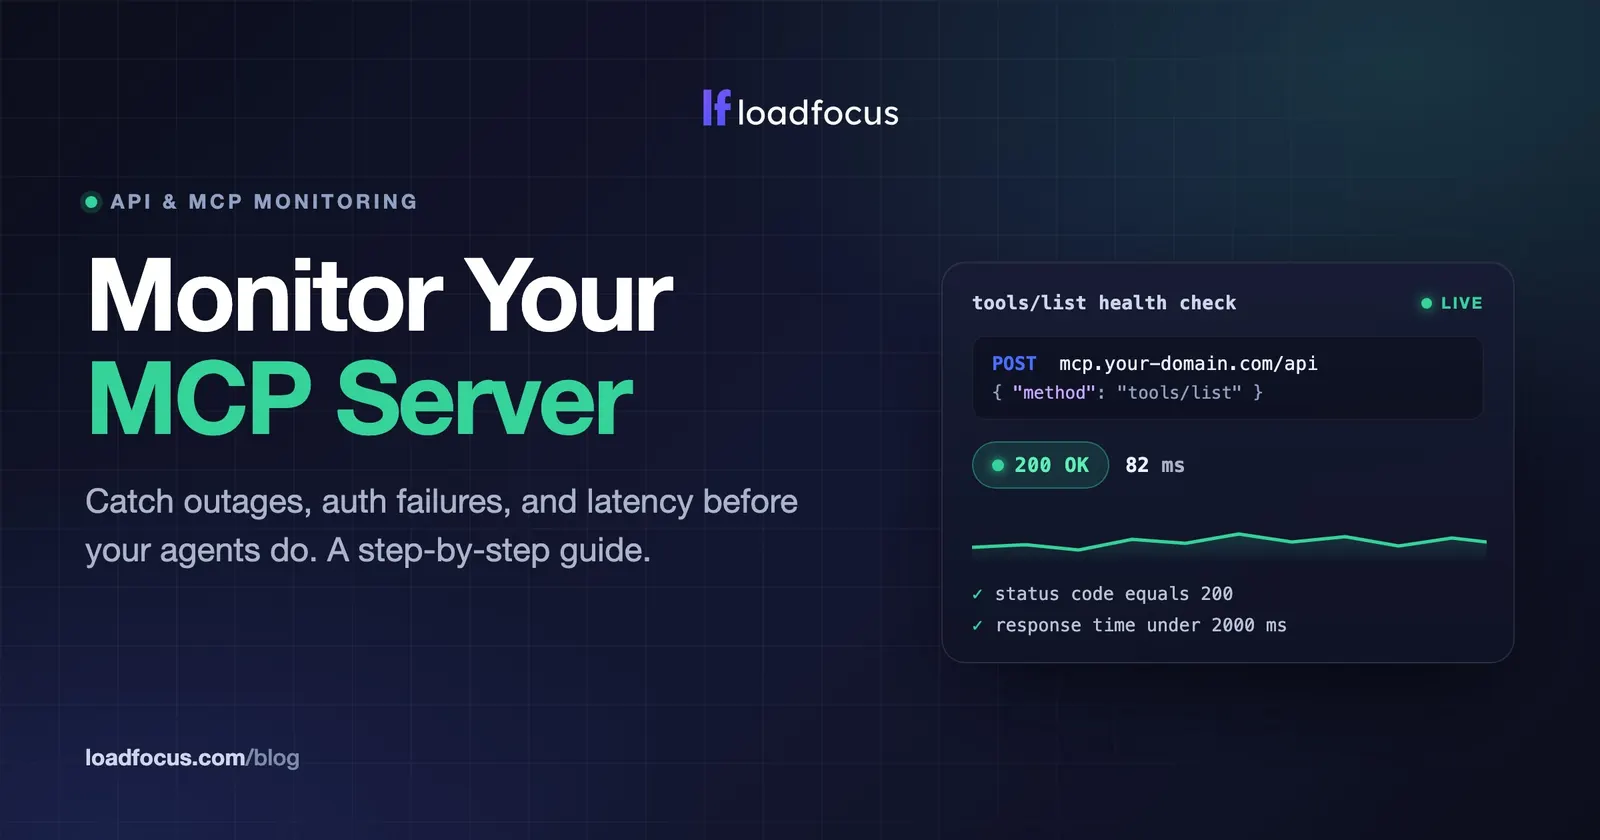
Start with tools/list. It is a read-only call that touches the transport, the auth layer and the tool registry, and the result should contain the tools you expect. Then add one read-only tools/call for a tool with no side effects, because a tool list that loads does not prove a tool works.
For a server on revision 2026-07-28, the request looks like this (curl; the URL and token are placeholders, and this exact call was not run against a live server):
curl -sS -X POST https://your-domain.com/mcp \
  -H "Authorization: Bearer $MCP_TOKEN" \
  -H "Content-Type: application/json" \
  -H "Accept: application/json, text/event-stream" \
  -H "MCP-Protocol-Version: 2026-07-28" \
  -H "Mcp-Method: tools/list" \
  -d '{
    "jsonrpc": "2.0",
    "id": 1,
    "method": "tools/list",
    "params": {
      "_meta": {
        "io.modelcontextprotocol/protocolVersion": "2026-07-28",
        "io.modelcontextprotocol/clientInfo": { "name": "uptime-monitor", "version": "1.0.0" },
        "io.modelcontextprotocol/clientCapabilities": {}
      }
    }
  }'
The Accept header must list both application/json and text/event-stream, because the server chooses per request which one to answer with. The Mcp-Method header must match the body’s method. For a server on an older revision that does not require sessions, the same body without _meta, MCP-Protocol-Version and Mcp-Method is the classic probe. If the server issues sessions, the monitor must run initialize first or a bare tools/list will return 400; in that case check whether the server can run stateless before building a two-step monitor.
A newer alternative is server/discover, which every 2026-07-28 server must implement; it returns the supported versions, capabilities and server identity, and it is cheap. It does not list tools, so it does not replace tools/list.
How do you set the monitor up in LoadFocus?
The same request works in any HTTP monitor. With LoadFocus API monitoring (loadfocus.com/api-monitoring, October 2026):
- Create an API monitor with method
POSTand your MCP endpoint URL. - Add the headers and body from the example above. Use a credential made for monitoring, with the least access that lets
tools/listsucceed, and store it as a secret rather than pasting it into notes. - Add assertions. The page lists assertions on status code, response time, response body (including JSON schema matching) and headers. Assert status
200, a response-time ceiling that fits your agents (for example 2000 ms; pick it from your own baseline), and, where the monitor can inspect the body, that it contains aresultand not anerror. - Choose interval and locations. The page lists a check every 5 minutes on Free, every minute on Starter and every 30 seconds on Professional, from any of 25 regions, and recommends at least 2 locations.
- Route alerts. Channels listed: email, Slack, Microsoft Teams, Discord, PagerDuty, Opsgenie and webhooks, with separate routing for failure and recovery, and noise controls such as a consecutive-failure threshold and a minimum number of failing locations.
If you keep monitors in version control, the same page describes defining checks in YAML or JSON and pushing them with a CLI (npx @loadfocus/monitoring).
One practical catch: if the server answers with text/event-stream, the body is SSE text (event: message followed by data: {...}), not a bare JSON object. A body assertion written for JSON may need to match on the text inside data:.
What do you alert on?
- Any non-200 status, separately for
401and403. An expired credential looks exactly like a healthy server from the outside, so give auth failures their own alert and owner. - A
400right after a deploy. It usually means a version or header mismatch between your monitor and the server, which is also what a real client would hit. - A body without
result.tools, or with fewer tools than expected. - Latency above your budget, on a p95 over a few runs rather than one slow call.
- A failing read-only
tools/call, includingisError: true.
Alert on failure and on recovery so an incident closes itself.
How does this relate to LoadFocus’s own MCP server?
LoadFocus runs an MCP server at mcp.loadfocus.com/api (loadfocus.com/index.md, October 2026). The code behind it builds a fresh server and transport for each request with no session id generator, so it is stateless: initialize returns no session header and tools/call needs none. It exposes tools for API monitors (for example check_api_endpoint, create_api_monitor, run_api_monitor, get_api_monitor_results) and load tests, and the API monitoring page says an MCP client can use it to create monitors, run checks and read results, with OAuth or API key authentication. That means you can ask your assistant to set up the monitor described above; still read the monitor it creates before trusting it.
Frequently Asked Questions
Can I monitor an MCP server with a normal uptime check?
You can, but it only proves the host answers. It will stay green through expired tokens, version mismatches and empty tool lists. Send a real JSON-RPC request and assert on the answer.
What request should a monitor send?
A tools/list POST with the headers a client sends, followed by one read-only tool call. For a server on revision 2026-07-28 that includes MCP-Protocol-Version, Mcp-Method and the _meta block in the body.
Why does my tools/list check return 400?
Common causes: the server requires headers or _meta your monitor does not send, the version is one the server no longer supports, or (older revisions) the server requires a session id from initialize.
Can I monitor an MCP server that only runs over stdio?
Not from an external HTTP monitor, because the client launches it as a subprocess. Test it in CI by starting it and calling tools/list, or put a Streamable HTTP front end on it.
How often should I check?
Pick the interval from how quickly you need to know, within what your plan allows. Every 1 to 5 minutes is typical for a production endpoint.
Sources
- Model Context Protocol, transports and Streamable HTTP (revision 2026-07-28): modelcontextprotocol.io/specification/2026-07-28/basic/transports/streamable-http (October 2026).
- Model Context Protocol, Streamable HTTP in revision 2025-11-25: modelcontextprotocol.io/specification/2025-11-25/basic/transports (October 2026).
- Model Context Protocol, tools and error handling: modelcontextprotocol.io/specification/2026-07-28/server/tools (October 2026).
- Model Context Protocol, discovery: modelcontextprotocol.io/specification/2026-07-28/server/discover (October 2026).
- Model Context Protocol, authorization error codes: modelcontextprotocol.io/specification/2026-07-28/basic/authorization (October 2026).
- LoadFocus API monitoring page and index.md: loadfocus.com/api-monitoring, loadfocus.com/index.md (October 2026).