What is Elastic APM?
Elastic APM is the application performance monitoring product within the Elastic Stack (formerly ELK). It instruments backend services with language-specific agents (Java, Node.js, Python, Ruby, Go, .NET, PHP), captures distributed traces, transactions and errors, and ships them into Elasticsearch where they correlate with logs and metrics in Kibana dashboards.
Elastic APM is positioned for engineering teams already running Elastic Stack who want code-level performance visibility — trace-driven debugging, service maps, latency distributions and error breakdowns — alongside their logs and metrics. It is observability-first, not synthetic monitoring or load testing.
When Elastic APM is the right tool
Elastic APM is a strong fit when:
- You're already on Elastic Stack. Logs, metrics, traces and APM in one platform; one query language and one dashboard.
- Code-level performance visibility. Distributed tracing across microservices with per-service latency and error breakdowns.
- Self-hosted or Elastic Cloud. Flexibility to run on your infrastructure with full data control.
- Open-source friendly. Apache 2.0 / Elastic License with a community edition.
If your goal is in-depth code-level observability for backend services, Elastic APM is purpose-built for that.
Where Elastic APM stops being enough
Elastic APM's focus on observability creates gaps in the synthetic / proactive monitoring space:
- No synthetic API monitoring. APM observes traffic that already happened; it does not run scheduled checks against your endpoints from external locations.
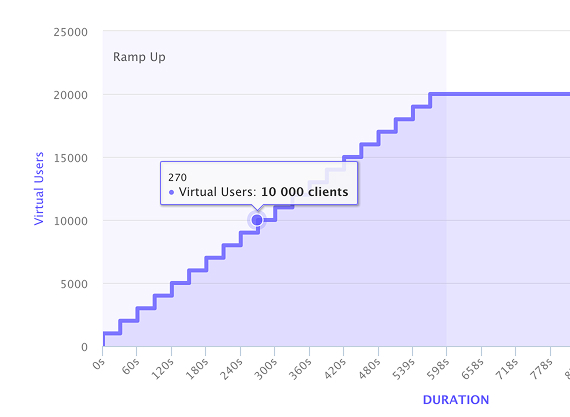
- No load testing. Concurrent-user load testing and stress simulations are out of scope.
- No real-browser synthetic. Browser-based user-journey monitoring is a separate Elastic product (Synthetics) with its own setup.
- No Core Web Vitals tracking. Lighthouse and CWV trends are not the focus.
- Operational overhead. Self-hosted Elastic clusters need ongoing capacity planning, scaling and maintenance.
LoadFocus vs Elastic APM — feature comparison
How LoadFocus compares against a typical Elastic APM deployment. Pricing accurate as of May 2026.
| Feature | LoadFocus | Elastic APM |
|---|---|---|
| Cost | Free tier; from $29/mo | Open-source + Elastic Cloud tiers |
| Synthetic API monitoring | Yes | No (separate Synthetics) |
| Code-level distributed tracing | No | Yes (specialty) |
| Real-browser synthetic | Yes (Selenium/Playwright) | Separate Elastic product |
| Load testing | Yes (up to 12,500 VUs) | No |
| Core Web Vitals monitoring | Yes | No |
| Multi-region external probes | 25+ globally | External Synthetics product |
| Self-service signup | Yes | Yes |
| Pay-per-test pricing | Yes | Cluster + ingestion costs |
| CI/CD integration | Yes (API + GitHub Action) | API available |
FAQ
Is LoadFocus a direct replacement for Elastic APM?
No — they solve adjacent but different problems. Elastic APM is observability (looking inside running services). LoadFocus is synthetic monitoring + load testing (looking at services from the outside, with proactive checks and stress tests). Most teams run both: APM for code-level diagnostics, LoadFocus for external uptime, API monitoring and load testing.
Can LoadFocus replace Elastic Synthetics?
For external API monitoring, real-browser synthetic checks and uptime, yes. LoadFocus combines those with load testing and Core Web Vitals on the same account, which usually consolidates two or three Elastic products and a separate load tool.
How do they complement each other?
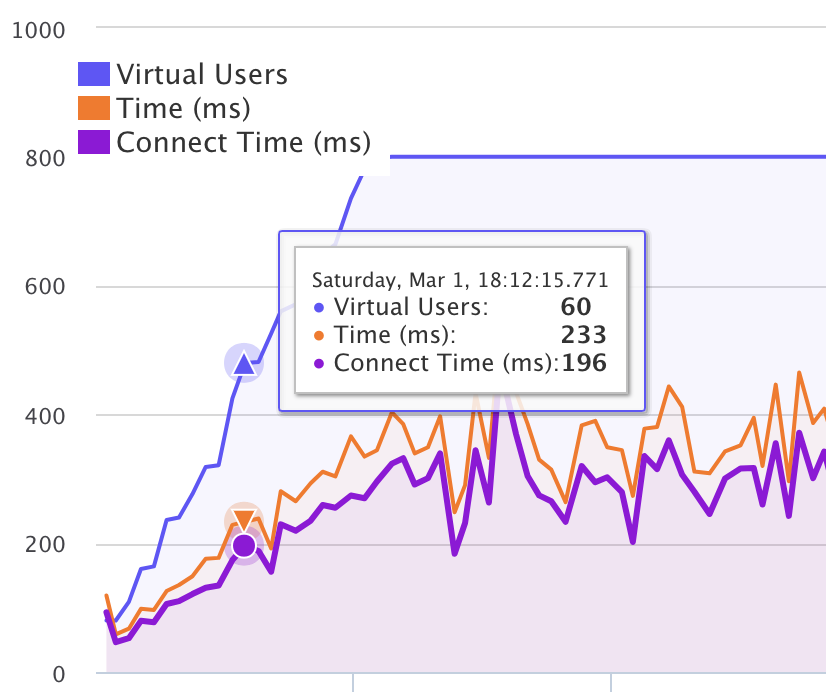
Use Elastic APM to debug a slow endpoint at code level (which span, which DB call). Use LoadFocus to verify the endpoint stays fast under load and stays available from your customers' regions when nobody is logged in to debug.
How does pricing compare?
Elastic APM is open-source self-hosted (cluster + ingestion costs) or paid Elastic Cloud tiers. LoadFocus uses transparent monthly tiers from $29/month with concurrent VUs and check frequency published upfront.
How long does setup take?
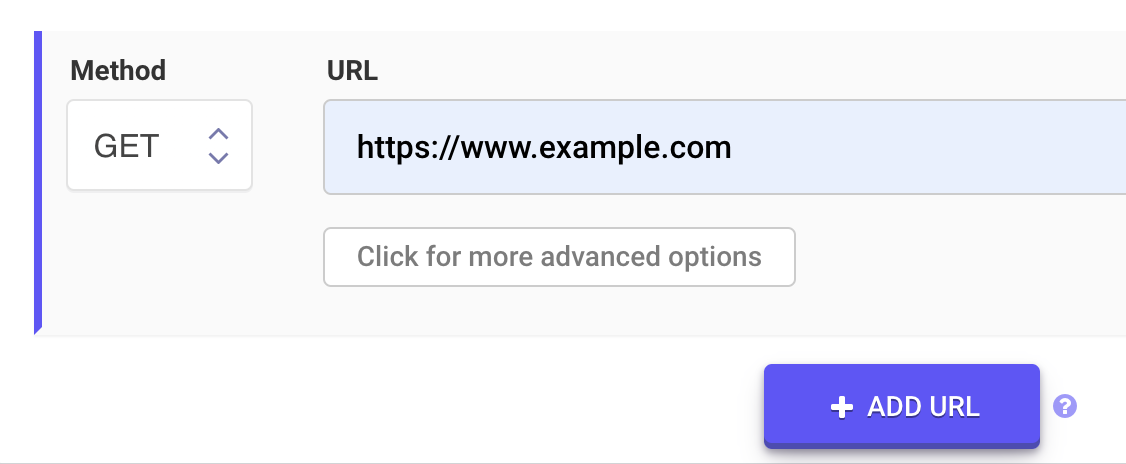
Minutes per monitor or load test. Add a URL or API endpoint, pick frequency or load profile, set assertions or thresholds, and checks start running — no agent installation in your services.
Can it run in CI/CD?
Yes. LoadFocus exposes a REST API and a GitHub Action so monitors and load tests run on every merge with thresholds for response time, error rate and concurrency.
Try LoadFocus free
If you're running Elastic APM and want external synthetic monitoring plus load testing on the same account, LoadFocus complements your APM stack rather than replaces it. Sign up at loadfocus.com/signup — no credit card — and run your first API monitor and load test in minutes.