Step-by-Step Guide to Creating a Single Pane of Glass for API Performance
This template provides a detailed framework for constructing a unified monitoring dashboard that consolidates multiple API performance metrics into a…
What is Step-by-Step Guide to Creating a Single Pane of Glass for API Performance?
This template serves as a comprehensive guide for designing and implementing a unified dashboard that brings together critical API performance metrics into one interface. A 'Single Pane of Glass' refers to a single unified view of performance data, making it easier for teams to monitor and manage APIs effectively. This guide will walk you through the essential elements needed for creating this dashboard, including key performance indicators (KPIs), visualization tools, and integration strategies.
Understanding API Performance Metrics
When creating a unified dashboard for API monitoring, it's crucial to identify the right metrics to track. Key metrics include response time, error rates, throughput, and availability. By consolidating these metrics into a single view, teams can quickly assess the health of their APIs and respond to any issues that arise.
Visualizing Data
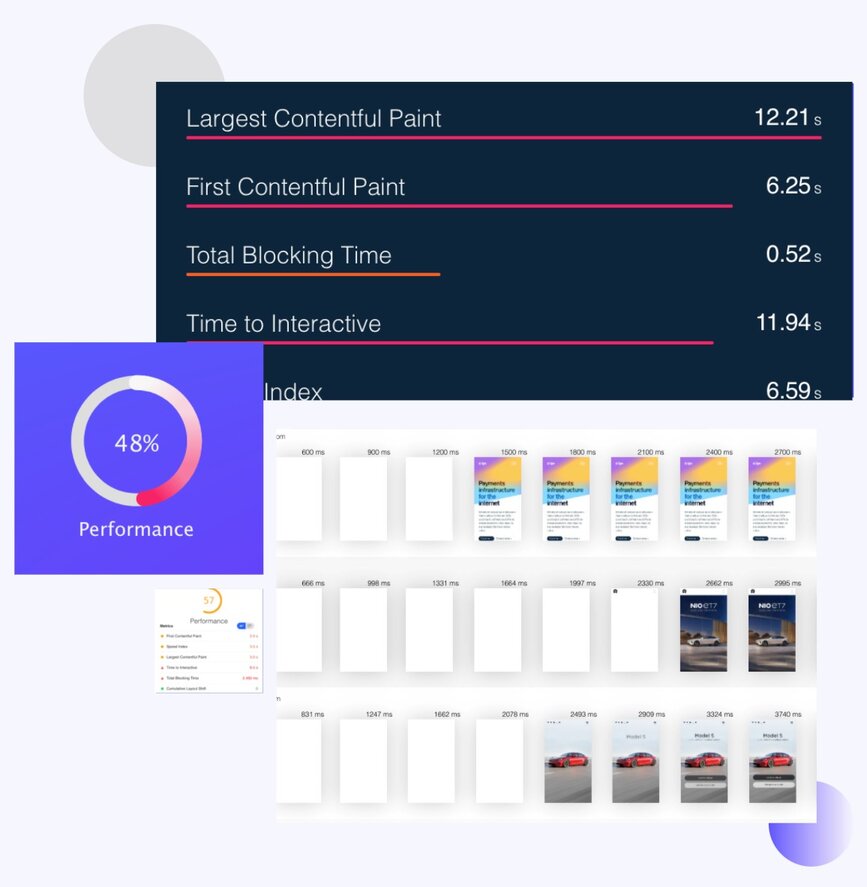
Effective data visualization is essential in a unified dashboard. Use graphs, charts, and tables to represent API performance metrics clearly and concisely. This visual representation aids in identifying trends, outliers, and potential issues at a glance.
Integrating Monitoring Tools
Integrating existing monitoring tools with your dashboard is a critical step. Utilize APIs from monitoring services such as LoadFocus to fetch real-time performance data, ensuring your dashboard reflects the most current information available.
Why is This Important for API Monitoring?
Having a unified view of API performance is essential for maintaining optimal service delivery. It allows teams to identify performance bottlenecks and outages proactively, thus improving response times and user experience. Furthermore, it aids in ensuring compliance with Service-Level Agreements (SLAs) and enhances overall operational efficiency. To delve deeper, consider how this template leverages LoadFocus for API monitoring. The LoadFocus platform provides robust tools for creating comprehensive dashboards, enabling seamless integration and real-time monitoring capabilities. By using this template, organizations can establish a proactive monitoring culture that significantly reduces downtime and improves API reliability.
FAQ on Creating a Unified API Monitoring Dashboard
What metrics should I include in my dashboard?
Include metrics such as response time, error rates, uptime, and request counts for a comprehensive view of API performance.
How can I visualize API performance data effectively?
Use graphs, charts, and heat maps to represent data visually, making it easier to spot trends and anomalies.
What tools can I integrate with my dashboard?
Integrate with monitoring tools like LoadFocus, New Relic, or Datadog for real-time data fetching and analysis.
How do I ensure data accuracy in my dashboard?
Regularly validate the data fetched from your monitoring tools and ensure proper configuration of metrics and alerts.
What is a Single Pane of Glass?
A Single Pane of Glass is a unified interface that provides a consolidated view of multiple data sources, allowing for improved monitoring and decision-making.
How fast is your website?
Elevate its speed and SEO seamlessly with our Free Speed Test.Outgrown your testing tools?
Load test websites and APIs from 25+ cloud regions, monitor page speed and uptime, and get AI analysis that explains your results in plain English.Start for free→