Why Most Microservices Load Testing Fails – and How Automation Fixes It
Manual Load Testing: Why It Breaks Down for Microservices
Traditional load testing methods fall short when applied to the complexity and pace of microservices. Attempting to test dozens or even hundreds of independent services with manual scripts or ad-hoc plans quickly becomes unmanageable. Each service may use a different language, run in its own container, and scale independently, making it easy to overlook critical bottlenecks.
Manual and ad-hoc testing typically results in three common failure patterns:
Is Your Infrastructure Ready for Global Traffic Spikes?
Unexpected load surges can disrupt your services. With LoadFocus’s cutting-edge Load Testing solutions, simulate real-world traffic from multiple global locations in a single test. Our advanced engine dynamically upscales and downscales virtual users in real time, delivering comprehensive reports that empower you to identify and resolve performance bottlenecks before they affect your users.
- Blind spots: Teams often focus on obvious endpoints and miss crucial inter-service dependencies. A single slow service can trigger cascading failures, especially during real-world traffic surges.
- Test fatigue: As microservices multiply, the effort required to configure, execute, and analyze tests grows exponentially, draining engineering resources and increasing the risk of human error.
- Stale baselines: Without automation, performance baselines quickly become outdated. As code and infrastructure evolve, regressions can slip in unnoticed.
Unexpected Bottlenecks When Microservices Are Under Load
Microservices architectures, adopted by companies like Etsy, Facebook, and Domino’s Pizza, are valued for their scalability and fault isolation. However, under load, they reveal unique pain points. For instance, a simple checkout process might involve a dozen services – inventory, payments, notifications, and more. If any one service lags, the entire user experience suffers. Network latency, rate limits, and hidden circular dependencies often only become apparent under stress.
Key Insight: Manual load testing rarely uncovers the true bottlenecks in microservices. Only automated load testing can reveal and measure system-wide impacts at scale.
How Automation – and LoadFocus – Changes the Game
Automated load testing microservices is not just about speed. It delivers consistency, coverage, and actionable insights. Tools like LoadFocus offer:
- CI/CD integration so tests run on every code change, catching regressions early.
- Cloud testing at scale to simulate real user traffic patterns across services and geographies, without custom infrastructure.
- Real-time analytics that highlight performance outliers immediately, enabling rapid response.
Unlike manual approaches, LoadFocus keeps pace with rapid iteration cycles in modern development. Automated tests and clear performance metrics give teams the confidence to deploy complex microservices architectures, knowing they’ll perform reliably under pressure.
Think your website can handle a traffic spike?
Fair enough, but why leave it to chance? Uncover your website’s true limits with LoadFocus’s cloud-based Load Testing for Web Apps, Websites, and APIs. Avoid the risk of costly downtimes and missed opportunities—find out before your users do!
Step 1: Define Performance Goals and Identify Critical Microservices
Before starting automated load testing microservices, define what success looks like. Many teams rush into testing without clear service-level objectives (SLOs) or service-level agreements (SLAs). Without knowing which services matter most or what response times are acceptable, test results lack actionable value.
Begin by clarifying business goals for your microservices. Are you optimizing for throughput, latency, uptime, or a combination? For example, an ecommerce checkout service may require sub-second response times under heavy load, while an internal reporting service can tolerate more latency. SLAs and SLOs should reflect real user and stakeholder needs.
Not All Microservices Are Equal – Choose Your Battles
Testing every microservice equally is inefficient and can distract from priorities. Companies like Etsy and Domino’s Pizza have demonstrated that prioritizing high-traffic, high-impact, or complex services yields the best results. Focus initial cycles on services like login/authentication, payment processing, or inventory search – these typically handle the most traffic and have the greatest business impact.
Conversely, batch jobs, low-traffic admin endpoints, or internal utilities usually don’t warrant the same level of scrutiny. By targeting your efforts, you avoid overwhelming your CI/CD pipeline and keep automated load testing focused and effective.
LoadFocus is an all-in-one Cloud Testing Platform for Websites and APIs for Load Testing, Apache JMeter Load Testing, Page Speed Monitoring and API Monitoring!
Key Insight: The greatest value from automated load testing microservices comes from focusing on services that drive user experience and revenue, not from blanket testing across the entire architecture.
Setting and Documenting Goals the Right Way
The most effective teams document SLOs for each microservice. This clarifies expectations and provides a concrete target for every test. Use a shared wiki, README, or inline documentation in your CI/CD definitions. Include:
- Target response times under expected and peak loads
- Acceptable error rates (timeouts, 5xx errors)
- Throughput requirements (requests per second/minute)
- Must-pass business workflows (e.g., “90% of checkouts complete in under 500ms”)
Explicit goals make failures actionable. You’ll know exactly which service missed its mark and why it matters to the business.
Checklist: Scoping Your Microservices Load Test
Use the table below to audit and prioritize which microservices to test. This approach keeps your focus on what truly matters.
| Check Item | What to Look For | Why It Matters |
|---|---|---|
| Traffic Volume | Services handling a significant share of daily requests (e.g., authentication, search) | High-traffic endpoints are most likely to reveal scaling bottlenecks and impact user experience. |
| Business Criticality | Direct link to revenue or customer workflows (e.g., payments, order placement) | Failures in these services have immediate financial or reputational consequences. |
| Complex Dependencies | Services that call multiple downstream APIs or rely on third-party integrations | Increased complexity raises the likelihood of cascading failures under load. |
| Error History | Endpoints with recent spikes in 5xx errors or timeouts | Past incidents are strong predictors of future risk under load. |
| Release Frequency | Services updated frequently | Frequent changes mean higher risk of performance regressions slipping into production. |
| External Contract Points | Public APIs or partner integrations | External visibility demands higher reliability and performance standards. |
Start with the top 3-5 services based on this audit. As your automated load testing matures, expand coverage gradually. The goal is to catch the highest risks with the least effort, then iterate.
Defining goals and scoping your test plan up front is foundational for a scalable microservices performance strategy. Teams that skip this step often face missed incidents and wasted cycles. Get this right, and the rest of your automation journey becomes much smoother.
Step 2: Map Dependencies and Prepare the Test Environment
Before running automated load testing for microservices, map out how your services interact. Microservices rarely operate in isolation. Every API call, event, or database operation can ripple across many interconnected components. Without this mapping, you risk underestimating risk or building unreliable tests.
Begin by documenting every service dependency and data flow in your test scenario. For example, if you’re load testing an e-commerce checkout, note the real-time calls to payment gateways, inventory databases, and notification services. Visualization tools like Lucidchart or PlantUML help clarify these connections. If a downstream service is unstable or under development, use stubs or mocks. Tools such as Artillery and k6 support service virtualization, letting you replace real endpoints with predictable responses.
Next, ensure test data mirrors production reality. Using only dummy values rarely exposes real-world bottlenecks. For instance, a financial application may behave differently under load with real transaction data. When using tools like LoadFocus or JMeter, seed your environment with realistic datasets – always anonymizing sensitive information.
Environment parity with production is essential. Running tests on underpowered staging servers leads to misleading results. Companies like Facebook and Etsy have learned that if your test environment doesn’t match production – autoscaling rules, network latency, middleware versions – your results may be unreliable. Cloud-based platforms such as LoadFocus simplify spinning up production-like environments, but configuration and data parity remain your responsibility.
Actionable Playbook: Environment Readiness for Load Testing
- List every inter-service dependency for your scenario, including APIs, databases, message queues, and third-party integrations.
- Decide between real and virtualized services. Use stubs or mocks for unavailable dependencies.
- Provision an isolated, production-like environment using infrastructure-as-code tools.
- Seed with realistic test data. Use anonymized datasets or generate representative payloads.
- Validate environment parity. Check versions of all microservices, middleware, and infrastructure components.
- Monitor environment health before, during, and after testing.
Attention to these details ensures your automated load testing microservices process surfaces meaningful bottlenecks, not just configuration errors. Investing in robust environment preparation leads to actionable results.
Step 3: Select Load Testing Tools – Why LoadFocus Stands Out
How to Evaluate Load Testing Tools for Microservices
Choosing a load testing platform for microservices is about more than throughput or dashboards. The right tool depends on your team’s scripting expertise, cloud-native support needs, and how well it fits into your CI/CD pipeline. For example, teams comfortable with JavaScript may prefer k6 or Artillery, while those with legacy scripts might favor JMeter.
Microservices introduce new requirements: simulating distributed traffic, orchestrating tests as part of automated deployments, and extracting actionable analytics. Automated load testing microservices is about identifying bottlenecks in context, not just hammering endpoints.
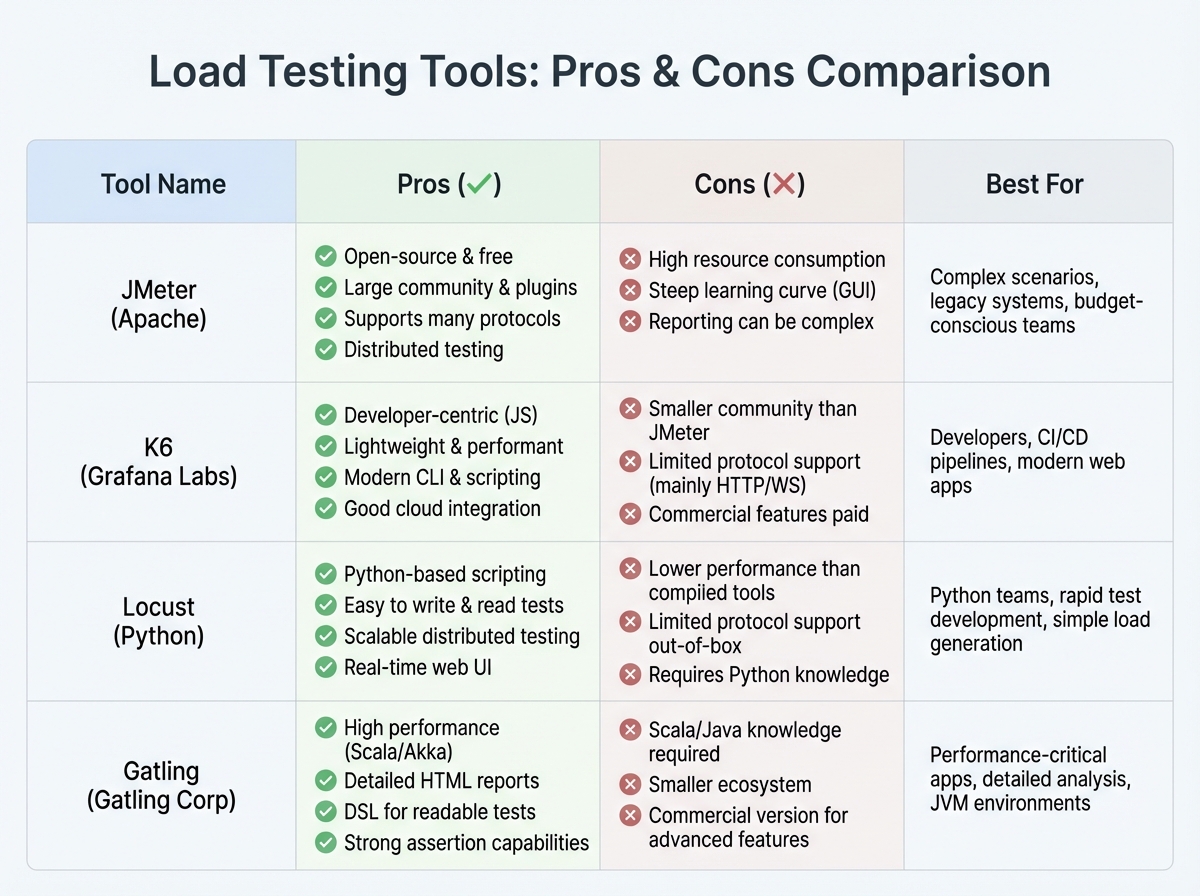
Comparison Table: Popular Load Testing Tools for Microservices
| Tool | Best For | Notable Strengths | Potential Limitations |
|---|---|---|---|
| LoadFocus | Cloud-based microservices and API performance | Cloud-native test execution, Real-time analytics, Simple CI/CD integration, Supports both API and website testing | Less advanced scripting than code-heavy tools, Requires internet connectivity for test execution |
| JMeter | Enterprise-grade batch testing, legacy systems | Mature plugin ecosystem, Flexible scripting (Java), Large community support | Steep learning curve, Less intuitive for cloud and microservices, Needs infrastructure setup for distributed runs |
| k6 | Developer-driven API and microservices load tests | JavaScript scripting, Native CI/CD integration, Strong cloud offering, Open-source and commercial versions | Advanced features in paid tiers, UI less suited for non-developers |
| Artillery | Modern APIs and event-driven microservices | YAML/JavaScript scripting, Real-time reporting, Focus on APIs and microservices | Limited GUI, More setup for large-scale distributed tests |
| Gatling | High-performance, code-centric load scenarios | Scala-based scripting, Scenario flexibility, Detailed metrics | Learning curve for non-coders, Less plug-and-play for cloud-native workflows |
Why LoadFocus Fits Cloud-Native Microservices Loads
For teams running automated load testing microservices in the cloud, LoadFocus addresses challenges that other tools often overlook. The platform runs tests without local infrastructure, so you avoid managing load agents or complex DevOps scripts. Its real-time analytics dashboard highlights slow endpoints, error spikes, and throughput issues as they occur, making it easier to pinpoint which microservice is struggling.
LoadFocus is designed for cloud-native testing. You can scale up concurrent users on demand, trigger tests from your CI/CD pipeline, and run large-scale scenarios that reflect actual global traffic. Coverage includes both REST APIs and full web applications, providing flexibility as your architecture evolves.
Limitations and Trade-Offs to Consider
No tool is perfect. While LoadFocus excels at cloud scalability and ease of use, it may not offer the deep scripting flexibility of JMeter or Gatling for highly custom scenarios. If you need granular control over protocols and payloads, code-centric tools remain valuable. Conversely, maintaining traditional test runners for distributed microservices can consume significant time and resources as systems scale.
The right tool depends on your team’s strengths and your balance between automation and manual tuning. For high-growth businesses, prioritizing cloud-native, analytics-driven platforms like LoadFocus can simplify your stack and keep your architecture resilient as traffic and requirements shift.
Step 4: Create and Parameterize Automated Load Test Scenarios
Effective automated load testing microservices scenarios go beyond sending random traffic to endpoints. The real value lies in modeling how users and systems interact, capturing the complexity and variability of production environments. Leading teams use parameterization to create data-driven tests and avoid common pitfalls.
Model Real-World Usage Patterns
A script that repeats the same request won’t reveal meaningful bottlenecks. Microservices architectures depend on diverse endpoints, payload sizes, and traffic patterns. Model realistic user journeys – such as login, browse, checkout, and notification flows for an e-commerce backend. For example, Domino’s Pizza uses microservices to scale from hundreds to thousands of orders per minute, each triggering unique architectural paths. Your load tests should reflect this complexity.
- Identify high-value transactions and typical request patterns
- Replicate production traffic mix – avoid targeting only a single service
- Include edge cases and spikes to expose weaknesses
Parameterization: The Key to Data-Driven Tests
Parameterization turns static scripts into dynamic, reusable test scenarios. With LoadFocus, you can inject variables into URLs, headers, payloads, or authentication tokens, using data from CSVs, APIs, or random generators. This enables each simulated user to perform slightly different actions, uncovering race conditions and subtle performance issues.
For API testing, parameterizing customer IDs or product SKUs prevents cache hits from hiding real latency. JMeter and k6 support parameter files, allowing you to scale up with thousands of unique requests – essential for stress-testing services built for large user bases.
Avoid Common Script Anti-Patterns
- Don’t test all services equally: Focus on high-traffic and business-critical endpoints first. Testing every microservice at scale wastes resources.
- Avoid hard-coded values: Static data leads to artificial results and missed defects.
- Skip trivial scenarios: “Hello world” tests may pass, but don’t mimic real workloads. Use service virtualization or mocks for incomplete dependencies.
Service virtualization is especially useful when dependencies are under development. Simulating unavailable components keeps testing velocity high.
Before/After Example: Naive vs. Optimized Load Scenario
| Before: Naive Script | After: Optimized, Parameterized Scenario |
|---|---|
|
|
The naive script would “green light” a service by repeating identical requests, masking issues like session contention or inconsistent latency. The optimized scenario, by parameterizing inputs and simulating diverse behaviors, uncovers bugs and bottlenecks that only appear at scale. This is where automated load testing microservices delivers the most value.
Investing in realistic scenarios takes more effort initially, but it’s the only way to gain confidence in microservices performance before launch. The closer your tests are to production reality, the fewer surprises you’ll face with real users.
Step 5: Integrate Automated Load Tests Into CI/CD Pipelines
Automated load testing microservices is only as valuable as the feedback it provides – when you need it. Integrating LoadFocus into your CI/CD pipeline ensures continuous performance feedback, catching regressions before code reaches production. However, testing too frequently or too broadly can increase costs or slow down the pipeline.
Key Insight: The fastest way to catch performance regressions is to run targeted, automated load tests at critical pipeline stages – always with intent, never everywhere.
Where to Trigger Load Tests in the Pipeline
Key points to integrate load testing for microservices include:
- After build: Useful for lightweight smoke tests, but not full-scale scenarios.
- After deploy to staging or pre-production: Ideal for broader, higher-load tests that reveal bottlenecks in near-production conditions.
- Before production release: Some teams add a final load test gate for major releases or high-risk services, but this can extend release times.
Focus on high-risk services and endpoints with the most traffic or recent changes. This targeted approach keeps feedback actionable.
Best Practices: Feedback Loops, Alerts, and Balancing Trade-offs
Make performance test results visible where developers work – such as Slack, pull request comments, or dashboards. For critical failures, trigger alerts to the right owners. Use thresholds and trend detection instead of failing every build on minor slowdowns.
Pipeline speed matters. Full-scale tests on every commit slow teams down. Use tiered tests: quick smoke tests on each build, deeper tests nightly or on staging. Prioritize services with the most dependencies or incident history.
Test flakiness can be a challenge. Cloud variability and network issues are common. Keep tests deterministic, use consistent data sets, and set retry logic for transient errors. Monitor false positives so developers don’t ignore alerts.
Actionable Playbook: Automating Load Tests in CI/CD
- Connect LoadFocus to your CI/CD platform using plugins or API triggers.
- Configure test jobs with API keys securely stored in your pipeline secrets manager.
- Trigger targeted test scenarios only for critical microservices or after significant code changes.
- Publish test results automatically to your team’s preferred channels.
- Set alert thresholds for key metrics so only significant regressions block the pipeline or trigger notifications.
Integrating automated load testing microservices with LoadFocus helps teams move quickly while maintaining visibility – spotting issues before they reach customers. The right balance of automation and feedback is essential for scaling systems safely.
Step 6: Analyze Results – Detect Bottlenecks and Performance Trends
The value of automated load testing microservices comes from analysis, not just execution. Once tests complete in LoadFocus, dashboards and reports become your primary tools for identifying bottlenecks and tracking regressions.
Critical Metrics for Microservices: What Matters
Microservices architectures generate vast amounts of performance data. Focus on metrics that indicate real problems:
- Latency (Response Time): High p95 or p99 latency means some users experience unacceptable delays, even if averages look fine.
- Requests Per Second (RPS): Measures throughput. Spikes or drops can signal scaling problems or rate limits.
- Error Rates: Track both client and server errors. A rise in 5xx errors during a test often signals overloaded or misconfigured services.
- Resource Utilization: CPU, memory, and network usage per container or node. These help distinguish between compute, memory, or code-level bottlenecks.
Teams at companies like Etsy and Domino’s Pizza monitor these signals to ensure their microservices withstand high-traffic events.
Table: Key Metrics for Microservices Load Testing
| Metric | What It Measures | What to Watch For |
|---|---|---|
| Latency (p95, p99) | Time for 95%/99% of requests to complete | Spikes above baseline (e.g., p99 > 1s) during peak load |
| Requests Per Second (RPS) | Throughput handled by each service | Sustained dips or erratic spikes at scale |
| Error Rate (% 5xx, 4xx) | Proportion of failed requests | Sudden increases, especially in 5xx errors during high load |
| CPU Utilization | Processing capacity used per container/node | Consistent usage above 80%, leading to throttling or crashes |
| Memory Usage | RAM consumed by service instances | Leakage patterns or spikes that precede restarts |
| Network Latency | Time for inter-service communication | Unexpected increases, suggesting network congestion or misconfiguration |
Using LoadFocus Dashboards and Reports
LoadFocus provides dashboards that surface these metrics in real time. Overlay multiple test runs, compare baselines, and export detailed reports for team review. The visualization tools make it easy to spot anomalies – such as a latency jump after a deployment or a memory spike on a specific node. For teams running automated load testing microservices in CI/CD, these trends serve as early warnings, not just post-mortem artifacts.
Comparing runs side by side is especially valuable for tracking regressions. If your RPS drops after a library upgrade, LoadFocus makes it clear. If error rates rise on a single service, you can address it before it affects the entire application.
Distinguishing Network, Code, and Infrastructure Problems
Most microservices performance issues fall into three categories: network hiccups, code inefficiencies, or infrastructure bottlenecks. Correlate your metrics:
- If latency rises across all services but CPU and memory stay flat, suspect network or service mesh issues.
- If one service shows high resource usage and error rates, look for code inefficiencies or recent deployment changes.
- If multiple services hit resource limits simultaneously, infrastructure scaling or tuning may be needed.
Automated dashboards flag symptoms, but root cause analysis may require distributed tracing or deeper service logs. Still, disciplined analysis turns each test run into a powerful feedback loop, helping you build faster, more resilient systems.
Step 7: Iterate, Optimize, and Integrate Learnings Into DevOps Workflows
Key Insight: The strongest performance gains come from treating automated load testing microservices as a feedback loop, not a one-off checklist item.
Performance Testing is Never “Done”
Microservices are constantly evolving. Teams deploy frequently, dependencies shift, and usage patterns change. Running automated load testing microservices once and moving on misses the point – continuous improvement is essential for resilient systems.
Effective organizations treat performance testing as a cyclical process. Every test run informs development, and every release is an opportunity to validate, learn, and adapt. Companies like Facebook and Etsy refine their architectures by using performance insights to guide both code and infrastructure changes.
Closing the Feedback Loop With Development
The best load testing tools – LoadFocus included – make it easy to deliver test results directly to your team’s workflow. Send actionable reports to Slack, trigger tickets for regressions, or block deployments when thresholds aren’t met. Documenting findings is not enough; sharing insights ensures they drive real decisions.
For example, if a new deployment doubles response times on a payment microservice, a strong DevOps culture will quickly triage the regression, compare with previous baselines, and prioritize a fix – often before customers are affected.
Document, Share, and Institutionalize Learnings
Performance wins and setbacks need to be captured. Create living documentation with before/after benchmarks, root cause analyses, and mitigation strategies. Share these in engineering wikis or sprint reviews. This avoids repeat mistakes and helps onboard new team members quickly.
Teams that document findings enable everyone – engineering, QA, product – to speak the same language about performance. This is especially important as microservices multiply and teams expand.
Strategies for Continuous Optimization
- Automate regression detection by comparing each test run against historical data. Highlight meaningful deviations.
- Prioritize optimization on high-traffic, high-risk microservices; blanket testing can waste resources.
- Schedule regular load test runs – daily or per commit – to ensure no code change is missed.
- Integrate performance criteria into CI/CD pipelines, so releases are gated by real-world data, not just functional tests.
For instance, if an API powering your checkout process shows increasing latency, catching that trend early prevents revenue loss and customer frustration.
Not every regression will be caught by automated tests, especially with highly variable traffic or deeply interconnected microservices. Still, building a culture of iteration and data-driven optimization sets your architecture up for long-term scalability.
Step 8: Limitations, Gotchas, and When to Supplement Automated Load Testing
Where Automation Hits the Wall
Automated load testing microservices with LoadFocus will catch many bottlenecks, but it isn’t a cure-all. Some issues – like latency spikes from unpredictable network conditions or rare concurrency failures – may escape scripted scenarios. Automated tests are excellent for simulating traffic and user patterns, but not every critical issue appears in controlled environments.
Integrating Manual, Chaos, and Contract Testing
To address these blind spots, experienced teams combine automation with other strategies. Manual exploratory testing can reveal edge cases automation misses, especially in integrations that don’t follow the “happy path.” Chaos engineering introduces faults or outages to test resilience. Contract testing ensures API boundaries and service agreements are honored as services evolve. Each method complements automated load testing.
Cloud Costs, Vendor Choice, and Complexity
While LoadFocus simplifies large-scale cloud testing, cost management becomes important at scale. Running frequent, high-volume tests on many microservices can increase cloud bills, especially if testing every commit or building complex scenarios. Focus tests where risk is highest and schedule deep-load runs strategically.
Another consideration is vendor lock-in. LoadFocus offers user-friendly automation and integration, but relying on a single platform means your scripts and workflows may not transfer easily. Teams with specialized needs or compliance requirements may supplement LoadFocus with open-source tools like JMeter or k6 for flexibility.
Automated load testing microservices is powerful, but it’s only one part of a resilient performance strategy. Smart teams combine automation with targeted manual and chaos testing, while keeping an eye on both cost and flexibility as systems evolve.
Summary Checklist: Automated Load Testing for Microservices with LoadFocus
Skipping steps in automated load testing microservices leads to missed bottlenecks and unreliable deployments. Use this checklist to ensure every critical step gets proper attention with LoadFocus. It covers everything from defining goals to integrating insights into DevOps workflows – no vague steps, just actionable items.
| Step | Key Action | Why It Matters |
|---|---|---|
| 1. Set Performance Goals | Define service-level objectives for each microservice | Clear targets guide test design and prevent wasted cycles on low-impact endpoints |
| 2. Map Dependencies | Visualize how services interact and identify high-risk areas | Dependency mapping avoids blind spots that could cripple distributed systems |
| 3. Choose the Right Tool | Select LoadFocus and configure integrations for your CI/CD pipeline | Tool alignment ensures your team’s scripting skills and automation needs are met |
| 4. Build Realistic Scenarios | Parameterize test scripts based on real workloads and user behavior | Accurate modeling exposes true limitations, not just theoretical ones |
| 5. Automate in CI/CD | Run tests automatically on every build or deployment | Continuous feedback catches regressions before they reach production |
| 6. Analyze and Prioritize Fixes | Review LoadFocus dashboards, address bottlenecks, and track trends | Data-driven decisions focus teams on high-impact optimizations |
| 7. Iterate and Integrate Learnings | Refine tests, update baselines, and share findings with DevOps | Continuous improvement keeps your automation relevant as microservices evolve |
Completing every step on this list separates reliable, scalable microservices from unpredictable releases. As your architecture grows, a repeatable checklist becomes your safety net.
Frequently Asked Questions About Automated Load Testing for Microservices
What are the biggest obstacles in automated load testing microservices?
Test scope and flakiness are two common challenges. Testing every microservice the same way leads to slow cycles and missed bottlenecks. Focus on high-risk services and those facing unpredictable traffic. Managing dependencies is also difficult – service virtualization helps test components even if not all dependencies are live.
Which tools are best for automated load testing microservices?
There’s no universal answer. LoadFocus is notable for its cloud-native approach and CI/CD integration. Many teams pair LoadFocus with JMeter for advanced scripting, or use k6 or Artillery for JavaScript or YAML-driven configurations. The right tool depends on your team’s skills, dashboard needs, and integration requirements.
How early should load testing begin in the development cycle?
Start as early as possible. Introducing automated load testing for microservices early helps catch issues like resource contention or performance regressions before they become costly. Leading organizations run performance tests on feature branches and pull requests, not just in staging.
What are the limitations of automated load testing for microservices?
Automated tools efficiently find throughput and latency issues, but some failure scenarios – such as cascading failures or rare data races – may go undetected. No tool simulates production traffic perfectly. CI/CD integration can also become a bottleneck if tests are too broad or slow. Supplement automation with targeted manual or chaos testing for critical releases.
How does LoadFocus integrate with CI/CD pipelines?
LoadFocus is designed for seamless pipeline integration. You can trigger tests automatically on every build or deployment, with results feeding directly into dashboards and alerting tools. Unlike local scripts, everything runs in the cloud, scaling as needed.
What advanced strategies help teams get more value from automated load testing microservices?
- Prioritize risk-based testing: Focus on services with heavy dependencies or customer impact.
- Parameterize test scenarios to mimic real user behavior, not just fixed API calls.
- Set performance baselines early and track changes over time to spot regressions.
- Combine service virtualization and mocks to isolate services and accelerate feedback.
The bottom line: automated load testing microservices is essential for any serious cloud-native architecture, but it’s only effective when approached strategically. With the right tools, early testing, and a focus on your riskiest services, you’ll catch performance issues before they impact your customers or business.