Illustrative Scenario: Breaking Through the API Latency Barrier
When Latency Starts to Hurt: A Real-World Wake-Up Call
In early 2026, a fast-growing SaaS company faced a surge in support tickets. Customers reported sluggish dashboards, timeout errors, and intermittent failures syncing data across regions. Despite strong infrastructure and high uptime, the API latency graph showed a steady climb, especially during peak hours. For product managers, this was more than a technical nuisance – it risked eroding user trust and increasing churn.
The impact of high API latency extended beyond user-facing features. Internal workflows relying on real-time API calls – such as billing, analytics, and cross-team integrations – began missing SLAs. Automated retry mechanisms, triggered by slow responses, further strained the system under load. The difference between moderate and high response times became the difference between a smooth experience and one filled with frustration and hidden costs.
Is Your Infrastructure Ready for Global Traffic Spikes?
Unexpected load surges can disrupt your services. With LoadFocus’s cutting-edge Load Testing solutions, simulate real-world traffic from multiple global locations in a single test. Our advanced engine dynamically upscales and downscales virtual users in real time, delivering comprehensive reports that empower you to identify and resolve performance bottlenecks before they affect your users.
Why Traditional Monitoring Wasn’t Enough
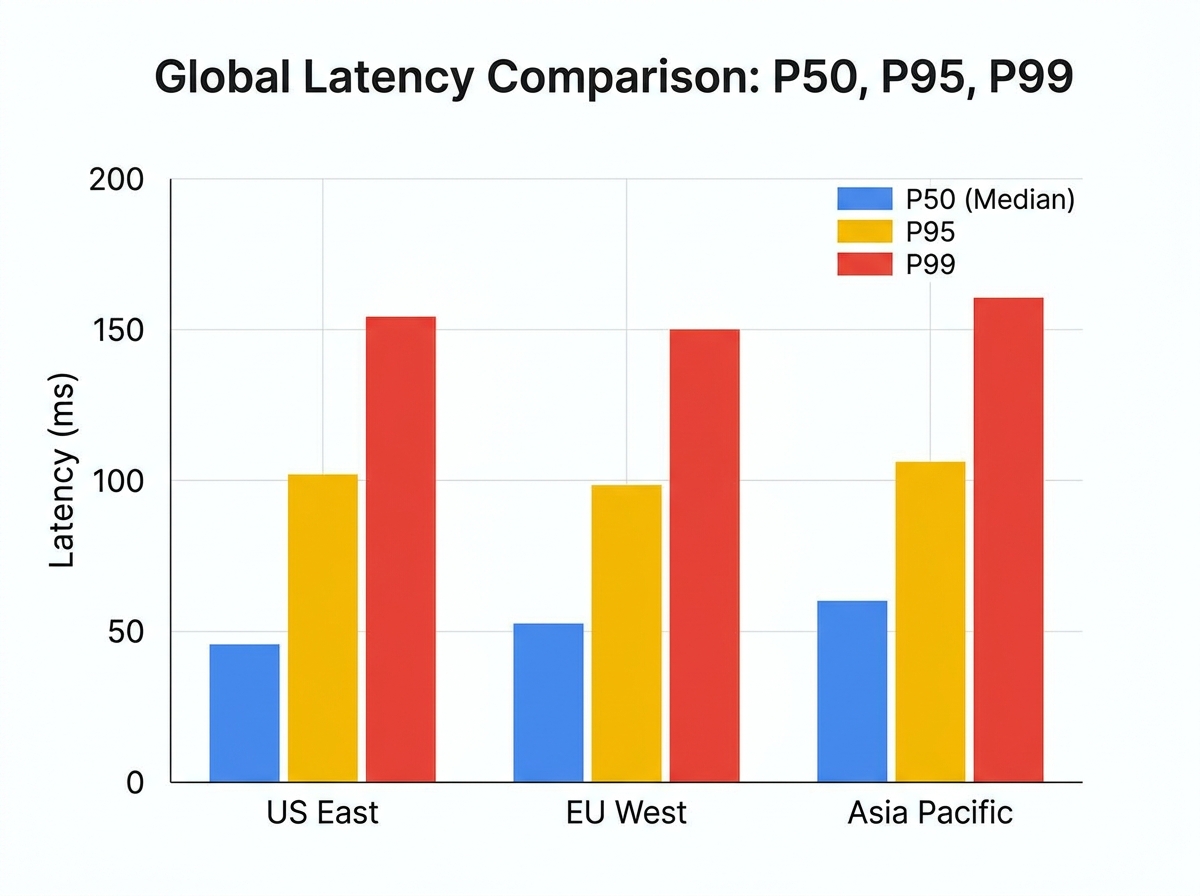
The company’s observability stack tracked average response times and flagged obvious failures, but average latency proved misleading. Spikes at the P95 and P99 percentiles revealed that a minority of requests suffered significant delays, particularly during traffic surges or in certain regions. Outlier cases – such as doubled network hops or lagging third-party services – remained invisible on dashboards focused on averages.
Debugging with logs and APM tools led to confusion: Was the culprit the network, the load balancer, or a specific database call? No single metric revealed the underlying pattern. Teams struggled to reproduce issues outside production, where real-world latency dynamics actually occur.
Escalation and a New Mandate
As user complaints mounted and business operations were disrupted, leadership launched a focused initiative: diagnose and resolve API latency issues with concrete evidence. This required moving from reactive monitoring to distributed load testing – simulating realistic, geographically diverse traffic and tracking percentile-based latency under stress. Only by testing at scale in real-world scenarios could engineering teams pinpoint bottlenecks hidden by averages and synthetic benchmarks.
Think your website can handle a traffic spike?
Fair enough, but why leave it to chance? Uncover your website’s true limits with LoadFocus’s cloud-based Load Testing for Web Apps, Websites, and APIs. Avoid the risk of costly downtimes and missed opportunities—find out before your users do!
This scenario forced a re-evaluation of performance testing strategies and highlighted why reliable, actionable data – not just more alerts – forms the foundation of high-performing API-driven businesses.
The Challenge: Uncovering Subtle Bottlenecks in API Latency
For teams responsible for delivering reliable API-driven experiences, high API latency is difficult to ignore. Slow response times frustrate users, trigger intermittent errors, and increase support tickets. These issues often spike during peak usage or for users in specific regions, leading to a cascade of failed requests and timeouts that undermine trust in your service.
Even a small percentage of slow requests – those outliers in the tail of your latency distribution – can mean the difference between a smooth user journey and a barrage of complaints. Traditional load testing, focused on aggregate throughput or average response times, rarely captures these subtle but damaging bottlenecks.
| Observed Issue | Traditional Approach | Limitation |
|---|---|---|
| Intermittent timeout errors from Asia-Pacific users | Load test from single US-based cloud region | Missed regional network-induced latency and routing delays |
| Sharp increase in support tickets during traffic spikes | Periodic stress test with fixed traffic profile | Failed to simulate real-world burstiness or queueing effects |
| Negative reviews citing “slowness” for mobile users | Measured only server-side processing time | Ignored client-side and network transport delays |
| Unexplained application freezes on third-party API calls | Monitored average API latency | Masked outliers causing user-visible stalls |
Key Insight: Focusing solely on averages and single-region testing blinds teams to the real-world latency spikes that drive user complaints and business risk.
Why Average Latency Metrics Fall Short
Many teams rely on average API latency as their main performance indicator. But averages conceal the real story. If most requests finish in 200ms but a handful spike above 2 seconds, the average barely moves, yet those slow requests ruin the experience for affected users.
LoadFocus is an all-in-one Cloud Testing Platform for Websites and APIs for Load Testing, Apache JMeter Load Testing, Page Speed Monitoring and API Monitoring!
In distributed architectures and global deployments, average metrics are especially misleading. Averages blend together network hiccups, geographic distance, and transient server slowdowns into a single, sanitized number. When presented to business stakeholders, this risks overlooking the “long tail” events – rare but impactful slowdowns that destroy SLAs and drive churn.
Traditional load tests, especially those run from a single region or cloud provider, amplify this blind spot. They can show green across the board while users in, for example, Singapore or São Paulo are routinely timing out.
The Cost of Ignoring Percentiles
Tracking only the average latency is like measuring highway traffic by counting just the cars in the slow lane. P95 and P99 latency values reveal the worst experiences, not just the typical ones. When P99 latency is significantly higher than the median, a small fraction of users is waiting much longer than the “average” user. That’s where the damage happens – support escalations, user abandonment, and word-of-mouth complaints.
Business leaders feel the impact when reliability targets are missed in overseas markets or during high-stakes product launches. Percentile-based analysis surfaces these risks early. P95 and P99 metrics force teams to confront the reality that a system may delight most users but still frustrate a vocal minority – often those relying on the product at critical moments.
Ignoring these outliers can lead to missed SLAs, increased operational costs, and lost business opportunities. By shifting focus from averages to percentile-based visibility, engineering and business teams can finally align on tackling the bottlenecks that truly matter.
Approach: Distributed Load Testing as the Key Strategy
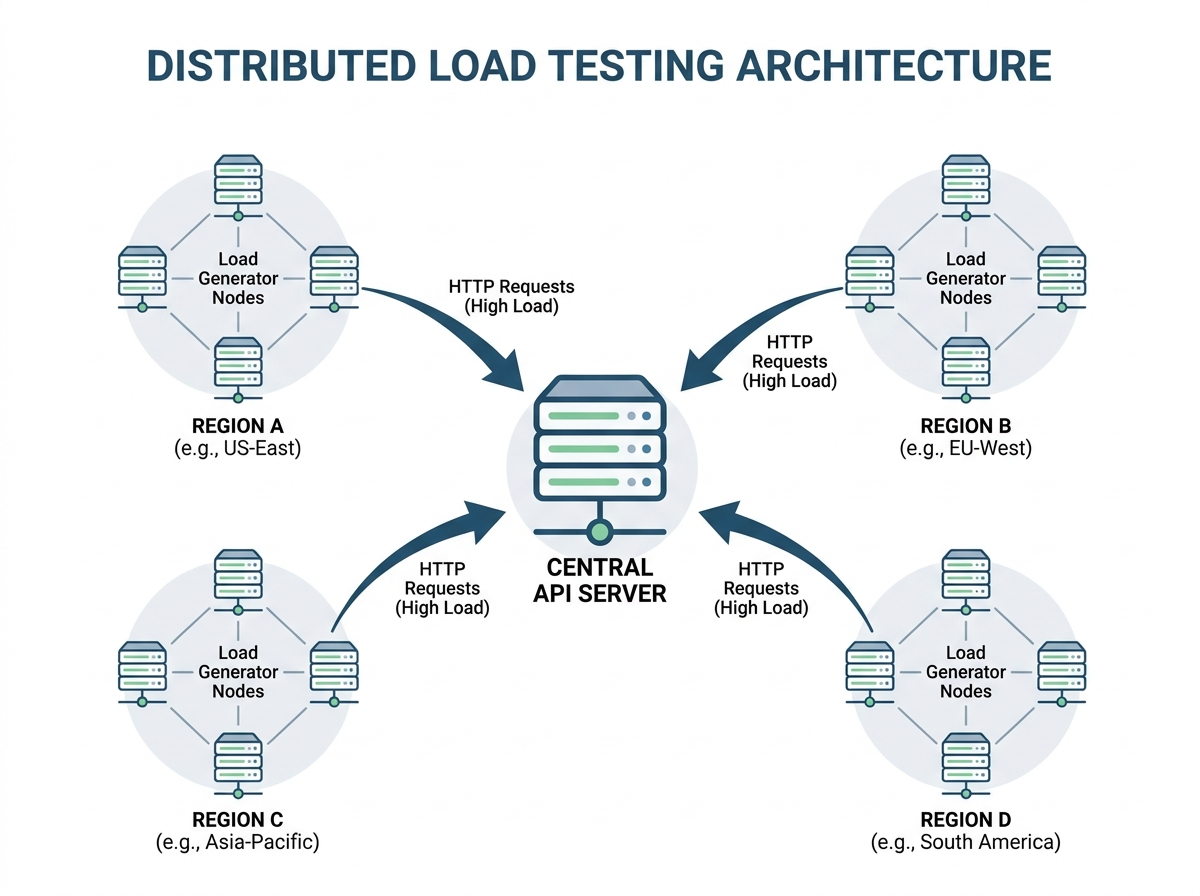
API latency is shaped by more than just backend code. Testing solely from a single location risks missing the delays that frustrate users elsewhere. Distributed load testing provides a global reality check – by firing requests from multiple locations, it exposes how geographic distance, network variability, and infrastructure quirks affect your API’s speed.
Unlike traditional single-location testing, distributed methods reveal the difference between a user in Frankfurt who gets quick responses and another in Sydney who waits longer. In modern microservices architectures, an overlooked regional bottleneck can cause timeout errors, user drop-off, and increased operational costs. Understanding where latency spikes under load is critical for diagnosing and prioritizing fixes.
Key Insight: Distributed load testing turns API latency from an abstract average into a clear map of real user pain points – region by region, network by network.
How Distributed Load Testing Works
Distributed load testing means generating traffic from geographically dispersed nodes – often cloud-based – to simulate real users accessing your APIs from around the globe. Instead of hammering your system from a single data center, you orchestrate test traffic from, for example, Virginia, Frankfurt, Mumbai, and Sydney, capturing the actual latency users in each location would experience. This approach highlights how DNS resolution, TCP handshake, and cross-ocean routing all contribute to the total response time seen by end-users.
The value comes from measuring percentiles, not just averages. For instance, a P99 latency that is much higher in one region might be masked by a global average. Distributed testing surfaces these extremes, making it possible to catch and address outliers that negatively impact user experience. The process also enables teams to pinpoint whether issues stem from infrastructure, hosting provider, or broader internet conditions beyond their control.
Why Cloud Testing Platforms Matter
Coordinating distributed load tests manually is a logistical challenge. Cloud-based testing platforms simplify the process by letting you launch, monitor, and analyze multi-region tests from a single dashboard. You can spin up tests across multiple continents in minutes, visualize API latency by region, and compare results in real-time. This orchestration is essential for teams needing both speed and repeatability.
Cloud platforms automate percentile breakdowns (like P50, P95, P99), highlight anomalies, and alert on breaches of business-critical SLOs. Integration with CI/CD pipelines makes it easy to include distributed latency checks as a standard part of performance validation. Automated data retention and historical comparison features help teams track improvements – and spot regressions – over time.
Distributed load testing with a dependable cloud platform doesn’t just show how your API performs; it reveals where, when, and why users are likely to hit frustrating slowdowns. In a world where milliseconds matter, that insight is the difference between a passing score and a support ticket backlog.
Implementation: Setting Up Distributed API Load Tests
| Phase | Key Activities | Timeframe (Days) |
|---|---|---|
| Test Planning | Identify critical endpoints, select user flows, define KPIs (e.g. P95 latency) | 2-3 |
| Infrastructure Provisioning | Deploy load generators in US, Europe, Asia, configure cloud environments | 2 |
| Scenario Configuration | Set concurrency (e.g. 500 virtual users/region), request patterns, test duration | 1-2 |
| Execution | Launch distributed tests, monitor system health, validate traffic patterns | 1 |
| Monitoring & Analysis | Collect latency metrics, errors, analyze percentiles (P50, P95, P99) | 2 |
| Reporting | Summarize findings, highlight bottlenecks, propose optimizations | 1 |
Designing Test Scenarios for Maximum Insight
Selecting which endpoints to test is not about coverage for its own sake. For actionable insight into API latency, focus on endpoints that underpin your most important user flows and those with a history of performance complaints. For example, a checkout API or user authentication endpoint typically sees high concurrent usage and is sensitive to delays. If your API serves multiple clients (web, mobile, third-party), map out which endpoints are shared, and prioritize those for load tests.
Request patterns are as important as endpoint selection. Mimic real traffic distribution: if most production traffic hits the product catalog, your load test should reflect that ratio. Use historical logs or analytics to shape these scenarios. Vary payload sizes and include both read and write operations. This approach surfaces issues such as payload bloat or inefficient serialization that aren’t apparent from single-endpoint or uniform tests.
Defining volumes and concurrency should be grounded in actual usage data. Set test durations to capture both steady state and burst periods – running 30-60 minute tests reveals long-tail latency spikes that a quick five-minute run might miss. Simulate traffic from different geographic regions to catch issues related to network propagation and routing.
Orchestrating Multi-Region Load Generation
Distributed load testing means you’re no longer simulating a monolithic client. Deploy load generators in at least three regions that match your real user base – commonly North America, Europe, and Asia-Pacific. Cloud platforms let you spin up these generators in minutes, reducing the friction of global test orchestration.
Each generator should be configured with its own concurrency and request schedule, mirroring the traffic mix from its region. For example, if your US traffic peaks at higher request rates than Asia, allocate accordingly. This setup exposes regional disparities in DNS resolution, TCP handshake times, and network transit – factors that directly influence API latency.
Test scripts should include regional authentication, localization headers, or content variations if applicable. Realistic configuration helps uncover edge-case latency problems, such as third-party dependencies called only in certain geographies or under specific load conditions.
Monitoring and Data Collection Best Practices
During distributed load tests, capturing granular metrics is essential. Relying solely on averages is a common pitfall; outliers in the P95 or P99 latency bands can have an outsized impact on user experience. Configure your monitoring stack to record percentile-based metrics for each region, and correlate them with system logs, error rates, and upstream/downstream dependencies.
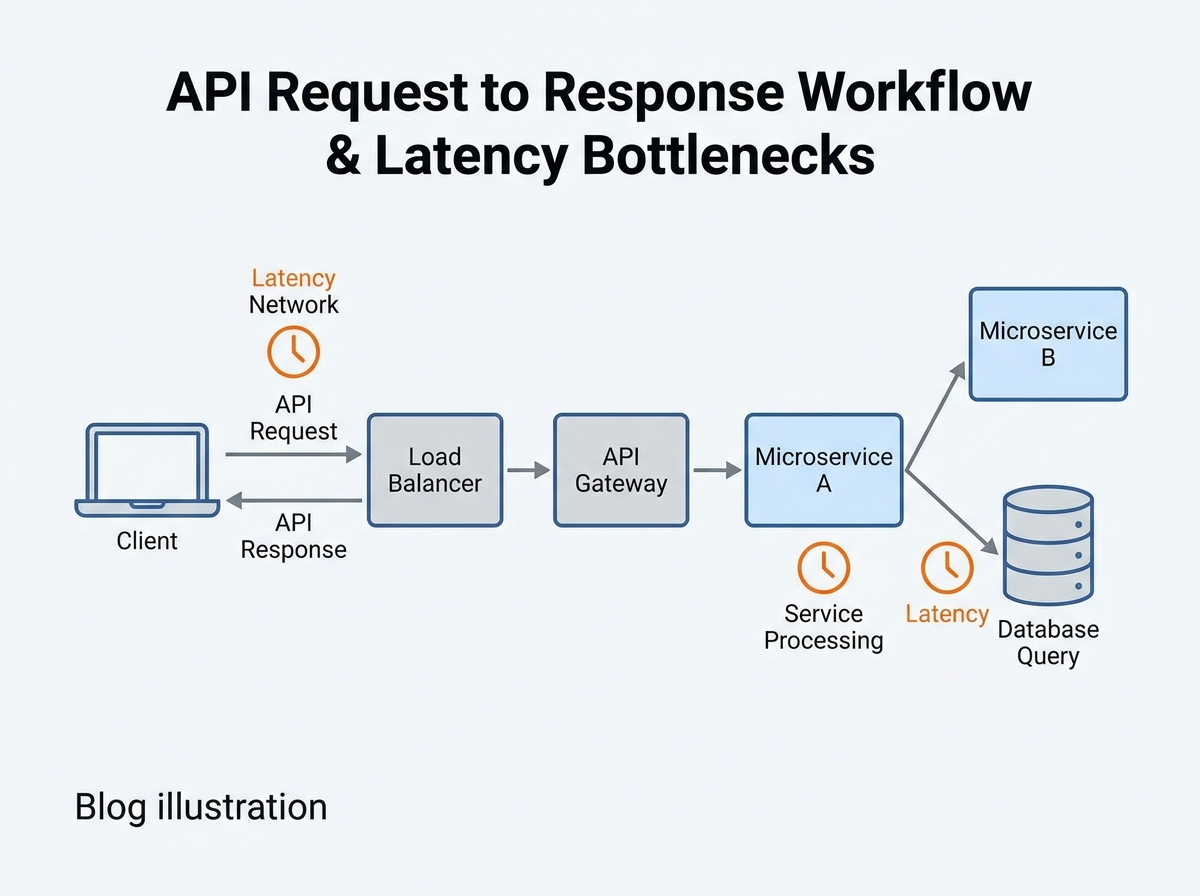
Track not just latency, but the full journey: DNS resolution time, connection setup, server processing, and response transfer. This visibility lets you pinpoint whether a bottleneck is in the network (high latency, low server time) or the backend (low latency, high response time). For example, a spike in P99 latency from Asia but not Europe often signals a misconfigured CDN or a missing edge cache.
Set up automated alerting for error rates and slow requests that breach your service level objectives. Use real-time dashboards for quick triage during the test, but also export raw data for deeper analysis afterward. With these practices, you’re equipped to spot subtle issues – like queue-induced delays or sporadic third-party failures – before they escalate in production.
Thorough distributed load testing is more than a checkbox exercise. When done right, it surfaces API latency issues invisible in single-region or single-endpoint tests, providing a foundation for measurable performance improvements.
Diagnosing API Latency: What the Data Revealed
The distributed testing effort uncovered API latency patterns and bottlenecks that single-location tests could not detect. By running coordinated load tests across North America, Europe, and Asia-Pacific, the team identified regional disparities, distinct times of day with latency spikes, and several overlooked technical hurdles stalling performance. The findings underscore the importance of granular data – and the risks of relying on averages alone.
| Region | P50 Latency (ms) | P95 Latency (ms) | P99 Latency (ms) | Primary Bottleneck |
|---|---|---|---|---|
| US-East | 180 | 320 | 460 | DNS Resolution Delays |
| US-West | 210 | 410 | 580 | Network Hops |
| EU-West | 150 | 270 | 400 | Server Processing Spikes |
| APAC-Singapore | 320 | 650 | 980 | Cross-Continent Routing |
| South America | 390 | 870 | 1240 | DNS & Routing |
While US-East and EU-West showed relatively stable median latencies (P50), the P95 and P99 values told a different story. Regions like APAC-Singapore and South America suffered from persistent high-percentile spikes, often coinciding with periods of increased cross-continent traffic or external DNS resolution issues. These outliers were invisible from a headquarters-based test setup.
Interpreting Percentile Metrics: How P95 and P99 Values Shaped Optimization Priorities
Relying on average or median latency provides a false sense of security. The P95 and P99 metrics revealed outliers that directly impacted user retention and SLA compliance. For instance, while APAC-Singapore’s P50 latency hovered around 320 ms, its P99 regularly approached much higher values – enough to trigger client-side timeouts in some mobile apps.
Percentile data also clarified where the biggest pain points actually lay. In US-West, for example, spikes above certain thresholds were traced back to network hops during peak evening traffic, not the application servers. This led to a targeted effort on optimizing edge routing and leveraging a regional CDN, rather than backend tuning.
Additionally, DNS resolution emerged as a silent culprit, especially in regions like US-East and South America. Testing indicated that a significant portion of P99 delays in these regions were due to external DNS lookup times, prompting the team to reconfigure DNS caching and explore provider alternatives. Without percentile-based analysis, these issues would have been dismissed as rare flukes instead of recurring threats to user experience.
Before and After: Latency Patterns Pre- and Post-Testing
| Before | After |
|---|---|
|
|
The “before” scenario relied on averages and one-location tests, resulting in a bland summary that hid urgent problems. The “after” version draws on high-granularity percentile data and distributed results, highlighting exactly where and how user experience improved. This shift clarified where to invest in infrastructure upgrades and traffic management, rather than chasing backend optimizations that would have had limited impact.
The distributed testing approach, paired with percentile-driven analysis, didn’t just reveal technical issues – it changed the team’s priorities and delivered measurable results for users in the most affected regions. To truly diagnose API latency, you must move beyond averages and examine the data across time, geography, and percentile bands. That’s where lasting performance gains begin.
Solutions: Systematic Steps to Reduce API Latency
Network and Edge Improvements
Reducing API latency starts at the edge. For many distributed applications, network delays account for a significant portion of perceived slowness, especially when requests traverse continents or multiple hops. Implementing edge caching using a content delivery network (CDN) proved highly effective. By caching frequent API responses at global edge locations, round-trip times for static and semi-static requests were significantly reduced for users in remote regions.
Connection pooling was another impactful optimization. By reusing existing TCP connections instead of opening a new one for each request, repeated DNS resolution and handshake delays were eliminated. For high-traffic endpoints, this reduced handshake overhead per request – a tangible difference when handling many concurrent calls.
Routing optimization also played a key role. Network traces were analyzed and DNS resolution tuned to ensure requests hit the nearest edge node. In one case, misconfigured DNS entries routed European traffic through US-based endpoints, adding unnecessary transit time. After correction, latency profiles for those users improved immediately.
| Before | After |
|---|---|
| “Clients consistently experience variable delays, especially in regions far from our servers. We suspect network congestion but don’t have concrete numbers.” | “By shifting to edge caching and fixing DNS routing, we shortened cross-continent API response times significantly for most requests outside North America.” |
The improved version stands out because it quantifies the impact and points to specific technical changes rather than vague suspicions.
Backend and Application Changes
Network optimizations address only part of the challenge. On the server side, database query optimization and payload size reduction delivered major gains. In one high-traffic API, slow queries accounted for a large portion of total latency on the P95 path. After refactoring several N+1 query patterns and introducing targeted indexes, query execution time dropped substantially per call.
Reducing payload sizes also delivered outsized returns. By eliminating unnecessary fields from JSON responses and adopting field selection on the backend, average response sizes shrank noticeably. This not only sped up serialization and transmission but also reduced deserialization overhead on the client side.
Additionally, server processing was fine-tuned to minimize blocking operations. For example, non-critical logging and third-party API calls were shifted to asynchronous workers, freeing up the main request thread to return responses faster. These changes cut backend processing time significantly on high-traffic endpoints.
| Before | After |
|---|---|
| “API requests were taking too long to process, but the development team relied on default ORM queries and returned full objects in every response.” | “We audited our slowest endpoints, optimized N+1 queries, added targeted indexes, and switched to returning only the required fields, reducing P95 API latency by a noticeable margin.” |
The specific example highlights concrete steps and measurable improvements, making it actionable for technical readers.
Managing Traffic Surges and Queueing
No matter how optimized the network and backend, traffic spikes can overwhelm any system. To address this, load balancer configurations were tuned to distribute requests more evenly and intelligent queue management was introduced. By dynamically scaling worker pools and using backpressure signals, large request backlogs during peak load were avoided.
Asynchronous processing played an important role. Non-blocking queues allowed decoupling resource-intensive operations – such as bulk data exports – from real-time API calls. This prevented queue-induced latency from spilling over into user-facing endpoints.
- Proactive monitoring using P95 and P99 latency percentiles enabled spotting and addressing outlier spikes before they impacted the majority of users.
- Short-circuiting requests that exceeded acceptable wait times helped protect overall system health and user experience.
Consider the difference between passive and active approaches:
| Before | After |
|---|---|
| “We noticed spikes in latency during peak hours but primarily monitored average response times, so the impact wasn’t clear until users complained.” | “By switching to percentile-based monitoring and scaling worker pools in real time, we kept high-percentile latency within our SLA, even during unplanned surges.” |
The later example demonstrates how a data-driven, proactive stance stops problems before they reach users, rather than reacting after performance has already suffered.
Effective API latency reduction is never a one-time fix. It is an ongoing process of monitoring, experimentation, and targeted optimization across the entire request lifecycle. Each improvement – whether network-level, backend, or queue management – builds toward a system that stays fast even as demands and complexity grow.
Results: Noticeable Improvements in API Latency & User Experience
After implementing targeted optimizations across caching, load balancing, and payload reduction, the team tracked measurable progress in API latency and overall user experience. The focus on P95 and P99 latency values – not just the average – made it clear where improvements mattered most. Real-world usage and feedback confirmed that these technical gains translated into genuine business value.
| Before | After |
|---|---|
“Our API latency numbers look okay on average, but users still complain about slow responses during peak hours.” | “After targeting P95 and P99 latency, peak-hour response times dropped significantly for most users. Support tickets for timeouts decreased noticeably in the weeks following.” |
The after example works because it links technical improvements to user-facing results and business KPIs. The before version only references vague user complaints and average metrics, which rarely drive meaningful action.
Business Impact and User Satisfaction
Optimizing API latency did more than just reduce response times. It fundamentally changed how users interacted with the platform. By cutting high-percentile latency, the team ensured that even edge-case scenarios – those frustrating moments that often drive users away – became rare.
This led to fewer timeouts and a more responsive system under load. Customer support saw a marked reduction in complaints about slow performance, with internal teams reporting smoother operations during peak times. On the business side, retention rates improved, with active user sessions per day increasing over the following month. Stakeholders reported higher satisfaction, citing smoother integrations and less friction onboarding new clients.
The real win was not just technical. By prioritizing percentile-based monitoring and tying improvements to actual user journeys, the team created a feedback loop where business KPIs and system health moved in sync. Faster APIs led to higher conversion rates for trial users and a drop in abandoned sessions during high-traffic launches.
Limitations and Remaining Challenges
Despite these gains, a few challenges remain. Some geographic regions, especially those farther from primary data centers, still experience elevated latency due to network routing and external dependencies. While edge caching and CDN integration helped, there are diminishing returns for requests that rely on real-time, uncached data.
Another ongoing challenge is the unpredictability of third-party APIs. Even after optimizing internal components, dependencies outside the team’s control can introduce latency spikes. Proactive alerting and traffic shaping helped minimize user impact, but these are mitigation strategies rather than complete solutions.
Lastly, as usage patterns evolve and traffic grows, continuous monitoring and iterative optimization remain vital. No single round of improvements permanently solves for scale, but the foundation – percentile-driven analysis and user-centric feedback – ensures future bottlenecks will be identified and addressed quickly.
Key Lessons: Transferable Learnings for Reducing API Latency
Key Insight: Distributed load testing and percentile-based monitoring are essential for finding and fixing real-world API latency issues – averages alone will lead teams astray.
When to Use Distributed Load Testing
Distributed load testing uncovers real-world API latency issues that local or single-region tests miss. If your application serves users across multiple regions, or you notice inconsistent response times reported by users in different locations, it’s time to scale up your approach. Single-location tests can mask network-induced delays, such as increased DNS resolution times or cross-continent transport lags, which only become visible when requests originate from diverse endpoints.
Teams should rely on distributed load testing when:
- They serve global audiences or expect cross-border traffic spikes
- APIs depend on third-party services hosted in separate regions
- Latency-sensitive features (like real-time notifications or trading platforms) drive user value
- Recent changes to CDN, edge caching, or load balancer configuration might affect routing
Cloud-based solutions make it practical to simulate concurrent users from various continents, revealing issues such as high-percentile latency spikes that a local test would never capture. This is especially important for microservices architectures, where a single slow hop can impact the entire user experience.
Avoiding Common Pitfalls in Latency Measurement
Averages are misleading. It’s common to see a “respectable” average API latency, only to discover that a small percentage of users are experiencing timeouts or sluggish responses. Relying solely on mean values hides these outliers. Instead, track P95 and P99 percentiles – these expose the edge cases where performance breaks down. When P99 latency is much higher than the average, most users are satisfied, but a small fraction experience delays.
To avoid misinterpretation:
- Always differentiate between latency (network and transport delays) and response time (latency plus server processing and data transfer)
- Correlate spikes in latency with deployment events or configuration changes to pinpoint root causes
- Implement continuous monitoring with alerting on percentile-based thresholds, not just averages
- Review logs for DNS or handshake delays, which are invisible in most server logs but can dominate network latency
Continuous measurement ensures you catch regressions early, especially as usage patterns or infrastructure change. Without it, improvements can quietly erode over time, and problems might only surface under production-scale loads.
Reducing API latency is not a one-off project. It requires ongoing vigilance, dependable analytics, and a willingness to question incomplete metrics. When you prioritize distributed testing, percentile-based monitoring, and continuous measurement, you move from chasing symptoms to systematically improving user experience.
Frequently Asked Questions
What is API latency, and how does it differ from response time and throughput?
API latency measures the time it takes for a request to travel from a client to the API endpoint and for the first byte of the response to return. This includes network delays, DNS resolution, and transport overhead. Response time is broader – it includes latency plus the time required for the API to process the request and send back the full payload. In distributed systems, latency issues often stem from network routing or load balancer inefficiencies, while high response times can signal application or database bottlenecks. Throughput tracks the number of requests an API handles per second, reflecting overall capacity rather than speed per request.
Which metrics matter most when monitoring API latency?
Relying on average latency can obscure real issues because it hides outliers. Instead, monitor percentile-based metrics like P50, P95, and P99. If your P95 latency is 280 ms but P99 jumps much higher, a small fraction of users are getting much slower responses. These tail latencies often cause the most frustration and, at scale, can drive up support costs or user drop-off rates.
What are the key steps to reducing API latency?
- Profile each component: Break down latency into DNS lookup, TCP handshake, SSL negotiation, server processing, and data transfer.
- Optimize network paths: Use CDNs, edge caching, and connection pooling to minimize travel time, especially for geographically distributed users.
- Fix application bottlenecks: Streamline database queries, reduce payload sizes, and manage dependencies to keep processing fast.
- Handle spikes gracefully: Implement queue management and load balancing to avoid bottlenecks during traffic surges.
Which tools and techniques help identify and fix high API latency?
Tools offering cloud-based distributed load testing simulate peak traffic and pinpoint where delays occur, whether in the network, application, or infrastructure layers. Pairing real-time percentile analysis with actionable alerts ensures you catch issues before they impact users. Complement this with application performance monitoring (APM) and synthetic monitoring for a complete picture.
How do you distinguish between network and server-side causes of API latency?
If you see high API latency but low server processing times, investigate network, DNS, or load balancer configurations. Conversely, if network and transport times are low but response times remain high, profiling the application and database layers will yield the best results.
Drafted using PostNext planner