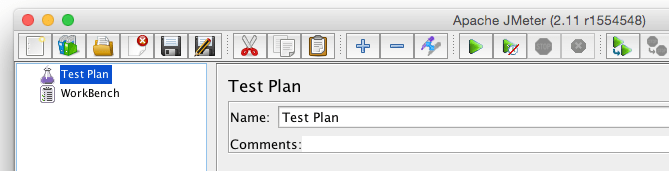
Overview
We are going to present how to use Apache JMeter (open source load testing tool) in order to perform basic load and stress testing on your web application. We are going through each step and show how to use JMeter’s GUI (graphical user interface) in order to build a test plan, configure load tests, run test and inspect the results.
Apache JMeter is an open source Java application, so it can run on any OS (operating system) which supports JAVA 6 or later. JMeter is a load testing (performance testing) tool designed to run tests on any given URI endpoint, with configurable number of concurrent clients (users) and other useful test configurable metrics and inspect results. Test results can be viewed in charts, tables or can be exported in CSV or XML formats.
Is Your Infrastructure Ready for Global Traffic Spikes?
Unexpected load surges can disrupt your services. With LoadFocus’s cutting-edge Load Testing solutions, simulate real-world traffic from multiple global locations in a single test. Our advanced engine dynamically upscales and downscales virtual users in real time, delivering comprehensive reports that empower you to identify and resolve performance bottlenecks before they affect your users.
Prerequisites
In order to start using JMeter you need a machine that you can install and run JMeter on. By default JMeter runs as a GUI application, which requires more resources than a command line based application. In order to perform the load tests faster and without bottlenecks you can run JMeter in the non-graphical mode (details on how to start JMeter in non-graphical mode in the next post)
Please note that results can differ based on the web server where the web application is hosted. Factors that we need to take into account are:
- system resources CPU, RAM Memory of the web server
- system resources CPU, RAM Memory of the machine where JMeter is installed (from where the tests are executed)
- location of the web server between the load test injector and the web server where the application is hosted (which affects the latency of the tests – use a cloud load testing tool in order to easily run load tests from different locations)
Install JMeter
Apache JMeter is very easy to install. Depending on the OS, there are different ways on how to do this.
In order to run JMeter, here is what you need to install:
Think your website can handle a traffic spike?
Fair enough, but why leave it to chance? Uncover your website’s true limits with LoadFocus’s cloud-based Load Testing for Web Apps, Websites, and APIs. Avoid the risk of costly downtimes and missed opportunities—find out before your users do!
- Oracle JAVA or OpenJDK (6 or later)
- Apache JMeter (2.11 or 2.13)
Make sure that after installing JAVA you add it to the $PATH environment variable. Here you can find how to add the JAVA to the $PATH environment variable for every OS .
[emaillocker id=”1703″]
To start JMeter on Windows OS you need to go to the folder where you unarchived JMeter binaries and just run $JMETER_HOME/bin/jmeter.bat batch file. Please see here how you can run JMeter on Mac.
So, once all is installed and JMeter is running you can start creating your first load test. For this demo we are going to use Apache JMeter 2.11 on Mac.
Build Test Plan
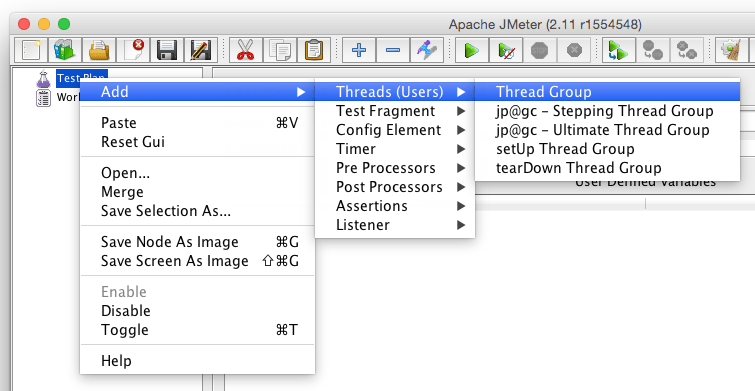
In order to create a load test, add a Thread Group, in order to configure the thread properties (load test configuration):
Start by adding a Thread Group to your Test Plan by following the below steps:
LoadFocus is an all-in-one Cloud Testing Platform for Websites and APIs for Load Testing, Apache JMeter Load Testing, Page Speed Monitoring and API Monitoring!
- Select the Test Plan on the left side, and Right-click it
- Hover to Add -> Threads (Users) -> Thread Group
- Click on Thread Group
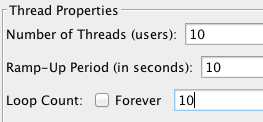
Configure the following properties which will be used to run your load test:
See more details
- Number of threads (users): The number of concurrent clients/users JMeter is going to simulate. Set it to 10.
- Ramp-up Period: How long JMeter should take to get all the threads started. Set it to 10.
- Loop Count: Number of times to perform the test case. Set it also to 10.
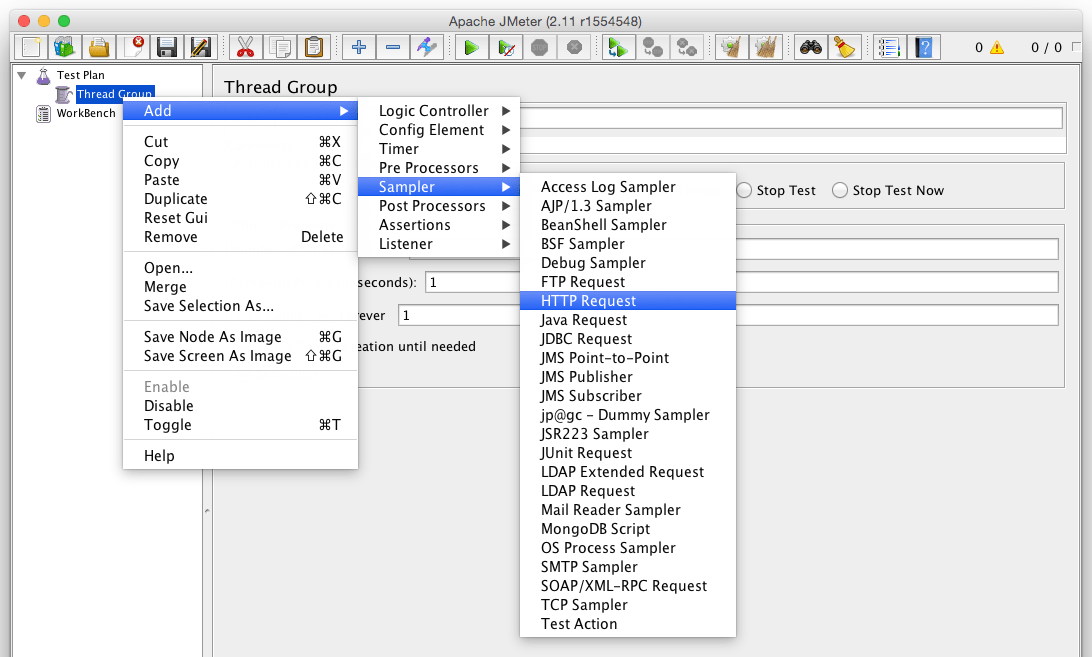
Now we add a HTTP Request Sampler which represents an individual request made by each thread.
To do this Add a HTTP Request Sampler to your Thread Group by following the below steps:
- Select on the Thread Group on the left side, then Right-click it
- Hover (mouse over) to Add -> Sampler -> HTTP Request
- Click on HTTP Request
In the HTTP Request Sampler, under Web server, set the URL in the Server Name or IP field (website URL i.e www.example.com or public IP address).
Check here how to use a CSV Data Set in your JMeter test.
If you want to execute more than one HTTP Request by each thread (user), simply duplicate the HTTP Request Sampler and update the Server Name or IP. Here are the steps to duplicate the HTTP Request Sampler.
- Select HTTP Request Sampler, then Copy it (Cmd/Control + C)
- Select Thread Group, then Paste it (Cmd/Control + V)
Note: In our JMeter test we will continue to use only one HTTP Request Sampler.
Add HTTP Cookie Manager (optional)
If your web application uses Cookies, JMeter allows to add cookies which will be sent with each HTTP request. You can do that simply by adding the HTTP Cookie Manager by following these steps:
- Select Thread Group, then Right-click it
- Hover (mouse-over) Add -> Config Element -> HTTP Cookie Manager
Add HTTP Header Manager (optional)
In case you need to send specific headers with every request, JMeter allows to add headers by adding the HTTP Header Manager by following these steps:
- Select Thread Group, then Right-click it
- Hover (mouse-over) Add -> Config Element -> HTTP Header Manager
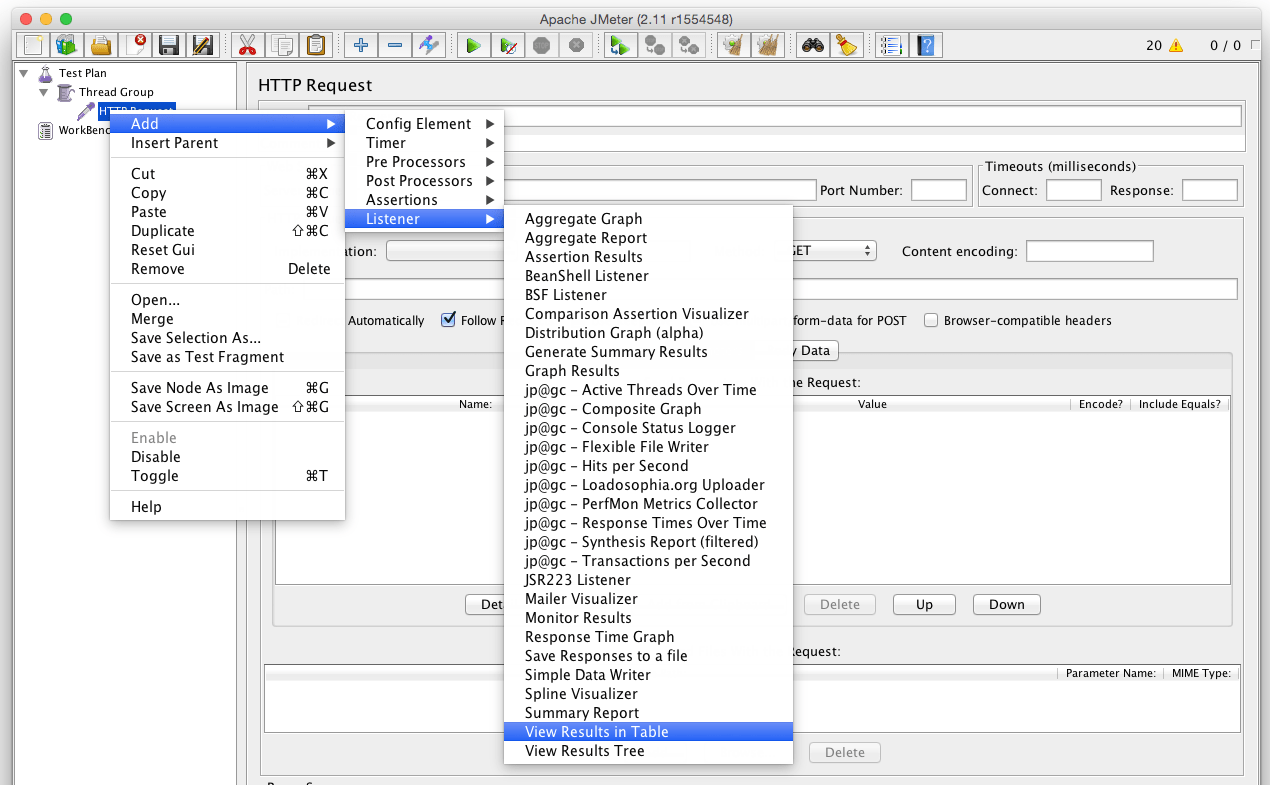
Add View Results in Table
You need to use JMeter’s Listeners in order to view the output of a load or stress test. One of the most used Listeners is the View Results in Table, which we’ll use in the post and here is how to add it to your Test Plan:
- Select Thread Group, then Right-click it
- Hover (mouse-over) Add -> Listener -> View Results in Table
Run your Test Plan
After installing everything needed in order to start Apache JMeter and after configuring the Test Plan, you can start running your test.
First, save the test plan with the .jmx extension.
Run the test by pressing the green arrow button in the toolbar or by pressing Cmd/Control + R keys.
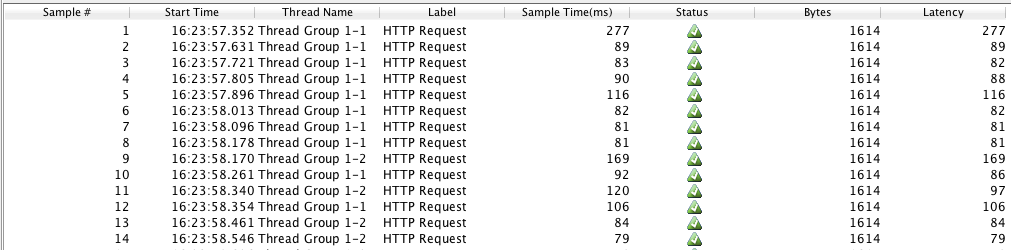
You’ll starting seeing results in the View Results in Table, important columns are Sample Time (ms), Status, Bytes and Latency. To understand better the errors and responses you can check out this post.
- Sample Time (ms): Represents the number of milliseconds that the server took to serve the request (response + latency)
- Latency (ms): Represents the number of milliseconds that elapsed between when JMeter sent the request and when an initial response was received
At the bottom of the View Results in Table, you can see the Average Sample Time in ms and the Standard Deviation.
According to the results, after running 100 samples the Average Sample Time in milliseconds was 133 ms. Latency is going to be affected by the geographic distance between the place from where the request is made to the place where the web server is hosted.
So, no error occurred on our test when running the 10 requests X 10 threads (users) = 100 samples, and the Sample Time was low 133 ms.
Increase the Load by changing the Threads (users) values
In order to make our load test more realistic, let’s change the Threads (Users) field to 300.
Clear the previous JMeter results by pressing Cmd/Control + E or by clicking the Clear icon in JMeter’s toolbar.
Start the test, and check the results again. As you can see, the Sample Time increased almost by 50% to 178 ms, however no errors occurred while running our load test with JMeter.
Also, while running the tests, server side monitoring will be helpful, looking at metrics like CPU or Memory. In Windows you can monitor these stats by opening the PerfMon tool or in Linux by typing the top command in terminal.
You can extend the load test up to 1000 threads (users), to check how your system behaves and discover potential bottlenecks, memory leaks, performance issues. LoadFocus.com is a cloud load testing service and you can run load tests with thousands of threads (users).
Conclusion
JMeter is a useful load testing tool, which helps you find load testing issues, discover bottlenecks and increate performance of your web application. Feel free to experiment different values for the load test in order to understand how your web server behaves under heavy load. In order to add more plugins to your default JMeter installation, you can check the JMeter plugins add-ons or check here how to add JMeter plugins to JMeter.
[/emaillocker]
In order to run load tests with thousands of threads (users) and to run load tests from different world locations, you can use LoadFocus.com which offers a cloud load testing service, easy to use, which keeps all your tests and test runs in the history automatically.