Load Testing Tools: Choosing Between Scalpels and Swiss Army Knives
Precision or Versatility: The Right Instrument for the Job
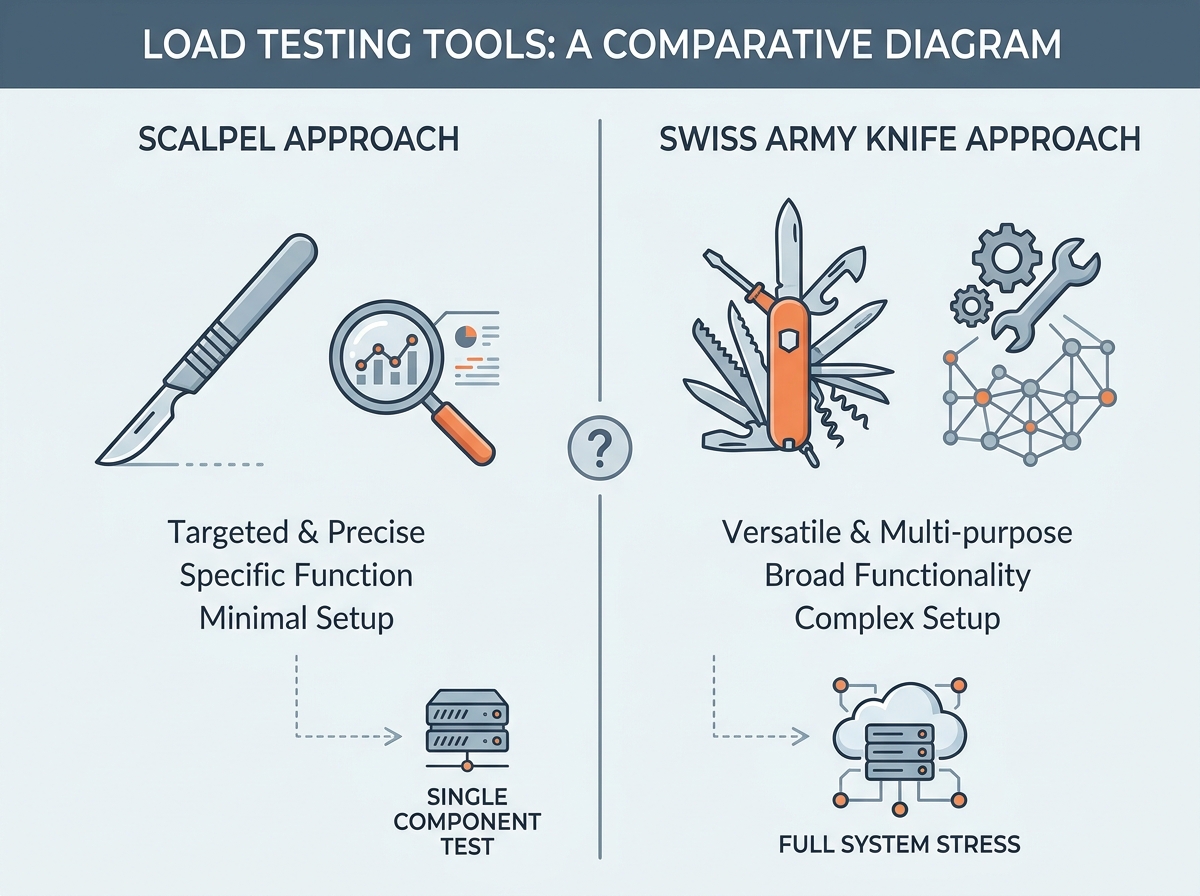
Selecting load testing tools for your CI/CD pipeline is a lot like picking between a scalpel and a Swiss Army knife. A scalpel – the focused, specialized solution – excels at one job with surgical accuracy. Think of Apache JMeter or Gatling: these tools are designed for deep, targeted testing, offering powerful scripting and low-level protocol support. They let you dial in precise scenarios and slice through performance bottlenecks with fine control. For example, Gatling’s test-as-code paradigm is perfect for teams fluent in Scala or JavaScript who need detailed, reproducible tests embedded directly in their codebase.
The Swiss Army knife approach, on the other hand, is embodied by all-in-one platforms like LoadFocus or BlazeMeter. These tools bundle cloud scalability, browser-based management, and built-in analytics. When your team needs to handle distributed testing, global traffic profiles, and real-time insights, a versatile platform saves time and reduces operational friction. Instead of managing scripts and infrastructure yourself, you tap into a suite of features – traffic simulation, API monitoring, and AI-powered analysis – all in one place.
Is Your Infrastructure Ready for Global Traffic Spikes?
Unexpected load surges can disrupt your services. With LoadFocus’s cutting-edge Load Testing solutions, simulate real-world traffic from multiple global locations in a single test. Our advanced engine dynamically upscales and downscales virtual users in real time, delivering comprehensive reports that empower you to identify and resolve performance bottlenecks before they affect your users.
Why the Right Tool Matters in CI/CD
The stakes are real. Performance failures caught late in CI/CD can torpedo a release and inflate remediation costs. Industry experts have pointed out that integrating load testing early in the pipeline turns performance into a shared responsibility, not a firefight at the end. When the wrong tool is chosen – say, an open-source tool that requires heavy scripting when your team needs fast, visual test setup – testing either gets delayed or skipped altogether. Conversely, overkill platforms can slow down nimble teams with unnecessary features and cost.
- Specialized tools (scalpels) excel when your requirements are clear and your team has technical depth. You want scriptability, low-level control, or integration with language-specific workflows.
- All-in-one platforms (Swiss Army knives) shine for teams seeking turnkey scalability, cloud-based management, and built-in analytics with minimal setup friction.
Ultimately, the right load testing tool is the one that fits your team’s workflow, technical expertise, and the complexity of your performance requirements. As development cycles tighten and expectations for uptime only grow, matching your tooling to your real needs is not a luxury – it’s a prerequisite for delivering software that doesn’t buckle under real-world pressure.
Quick Comparison: Key Dimensions of Leading Load Testing Tools
Side-by-Side: Which Load Testing Tool Fits Your Pipeline?
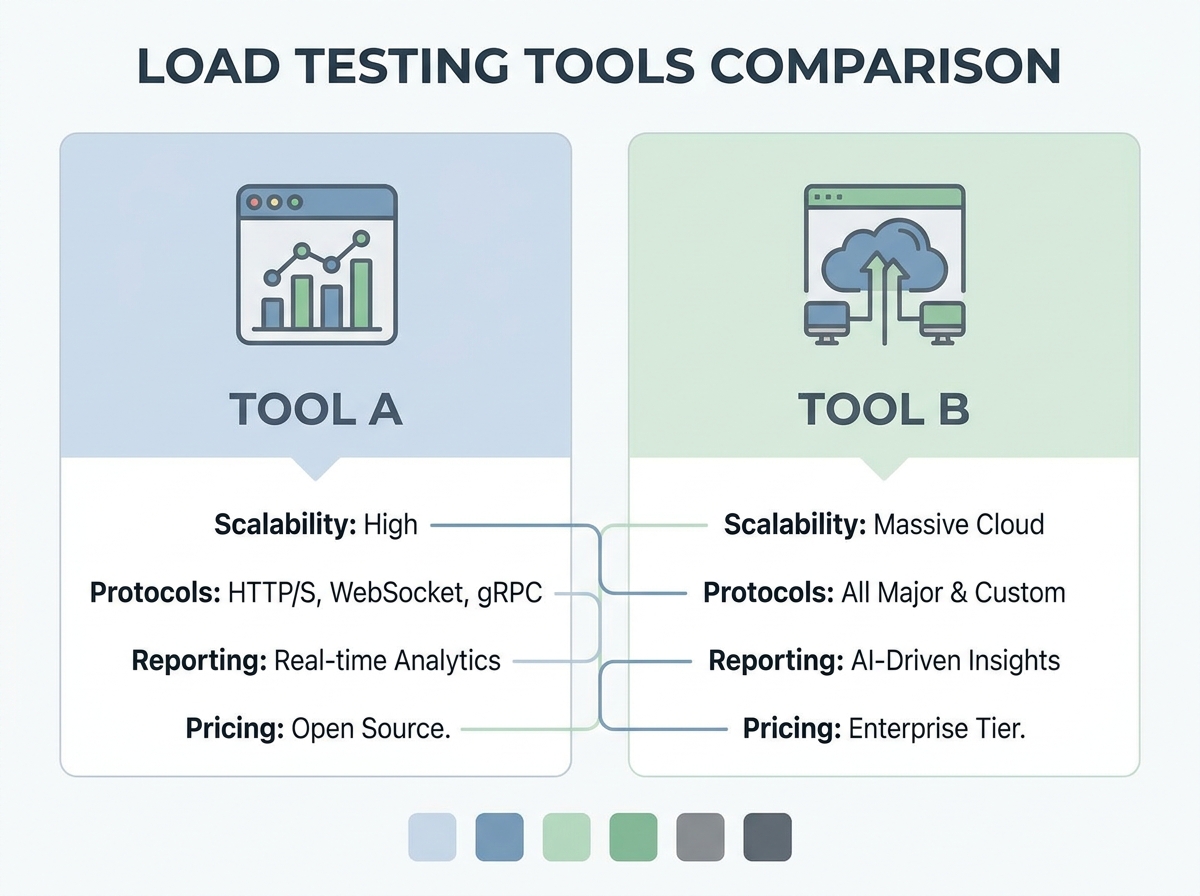
Choosing the right load testing tool often comes down to how well it fits into your development and deployment workflows. Teams are looking for solutions that not only simulate massive traffic but also integrate smoothly with existing CI/CD setups, support the right scripting language, and scale on demand. Below is a direct comparison of six popular tools – LoadFocus, JMeter, k6, Gatling, Locust, and Artillery – across six critical dimensions that matter most for modern engineering teams.
Think your website can handle a traffic spike?
Fair enough, but why leave it to chance? Uncover your website’s true limits with LoadFocus’s cloud-based Load Testing for Web Apps, Websites, and APIs. Avoid the risk of costly downtimes and missed opportunities—find out before your users do!
| Dimension | LoadFocus | JMeter | k6 | Gatling | Locust | Artillery |
|---|---|---|---|---|---|---|
| CI/CD Compatibility | Native integrations with major CI/CD platforms; REST API support | Plugins for Jenkins, Bamboo, GitLab; extensive community scripts | First-class CLI & API; GitHub Actions, GitLab, Jenkins support | Jenkins, Bamboo, GitLab integrations; scripting via Scala/JavaScript | Easy CLI triggers; integrates with GitHub Actions, GitLab CI | CLI and API support; npm package for CI flows |
| Scripting Language | Visual builder plus JavaScript support | Java, Groovy, XML (no-code UI for basics) | JavaScript (ES6); TypeScript with extensions | Scala, JavaScript | Python | JavaScript (YAML optional) |
| Cloud / On-Premise | Fully cloud-based | On-premise (self-hosted); commercial cloud via BlazeMeter | Open-source CLI (self-hosted); Grafana Cloud k6 for SaaS option | On-premise; Gatling Enterprise offers cloud | On-premise, with cloud distribution via third parties | On-premise; Artillery Pro offers managed cloud |
| Scalability | Scales to millions of concurrent users globally | High, limited by local hardware or distributed setup | Global cloud distribution; up to hundreds of thousands of VUs | Distributed mode requires setup; Enterprise version scales further | Can scale horizontally with Python nodes; good for thousands of users | Good for moderate scale; Pro supports larger distributed tests |
| Ease of Use | Visual UI, minimal setup, real-time analytics | Steep learning curve; flexible but complex interface | Simple CLI, modern scripting; clear docs | Requires Scala/JavaScript experience; moderate setup | Easy for Python users; fast to start, script-based | Minimal config for simple tests; YAML or JS scripting |
| Observability Integration | Native dashboards, AI-driven insights, API for external observability tools | Plugin support for Grafana, InfluxDB; CSV exports | Direct integration with Grafana and cloud metrics; open API | Built-in reports; integrates with Datadog and other APMs via plugins | Custom exporters; integrates with Prometheus, Grafana | JSON/CSV export; some community plugins for monitoring tools |
What Stands Out in 2026?
Cloud-first solutions like LoadFocus and the managed k6 platform let you scale traffic tests instantly, eliminating the hardware management headache. Scriptability is now the norm – whether you prefer writing tests in JavaScript, Python, or Scala, there’s a tool tailored to your team’s expertise. If observability is a priority, look for platforms with native dashboards or APIs for exporting data to Grafana, Datadog, or Prometheus.
No single tool is perfect for every scenario. You may find JMeter’s ecosystem powerful but cumbersome, or prefer the simplicity of Artillery for smaller projects. The best choice balances integration needs, team skillset, and the scale of your real-world traffic. As load testing matures into a core practice for CI/CD, these dimensions help you focus on what matters most for your pipeline – and avoid surprises when it counts.
Deep Dive: LoadFocus Strengths for DevOps and CI/CD
Key Insight: LoadFocus stands out for providing cloud-native load testing that integrates directly with CI/CD pipelines, delivering actionable analytics in real time without infrastructure maintenance headaches.
Cloud-Native Scalability
Traditional load testing tools often require significant setup, local infrastructure, and manual configuration – obstacles that slow down DevOps teams aiming for rapid iteration. LoadFocus takes a different approach. As an all-in-one cloud testing platform, it provisions and manages distributed load tests automatically, so you never have to spin up or maintain your own test runners.
The value becomes obvious when scaling tests across multiple geographies and endpoints. Instead of handling server clusters or juggling VPN access, you define your test parameters through LoadFocus and its platform orchestrates the infrastructure behind the scenes. This approach mirrors what you see in modern solutions like BlazeMeter or Grafana Cloud k6, but LoadFocus emphasizes ease of use for DevOps teams that want to embed load testing into their daily workflow, not just treat it as a one-off event.
LoadFocus is an all-in-one Cloud Testing Platform for Websites and APIs for Load Testing, Apache JMeter Load Testing, Page Speed Monitoring and API Monitoring!
For example, when you need to simulate a traffic surge from five distinct regions, LoadFocus allocates the necessary cloud resources automatically. There’s no need to pre-provision VMs or track cloud spend per region. This level of cloud-based scalability is crucial as organizations move toward continuous delivery and frequent deployments – where every code change should be tested under realistic, distributed load before it hits production.
The platform’s integration with CI/CD pipelines means you can trigger load tests as part of your automated build process, receiving pass/fail results and performance data right alongside your unit and integration tests. This not only catches bottlenecks early, but it also ensures that performance is always a first-class concern.
Actionable Insights with AI
Raw numbers only tell part of the story. What sets LoadFocus apart is its use of AI-powered analysis to sift through noisy metrics and highlight meaningful performance issues. Instead of skimming through pages of latency graphs, you get targeted insights on where and why bottlenecks happen.
For example, LoadFocus can automatically detect anomalies such as a sudden spike in response times for a particular API endpoint or a pattern of errors that only appears under certain traffic loads. The tool’s analytics engine surfaces these findings directly within your reports, so you’re not left guessing which problem to investigate first. This approach aligns with a broader industry shift: integrating AI-driven observability features reduces the manual effort required to interpret test results, making performance optimization much more efficient.
Importantly, LoadFocus’s real-time dashboards update as tests run, letting you monitor live conditions and abort or adjust runs based on instant feedback. This immediate visibility is critical for fast-moving teams who can’t afford to wait for post-mortem analysis.
Simple Integration with Modern DevOps Workflows
One of the biggest hurdles with legacy load testing tools is integrating them into existing CI/CD pipelines. LoadFocus addresses this with straightforward setup and pre-built connectors for leading automation servers and source code repositories. Whether you’re using Jenkins, GitHub Actions, or another popular platform, you can wire up LoadFocus to run tests on every pull request or deployment with just a few lines of configuration.
This easy integration keeps load testing in sync with the rest of your automation suite – no context switching, no manual triggers, no drift between development and testing environments. Combined with its cloud-native model and AI-driven analytics, LoadFocus fits naturally into the modern DevOps toolkit, making it a strong contender for teams seeking scalable, actionable, and easy-to-integrate load testing solutions.
As organizations raise the bar on performance and reliability, tools that combine cloud scalability, intelligent analytics, and developer-friendly integration will become the standard – not the exception.
JMeter, k6, and Gatling: Open-Source Powerhouses
Key Insight: Open-source load testing tools like JMeter, k6, and Gatling give engineering teams unmatched flexibility and scriptability, but they demand hands-on setup and a willingness to invest in integration and maintenance.
When it comes to load testing tools, the open-source trio of Apache JMeter, k6, and Gatling consistently leads the pack. These solutions offer deep protocol support, powerful scripting capabilities, and active communities – all while keeping costs low for teams with the technical skills to wield them. For organizations prioritizing customization and budget, these tools deliver real control over how, what, and when you test. Yet, each comes with its own strengths, learning curve, and quirks, especially when you want to wire performance testing directly into your CI/CD pipelines.
Apache JMeter: Versatility and Reporting
JMeter’s main draw is its broad protocol support. HTTP, HTTPS, WebSockets, FTP, SMTP, JDBC, and more are covered out of the box, making it the Swiss Army knife of open-source load testing. You can simulate everything from simple web traffic to complex, multi-layered backend interactions. Extensibility is another strength. The plugin ecosystem is vast, letting you add custom samplers, listeners, and even integrate with external systems like InfluxDB or Grafana for real-time dashboards.
Reporting in JMeter is comprehensive. Its HTML reports break down response times, throughput, percentiles, and error rates, making it easy to pinpoint performance bottlenecks. For teams running tests as part of CI/CD, JMeter’s command-line interface and plugins for Jenkins and GitLab CI mean you can trigger tests automatically with each code push. The flip side: JMeter’s XML-based configuration files and GUI-driven scripting have a learning curve, especially for those used to writing tests in code rather than clicking through UIs.
k6: Dev-Friendly Scripting and Cloud Options
k6 takes a “test-as-code” philosophy seriously. Scripts are written in JavaScript, which means developers can use familiar language constructs, modularize tests, and even version-control their scenarios alongside application code. This scriptability goes hand-in-hand with modern DevOps workflows: k6 integrates easily into CI/CD with a simple CLI and Docker images, letting you spin up load tests as part of any automated pipeline.
The cloud ecosystem around k6 has also expanded. While the open-source tool runs locally or on your own infrastructure, commercial cloud services now let you run distributed tests from multiple locations globally, analyze results in real time, and store historical test runs for comparison. This bridges the gap between DIY flexibility and enterprise-grade analytics. k6’s limitation is protocol support – HTTP(S) and WebSocket are strong, but testing non-HTTP protocols requires workarounds or extensions. Still, for API-heavy, cloud-native stacks, k6 punches above its weight.
Gatling: Performance and Java/Scala Support
Gatling is built with high-throughput scenarios in mind. Its asynchronous engine, based on Akka, allows you to generate tens of thousands of virtual users from a single machine without the overhead of thread-per-user models. This makes it a favorite for performance engineers who need to simulate large-scale traffic on resource-limited hardware.
What sets Gatling apart is its test-as-code approach – scripts are written in either Scala or Java. This appeals to backend developers who want performance tests to live alongside application code, use version control, and benefit from type safety. The reporting is visual and detailed, breaking down response time distributions, percentiles, and bottlenecks in clear graphs. Integration with CI/CD is straightforward via its CLI and plugins, though teams unfamiliar with the JVM ecosystem may face a steeper ramp-up.
| Tool | Script Language/Style | Protocol Support | Community & Plugins | CI/CD Integration | Typical Use Case |
|---|---|---|---|---|---|
| JMeter | GUI/XML, Groovy for scripting | HTTP, HTTPS, FTP, SMTP, JDBC, WebSockets, more | Extensive, mature plugin library | CLI, Jenkins, GitLab CI plugins | Complex protocol mix, legacy systems |
| k6 | JavaScript (test-as-code) | HTTP, HTTPS, WebSockets | Growing, active GitHub community | CLI, Docker, GitHub Actions | Modern APIs, cloud-native apps |
| Gatling | Scala or Java (test-as-code) | HTTP, HTTPS, WebSockets | Focused, strong on core features | CLI, Jenkins plugin | High-throughput, JVM teams |
Cost-effectiveness is hard to beat. All three tools are free to use, making them appealing for budget-constrained teams or those that need extensive customization. However, “free” does not mean “effortless”. Expect to invest time in scripting, maintaining infrastructure, and keeping up with updates from the open-source communities. Documentation quality varies, and while forums and Stack Overflow can fill gaps, there is no substitute for hands-on experience.
As cloud testing platforms and AI-powered analysis gain traction, open-source load testing tools remain relevant by offering transparency, scriptability, and deep customization. Choosing between JMeter, k6, or Gatling depends on your protocol needs, developer skills, and how tightly you want to integrate performance checks into your software delivery pipelines.
Cloud-Based Solutions: BlazeMeter, Grafana Cloud k6, and the New Generation
Key Insight: Cloud-based load testing tools have redefined how teams scale, collaborate, and analyze performance – but their convenience comes with trade-offs that every engineering leader should weigh carefully.
BlazeMeter and Grafana Cloud k6: Feature Overview
Cloud-based load testing tools like BlazeMeter and Grafana Cloud k6 represent the latest evolution in performance engineering. Instead of wrangling on-premise servers or manually coordinating distributed test agents, teams can launch tests from multiple geographic regions with a few clicks. For example, BlazeMeter automatically spins up engines to simulate hundreds of thousands of users, supporting protocols from HTTP to WebSockets and even legacy systems like mainframe TN3270. Grafana Cloud k6 lets teams write tests in JavaScript, then run them from the cloud with built-in metrics dashboards and smooth integration into the broader Grafana observability stack.
These platforms shine in collaborative test management. Instead of emailing results or wrangling spreadsheets, users access a shared dashboard for each test run. Real-time analytics break down response times, error rates, and throughput per endpoint, and integrations with tools like Slack or Microsoft Teams keep stakeholders in the loop. Typical use cases range from pre-release API validation to high-stakes Black Friday simulations, where distributed cloud infrastructure is the only practical way to mimic global spikes in traffic.
Limitations of Cloud-Only Testing
Despite their strengths, commercial SaaS offerings have honest limitations. First, subscription costs can escalate quickly for large teams or frequent, high-volume test runs. While these platforms eliminate hardware maintenance, they trade it for recurring fees – sometimes tied to usage, sometimes per user. For many organizations, the convenience justifies the price, but budget-conscious teams may feel squeezed.
Privacy and data residency also come into play. Tests and associated logs often reside on the vendor’s infrastructure, which can be a sticking point for regulated industries or companies with strict compliance requirements. Customization is another challenge. While dashboards and analytics are polished, advanced users may find certain features locked behind paywalls or unavailable entirely, especially if they want to run custom code or integrate with nonstandard protocols.
- Black-box testing: With cloud tools, you rarely see the underlying test infrastructure. If you need to debug low-level issues or control every parameter, open-source or self-hosted solutions might be more transparent.
- Vendor lock-in: Exporting test data, scripts, or results to migrate to another platform is not always straightforward.
The new generation of cloud-based load testing tools has made distributed, analytics-rich testing practical for teams of any size. The trade-off comes down to balancing ease of use and collaboration features with the reality of ongoing costs and less control over test internals. For many, the gains in speed and visibility outweigh the limitations – but these are not one-size-fits-all solutions.
Integration Patterns: Embedding Load Testing into CI/CD Pipelines
From Manual Testing to Continuous Assurance
For most teams, load testing starts as an ad hoc activity. Someone runs JMeter scripts on a laptop after every major release, parses the results manually, and hopes nothing was missed. But as expectations rise, this approach quickly shows its limits. The move to CI/CD pipelines – with tools like Jenkins, GitHub Actions, and GitLab CI – demands a step change: load testing must be automated, repeatable, and integrated into every build.
| Before | After |
|---|---|
|
|
The improved workflow puts performance front and center. Instead of chasing bugs after they reach production, issues are flagged the moment they appear. This shift makes performance testing part of the team’s daily rhythm, not a quarterly fire drill.
Common Integration Patterns
Modern load testing tools support direct integration with CI/CD systems. For example, k6 provides a dedicated GitHub Action and can post results as build checks. JMeter scripts can run headless in Docker containers inside Jenkins, with results published to InfluxDB and visualized in Grafana. Gatling, with its test-as-code paradigm, works well in pipelines that already treat tests as versioned artifacts.
- Script as Code: Store your load test definitions alongside application code. This enables repeatable, version-controlled performance assertions.
- Artifact Publishing: Save logs and reports as build artifacts, making troubleshooting easier after a failed run.
- Thresholds and Gates: Define thresholds for response times or error rates. If exceeded, the deployment halts – no more “good enough” launches.
- Cloud Execution: Use cloud-based tools like LoadFocus or BlazeMeter to generate distributed traffic without maintaining on-premise infrastructure.
Integration Challenges and Solutions
Integrating load testing into CI/CD isn’t trivial. Resource constraints, test flakiness, and noisy metrics can undermine trust in the results. Leading tools address these pain points with features like:
- Auto-scaling test runners (e.g., LoadFocus or Grafana Cloud k6) that provision resources dynamically, ensuring tests run reliably regardless of traffic model.
- Granular thresholds that distinguish between critical regressions and minor, expected variation.
- Native CI plugins for popular platforms, reducing setup overhead and making test failures actionable for developers – not just performance engineers.
The result: performance issues become visible far earlier, and teams can iterate quickly without sacrificing stability. As cloud-based tools and AI-powered analytics get smarter, embedding load testing in CI/CD is less about “checking the box” and more about building dependable, production-ready software from day one.
Decision Framework: How to Choose the Right Load Testing Tool
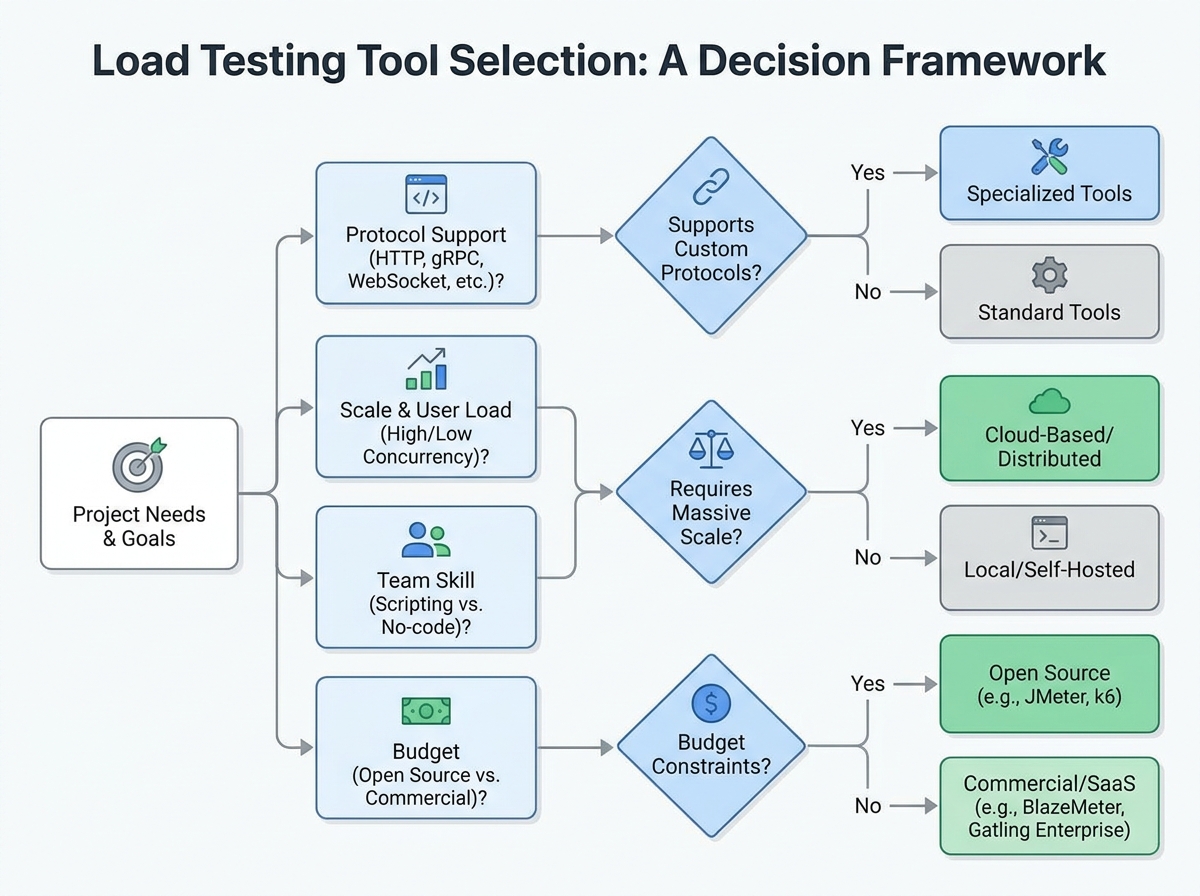
Selecting the right load testing tools is rarely a one-size-fits-all decision. Your optimal choice depends on factors like team experience, technical stack, pipeline maturity, budget, and the scale of your testing ambitions. Use the table below to map key criteria to the best-fit tools, then review the narrative guidance to refine your selection.
| Criteria | Best-fit Tools |
|---|---|
| Rapid cloud scaling, minimal local setup | LoadFocus, BlazeMeter, Grafana Cloud k6 |
| AI-powered analysis and actionable insights | LoadFocus |
| Budget-sensitive, highly customizable scripting | Apache JMeter, k6, Gatling, Locust |
| Full control over test environments (on-premise) | JMeter, Locust, Gatling |
| Integration with CI/CD pipelines | k6, Gatling, LoadFocus |
| Support for diverse protocols (beyond HTTP/HTTPS) | JMeter, Gatling |
| Easy scaling for global traffic and browser-based flows | LoadFocus, BlazeMeter |
Choose LoadFocus if:
Opt for LoadFocus when speed, simplicity, and cloud scalability are top priorities. If your team needs to simulate peak traffic across multiple regions without wrestling with infrastructure, LoadFocus handles distributed load generation natively. The platform performs well when you want to avoid the operational friction of managing test runners or spinning up VMs.
LoadFocus is also the right call if real-time insights and AI-powered performance analytics matter. If you lack a dedicated performance engineering team or want actionable recommendations, LoadFocus distills millions of datapoints into clear, prioritized actions. For organizations integrating load testing into modern CI/CD pipelines, the tool’s native integrations minimize setup time and support fast feedback cycles.
- You need to scale tests rapidly to thousands of virtual users, globally, with zero local setup.
- You want AI-generated performance insights without manual data crunching.
- Your team lacks the time or appetite to maintain on-premise test infrastructure.
- You require browser-based load tests to mimic real user flows.
- Your workflows demand easy integration with cloud-first DevOps pipelines.
Choose Open-Source/Other Tools if:
Consider open-source options like JMeter, k6, or Gatling when deep customization and budget control are non-negotiable. These tools shine when you need to script complex scenarios in JavaScript, Scala, or Python, or if your system under test uses uncommon protocols. On-premise test execution is another advantage – if your organization is subject to strict data privacy or security requirements, running tests within your own infrastructure is essential.
Open-source tools are also better if you want to deeply instrument your tests or build custom integrations, especially for non-standard environments. While these platforms require more setup and ongoing maintenance, the flexibility is unmatched.
- You need custom scripting logic beyond basic HTTP requests or want to test edge protocols.
- Your tests must run entirely on-premise for compliance or data sovereignty.
- Budget constraints make commercial licensing impractical, especially for smaller teams.
- Your team has strong technical expertise to maintain and extend open-source frameworks.
- You value transparent, community-driven development and full control over test execution.
When Both Make Sense
Many teams combine open-source and cloud-based tools for a hybrid approach. For example, you might run k6 or JMeter internally during early development, then use LoadFocus for cloud-scale validation and AI-driven analysis before major launches. This lets you balance cost, control, and advanced analytics, ensuring performance issues are caught early and validated at scale.
Hybrid strategies also help teams with diverse needs – power users can script highly specialized tests with open-source platforms, while broader QA or DevOps teams benefit from the streamlined workflows and insights of LoadFocus during critical releases.
When Open-Source or Alternative Tools Are the Better Choice
Key Insight: No single load testing tool fits every scenario – sometimes open-source or highly specialized alternatives deliver more control, lower costs, or compliance peace of mind.
Regulatory and Data Residency Requirements
For some organizations, compliance isn’t just a checkbox – it’s a hard requirement. If your industry mandates that test data stays within national borders (think healthcare, finance, or government), a cloud-based load testing platform may not be viable. Open-source tools like Apache JMeter or Locust can be installed directly on on-premise servers, ensuring local data residency for every test run. This approach not only satisfies auditors but also gives your team full control over where data lives and moves.
Deep Customization and Scripting
Sometimes, you need to test a niche protocol or simulate a user journey that commercial platforms don’t natively support. If your team needs to write scripts in languages like Scala (Gatling) or JavaScript (k6), open-source tools are often the only practical choice. For example, k6’s scriptable approach allows you to model complex user flows and integrate directly with CI/CD pipelines. Gatling stands out for its support of test-as-code, making it easier to version and review test scripts alongside your application code.
Cost Sensitivity and Large-Scale, Bespoke Testing
Budgets matter, especially if you’re running load tests across hundreds of endpoints or simulating traffic from multiple regions. Open-source load testing tools shine in cost-sensitive environments because they eliminate per-test or per-user licensing fees. If your organization already has in-house DevOps expertise, rolling out and scaling these tools on your own infrastructure can dramatically reduce ongoing expenses. Some enterprises routinely orchestrate custom test clusters to generate millions of requests per hour, leveraging commodity hardware or cloud VMs at cost.
- Example: A fintech startup with local compliance needs runs JMeter on its own servers to keep sensitive user data in-country.
- Example: A SaaS provider requiring custom TCP protocol support scripts tests with k6 or Locust, building scenarios no off-the-shelf solution could match.
- Example: An e-commerce giant saves six figures annually by deploying open-source load generators at scale, instead of paying per-use for a commercial SaaS platform.
The bottom line: load testing tools aren’t one-size-fits-all. If you need deep customization, strict data controls, or have the expertise to manage your own environments, open-source or alternative tools may be the smarter choice. Choosing the right fit means weighing flexibility, compliance, and cost against the convenience and advanced features of managed cloud platforms.
Observability and Performance Trends: Beyond Raw Load Metrics
The Shift from Basic Metrics to Actionable Insights
For years, load testing tools focused on surface-level metrics: request per second, throughput, and error rates. While these numbers are essential, they only tell part of the story. When a traffic spike hits, the real challenge isn’t just knowing the system is slow – it’s understanding why. That’s where observability integrations step in.
Modern testing platforms, including LoadFocus, recognize that dev and ops teams need more than a wall of numbers. Today’s leading tools integrate with dashboard platforms like Grafana, send real-time alerts to incident channels, and feed distributed traces into backends such as Jaeger or Zipkin. The result is a unified view that correlates simulated load with how your infrastructure, databases, and third-party APIs actually behave.
Dashboards, Traces, and Alerts: The New Normal
When you run a test, it’s no longer enough to watch the 99th percentile latency climb. Instead, you want to see which microservice instance gets overloaded, or whether a database connection pool hits its limit. Dashboards visualize this relationship in near real-time, letting you spot bottlenecks as they emerge. Tracing data reveals which requests stall and why, down to the slowest dependency. Proactive alerts ensure that you don’t miss subtle anomalies that might cascade into outages later.
Proactive Troubleshooting: From Detection to Diagnosis
Observability-driven load testing means teams don’t need to wait for a user outage to investigate performance issues. If a test triggers high CPU use on a specific container, the alert is immediate. Dashboards show which endpoint is failing, while traces pinpoint the upstream culprit – often a misconfigured cache or an overloaded queue. This proactive troubleshooting shortens incident resolution time and helps prevent recurring issues in production.
Emerging Trends: AI-Driven Anomaly Detection and Root Cause Analysis
The next wave goes further. AI-powered analysis, increasingly common in tools like LoadFocus, doesn’t just flag symptoms. It scans millions of data points from test runs, identifying patterns that humans might miss – such as a slow memory leak or a rare concurrency bug that only surfaces under sustained load. Some platforms now auto-surface likely root causes, ranking potential fixes by impact.
Of course, no platform can automate every diagnosis. Human judgment remains vital when interpreting complex multi-cloud architectures or nuanced business logic. Still, the integration of AI-driven anomaly detection with observability provides a serious advantage for high-stakes releases.
As cloud-native architectures grow more complex, the gap between knowing and understanding system performance will only widen. Observability-first load testing is quickly moving from “nice to have” to non-negotiable for teams that want to ship with confidence.
Limitations and Pitfalls: What Load Testing Tools Can’t Solve
False Confidence and Production Gaps
Even the best load testing tools can create a sense of security that doesn’t always match reality. Simulated traffic only approximates what users will do in the wild. For example, JMeter and Gatling can hammer APIs with thousands of requests per second, but they can’t reproduce every quirky user journey or the unpredictable mix of browsers, plugins, and network conditions seen in production. No tool can fully replicate the chaos of a high-profile product launch or the unique load spikes triggered by real-world marketing campaigns.
The Limits of Synthetic Traffic and Test Coverage
Test scripts are only as good as the scenarios you write. If your team misses an edge case – like a bug triggered by a rare API sequence, or concurrency issues at exactly 500 users – your tests won’t catch it. Tools like k6 and Locust excel at simulating large loads, but they won’t expose problems outside their defined test cases. There’s always a risk that certain paths, data combinations, or user actions go untested. As a result, coverage gaps persist, even with the most thorough suites.
Context-Free Metrics and Over-Reliance
Modern solutions, especially cloud-based platforms like BlazeMeter or Grafana Cloud k6, provide floods of metrics – response times, error rates, throughput, resource utilization. But these numbers mean little if you don’t understand the context. A 200ms response time might be excellent for a simple status check, but disappointing for a search endpoint. Over-reliance on dashboards without domain knowledge can lead teams to chase the wrong bottlenecks or miss subtle, business-critical issues. Metrics alone never tell the full story.
Best Practices to Mitigate Limitations
- Regularly update test scenarios as features evolve, and review scripts after every major release.
- Pair synthetic tests with real-world monitoring and observability to catch production-only failures.
- Solicit input from QA and support teams to surface unusual usage patterns or customer pain points for inclusion in test coverage.
- Always interpret results in the context of business priorities and real user experience – not just raw numbers.
Load testing tools are essential, but they are not a substitute for comprehensive quality practices or for understanding how actual users interact with your system. Prudent teams combine automated testing, observability, and human insight to close the gap between simulated and real-world performance.
Frequently Asked Questions about Load Testing Tools for CI/CD
Which load testing tools integrate best with CI/CD pipelines?
Scriptability and automation capabilities are the top requirements for CI/CD integration. Tools like k6 and Gatling have earned strong reputations here, thanks to their support for test-as-code and direct compatibility with popular CI servers. JMeter can also be automated, but it sometimes requires more scripting overhead. Cloud-based platforms, such as BlazeMeter or LoadFocus, provide native plugins and REST APIs, streamlining integration and reducing maintenance.
How do costs compare between open-source and commercial load testing tools?
Open-source options such as JMeter, k6 OSS, Locust, and Gatling are free to use, but you are responsible for setup, scaling, and maintenance. This can add hidden costs in terms of engineering hours, especially for larger tests or distributed runs. Commercial tools typically operate on a pay-as-you-go or subscription model, charging based on virtual user counts, duration, or test frequency. For example, testing a simple API endpoint with open-source tools may be nearly free, but simulating hundreds of thousands of concurrent users globally often requires paid cloud services.
What about scalability? Can these tools handle real-world load?
Cloud-based load testing tools have made it much easier to simulate large-scale, distributed user traffic. Tools like LoadFocus or Grafana Cloud k6 can spin up test agents in multiple regions, reflecting real-world access patterns. Open-source tools are scalable too, but you’ll need to provision and manage your own infrastructure for truly large tests. In practice, most teams find that commercial solutions save significant time when testing at enterprise scale, but for small to mid-sized scenarios, open-source frameworks can be more than sufficient.
How does observability fit with load testing in CI/CD pipelines?
Modern load testing tools increasingly offer integrations with observability platforms like Grafana, Datadog, or New Relic. This allows teams to correlate test traffic with backend metrics – for example, seeing how API latency or CPU usage responds to traffic spikes. Tools that support real-time dashboards and AI-powered analysis, such as LoadFocus, make it easier to spot bottlenecks and failures as they happen, instead of waiting for static reports.
Are there trade-offs in ease of use versus flexibility?
Absolutely. Open-source tools are flexible and scriptable, but often require more technical expertise and configuration. Commercial and browser-based platforms focus on user experience and support, offering guided test creation and built-in analytics, but may limit advanced customization unless you’re on a top pricing tier. Consider your team’s comfort level and project needs – there’s no universal “best” option, only the right fit for your workflow.
- Tip: Evaluate tools with a real scenario from your pipeline – don’t rely solely on feature lists or vendor demos.
Choosing between load testing tools for CI/CD should come down to a mix of technical fit, budget, and team expertise. The field continues to evolve rapidly, so staying current with platform capabilities and integration options pays off over the long term.
Article created using PostNext