Serverless Surge: Why Performance Testing Needs a New Playbook in 2026
Serverless Adoption Has Outpaced Testing Practices
In just a few years, serverless architecture has moved from an emerging trend to a core pillar of enterprise IT. By 2026, platforms like AWS Lambda, Azure Functions, and Google Cloud Functions are handling production workloads at scale for organizations worldwide. The draw is clear: instant scalability, no server management, and a usage-based billing model that can lower costs for unpredictable workloads.
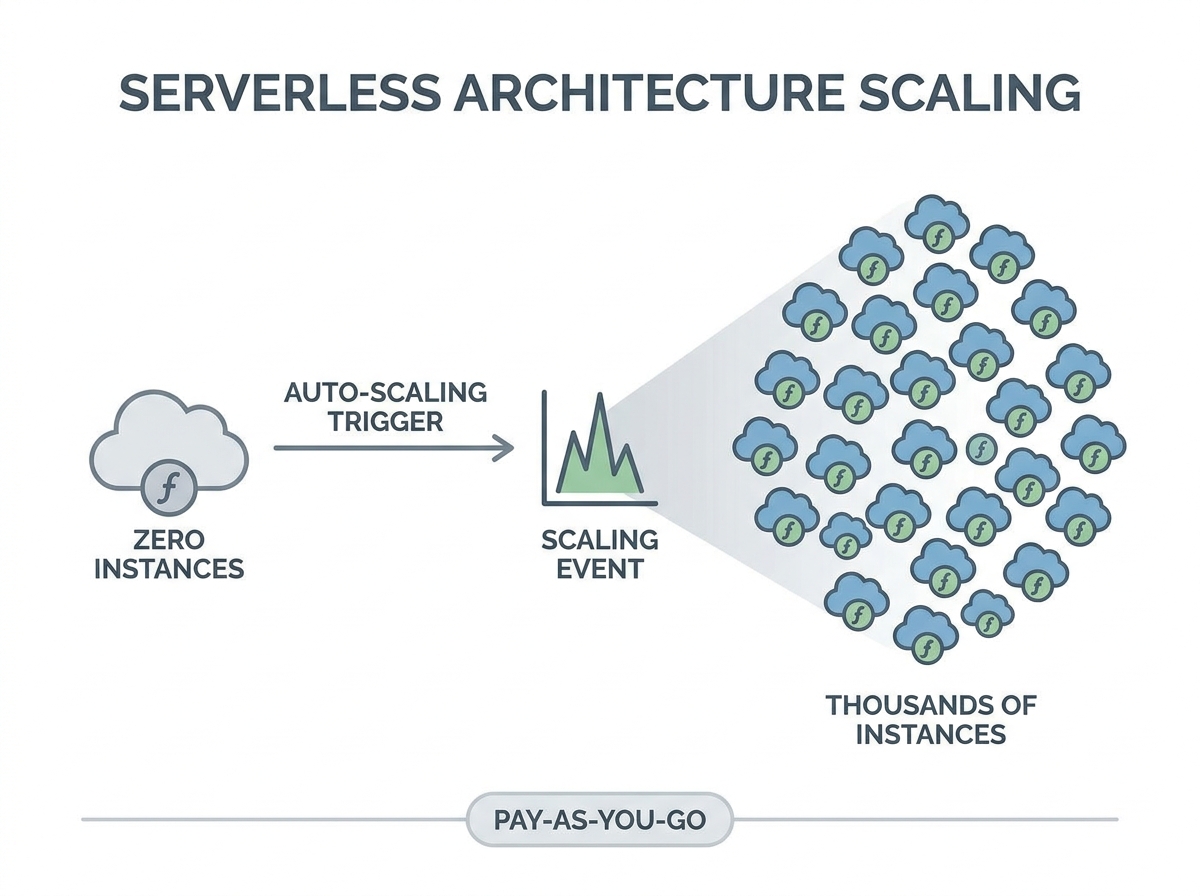
Yet, as serverless becomes mainstream, performance engineers are finding that legacy testing tools and assumptions no longer hold up. The classic approach – simulate steady load, monitor response time, and tune server counts – falls short in environments where stateless, ephemeral function execution and rapid scaling are the norm. Infrastructure can scale from zero to thousands of containers in moments, then drop back just as quickly, making old testing models obsolete.
Is Your Infrastructure Ready for Global Traffic Spikes?
Unexpected load surges can disrupt your services. With LoadFocus’s cutting-edge Load Testing solutions, simulate real-world traffic from multiple global locations in a single test. Our advanced engine dynamically upscales and downscales virtual users in real time, delivering comprehensive reports that empower you to identify and resolve performance bottlenecks before they affect your users.
Why Traditional Load Testing Fails in Serverless
Conventional performance testing depended on predictable application environments. Engineers would provision servers, warm them up, and apply load to see how systems held up under stress. In serverless, this approach misses crucial behaviors.
- Cold starts – the latency introduced when a function is invoked after being idle – can significantly impact user experience, especially for low-traffic endpoints. Many traditional tests overlook this entirely.
- Concurrency limits are enforced by platforms. For example, AWS Lambda has a default cap of 1,000 concurrent executions per account. Exceeding this leads to queued or dropped requests, often without clear visibility unless specifically monitored.
- Downstream bottlenecks are frequently missed. While serverless functions can scale rapidly, databases and other dependencies may not, so a surge in function invocations can overwhelm backend systems rather than the cloud provider itself.
Performance now involves more than just latency. Execution duration, invocation concurrency, cold start frequency, and cost per invocation all play a role. Engineers increasingly rely on provider-native metrics such as AWS CloudWatch and Azure Application Insights, but synthesizing these into actionable test plans requires a new skill set.
Think your website can handle a traffic spike?
Fair enough, but why leave it to chance? Uncover your website’s true limits with LoadFocus’s cloud-based Load Testing for Web Apps, Websites, and APIs. Avoid the risk of costly downtimes and missed opportunities—find out before your users do!
New Tools and a Shift in Mindset
Purpose-built tools like the Serverless Benchmark Suite (SeBS) are emerging to address these challenges. SeBS enables standardized benchmarking across AWS, Azure, and Google Cloud, capturing nuances such as cold starts and concurrency throttling – factors legacy frameworks often miss.
However, adopting new tools is only part of the solution. Effective serverless performance testing requires rethinking what to measure and how to simulate real-world usage. Overlooking cold starts, ignoring concurrency limits, or failing to test downstream dependencies can hide real risks until they appear in production.
With serverless architecture performance testing now central to cloud strategy, engineers must adapt. Success means operating in environments where infrastructure is abstracted, scale is instant, and bottlenecks can emerge anywhere in the stack. Organizations that master these changes will deliver reliable, responsive services – regardless of workload unpredictability.
LoadFocus is an all-in-one Cloud Testing Platform for Websites and APIs for Load Testing, Apache JMeter Load Testing, Page Speed Monitoring and API Monitoring!
What Drove the Serverless Shift?
Five years ago, deploying applications meant managing virtual machines, configuring load balancers, and handling a complex stack of infrastructure. Legacy server-based deployments required careful capacity planning and often led to either outages or wasted resources.
The move to serverless architecture arose from the need for faster releases, clearer cost structures, and the ability to respond to unpredictable user demand. Services like AWS Lambda and Azure Functions offered elastic scaling and abstracted away most infrastructure management. Teams could now ship features quickly and scale from zero to thousands of users in real time, paying only for actual execution. This agility is a major factor behind the rapid growth of serverless adoption, as seen in industry observations.
But this flexibility introduces new challenges. In serverless architecture performance testing, unpredictability is inherent. Functions may sit idle for hours, then spike to hundreds of instances in milliseconds. Cold starts – when a function spins up after inactivity – can cause latency spikes that disrupt user experience, especially for endpoints with sporadic traffic. Traditional load testing methods cannot capture these dynamics.
Concurrency limits also require attention. AWS Lambda’s default cap of 1,000 concurrent executions means that exceeding this threshold during tests can result in queued or dropped requests, skewing results. While the function layer scales on demand, backend services often do not, creating hidden bottlenecks that only appear under real-world load.
Performance is now multi-dimensional: execution time, concurrency, cold start frequency, and cost all matter. Engineers track these metrics using tools like AWS CloudWatch and benchmarking suites such as SeBS, which automate multi-cloud, language-agnostic testing. These solutions are now essential for capturing the realities of serverless.
Legacy vs. Serverless: Deployment Timeline
Deploying a legacy application often took weeks of provisioning and validation. Operations teams sized servers, set up monitoring, and planned failover strategies before users ever accessed the system. In contrast, serverless deployment can be completed in hours. Developers push function code, configure event triggers, and let the platform manage scaling and recovery. This speed, however, introduces new complexities for performance testing.
| Deployment Model | Key Benefits | Performance Testing Challenges |
|---|---|---|
| Legacy Server-Based |
|
|
| Serverless (e.g., AWS Lambda, Azure Functions) |
|
|
The serverless shift is about more than replacing servers – it involves adopting a new mindset. Teams move faster, but must now address performance testing scenarios that didn’t exist in the legacy world. As serverless adoption matures, mastering serverless architecture performance testing will determine whether organizations realize its agility or encounter real-world bottlenecks.
Key Challenges in Serverless Architecture Performance Testing
Serverless computing has upended traditional performance testing assumptions. Unlike monolithic systems, serverless functions introduce new technical hurdles that require a fresh approach. Here’s where performance engineers typically encounter difficulties.
Unpredictable Latency: The Cold Start Problem
Cold starts remain a notorious challenge in serverless architecture performance testing. When a function is called after being idle, the platform must allocate resources and load the code package, adding noticeable latency. For low-traffic endpoints, cold starts can account for a significant portion of user latency. Standard load testing tools often miss these spikes, producing misleadingly optimistic results.
Concurrency Limits and Throttling
Unlike monolithic servers, serverless platforms like AWS enforce concurrency quotas. The default is 1,000 concurrent Lambda executions per account. If your test exceeds this, some invocations are throttled or queued, distorting results and potentially masking real-world issues, especially during traffic surges.
Ephemeral Compute Meets Downstream Bottlenecks
Serverless functions can scale rapidly, but their dependencies often cannot. For example, a Lambda function may trigger many times in a burst, but if it writes to a database with limited connections, the database becomes the bottleneck. Performance testing must simulate not just the function, but every connected service.
Before/After: Load Testing a Monolith vs. Serverless Function
| Before (Weak Approach) | After (Strong Approach) |
|---|---|
A simple load test hammers the main API endpoint of a monolithic application with 1,000 concurrent users for 10 minutes. The test tracks average response times and error rates, assuming the server remains available and warmed up. Results are steady and predictable, with minimal latency spikes.
| A performance engineer targets a Lambda-based API with the same 1,000 concurrent users. The test adds randomized pauses to trigger cold starts, monitors AWS CloudWatch metrics for concurrent executions, and deliberately exceeds the concurrency limit to observe throttling behavior. The test also tracks database throughput to identify downstream bottlenecks.
|
The “before” approach ignores the nuances of serverless environments. It assumes resources are always available and fails to simulate real-world conditions. The “after” scenario follows platform documentation recommendations by explicitly testing for cold starts, concurrency, and downstream saturation, producing actionable insights for developers and SREs.
Key Insight: Effective serverless architecture performance testing requires engineers to design tests that intentionally expose cold starts, concurrency limits, and dependency bottlenecks – otherwise, the biggest risks remain hidden until production.
As serverless adoption deepens, performance testing must reflect these evolving realities. Relying on old patterns leads to missed problems and costly surprises. Adapting your methodology – and your tooling – to these serverless-specific constraints is now essential for reliable cloud applications.
Understanding Cold Starts: The Hidden Latency Problem
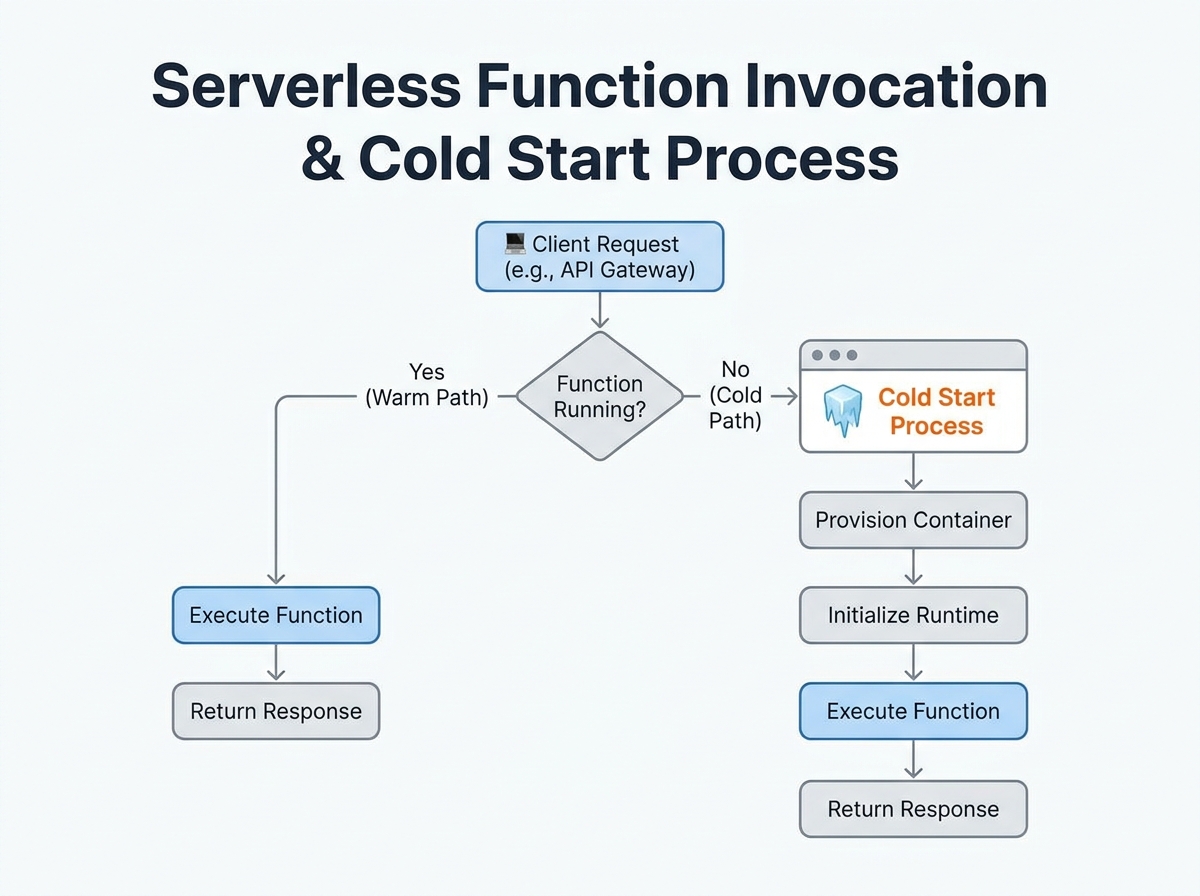
What Happens During a Cold Start?
In serverless architecture performance testing, cold starts can derail your latency numbers. When a function is called after a period of inactivity, the provider must allocate resources, initialize the runtime, and load your function code from storage before handling the request.
The cold start sequence involves:
- Resource allocation: The provider boots up a compute instance.
- Runtime initialization: The language runtime (Node.js, Python, Java, etc.) is launched.
- Code loading: Function code and dependencies are loaded from storage.
- Handler execution: The function executes the user’s logic.
Each step adds to initial invocation latency. In low-traffic APIs, this delay isn’t amortized over many requests – the first user after a quiet period gets hit with a multi-hundred-millisecond penalty.
Cold Start Duration and Provider Differences
Cold start times vary by provider, runtime, and memory allocation. For example, the Serverless Benchmark Suite (SeBS) has measured cold start latencies across major platforms:
| Cloud Provider | Cold Start Duration (ms) | Mitigation Options |
|---|---|---|
| AWS Lambda | 200 – 1,500 | Provisioned Concurrency, Increase Memory, Smaller Deployments |
| Azure Functions | 500 – 2,000 | Premium Plans, Always On, Minimize Dependencies |
| Google Cloud Functions | 400 – 1,200 | Pre-warming Scripts, Optimize Dependencies |
Even a 200 ms penalty is significant for user-facing endpoints expecting sub-100 ms responses.
Why Cold Starts Must Be Measured
Ignoring cold starts in your serverless architecture performance testing leads to an incomplete picture. Synthetic benchmarks that only hit “warmed” functions underestimate real-world latency, especially for public APIs or low-traffic tools.
Effective testing means triggering functions after idle intervals, not just running them in a loop. Cloud testing platforms can automate these patterns, revealing worst-case latency and providing a realistic sense of user experience.
Key Insight: Cold starts are the hidden bottleneck in serverless performance – if you don’t test for them, you’re missing the most unpredictable source of latency your users will encounter.
How to Measure and Mitigate Cold Starts
To measure cold starts, schedule invocations after idle periods and log response times. Use built-in metrics from AWS CloudWatch, Azure Application Insights, or Google’s operations suite to distinguish cold starts from warm invocations. Mitigation options include provisioned concurrency (AWS), always-on plans (Azure), or optimizing deployment packages to reduce initialization overhead. Each approach comes with trade-offs in cost and complexity, but all are important for delivering consistently low latency.
Factoring cold starts into your strategy is now essential. Ignoring this variability means underestimating latency and missing critical optimization opportunities.
Concurrency and Throttling: New Limits in Serverless Performance Testing
Serverless architecture performance testing introduces constraints that rarely troubled engineers in traditional environments. Providers like AWS Lambda, for example, cap concurrent executions at 1,000 per account by default. Push past this threshold and you may see queued or dropped invocations, which can invalidate your results if not closely monitored.
Throttling policies add another layer of complexity. Each platform manages bursts differently: some queue excess requests, others reject them outright. Your tests might reflect these protective mechanisms rather than the actual limits of your code. To measure real-world user experience under heavy load, you need to distinguish between provider-imposed ceilings and true application bottlenecks.
It’s not enough to test only your function’s scalability. Downstream dependencies – such as databases or third-party APIs – often can’t match the elasticity of serverless functions. During high-concurrency tests, your function may scale instantly, but a database connection pool or rate-limited API can become the weakest link. Effective serverless architecture performance testing must map and probe every dependency.
Key Insight: Provider concurrency and throttling limits are not just technical fine print – they directly affect whether your performance tests reveal application realities or artificial platform constraints.
Before/After: Concurrency Handling in Traditional vs. Serverless Load Tests
| Before: Traditional Servers | After: Serverless Functions |
|---|---|
| Concurrency was typically limited by hardware resources – CPU, memory, thread pools. Engineers would size servers based on expected peak loads, with upper bounds determined by infrastructure. | Concurrency is capped by provider-imposed ceilings like AWS Lambda’s 1,000 concurrent executions. Scaling is dynamic, but hard limits are set by the platform, not just your code or hardware. |
| Throttling meant tuning OS-level settings or application server configs. If load was too high, you saw resource exhaustion – CPU spikes or out-of-memory errors. | Throttling is automatic and opaque. Your test might report dropped invocations or increased latency due to queuing, and the platform rarely exposes granular reasons for these slowdowns. |
The shift to serverless requires a new testing mindset. Instead of focusing solely on system resource usage, you now have to monitor platform metrics – like concurrent executions, throttled invocations, and downstream service health. Only by correlating these signals can you distinguish between genuine scaling issues and artificial provider constraints.
Multi-Dimensional Metrics: Rethinking What to Measure
Traditional load testing once relied on a handful of metrics – most notably, response time. In serverless architecture performance testing, that approach is insufficient. Serverless platforms like AWS Lambda and Azure Functions operate on demand, scaling from zero to thousands of containers in seconds. This elasticity introduces new variables: cold starts, platform-imposed concurrency limits, and a cost model tied directly to usage. Focusing on just response time is like measuring a car’s performance by its top speed alone, ignoring acceleration and efficiency.
Critical Metrics Beyond Response Time
To truly understand serverless architecture performance testing, you must track several metrics in parallel. Here are the core dimensions every team should watch:
| Metric | Why It Matters | How to Measure |
|---|---|---|
| Execution Duration | Impacts user experience and cost. Longer durations can signal cold starts or downstream bottlenecks. | AWS CloudWatch: Duration metric per invocation. Azure Application Insights: Request Duration property. |
| Invocation Concurrency | Hitting concurrency limits (e.g., AWS Lambda’s 1,000 default cap) can result in throttling and queued requests. | AWS CloudWatch: ConcurrentExecutions metric. Azure Application Insights: Track custom telemetry for concurrent runs. |
| Cold Start Frequency | Frequent cold starts inflate latency, particularly on low-traffic endpoints or after scaling events. | AWS CloudWatch: Analyze spikes in Init Duration. Azure: Correlate increased durations with execution count after idle periods. |
| Cost | Every millisecond and invocation counts. High concurrency or long-running functions can increase bills. | AWS Cost Explorer: Break down Lambda spend by function. Azure Cost Management: View function-level cost allocation. |
Collecting and Interpreting Multi-Dimensional Data
Modern observability tools are essential for pulling these metrics together. AWS CloudWatch and Azure Application Insights provide native dashboards and alerting. For example, you can set up CloudWatch Alarms to flag when ConcurrentExecutions approaches your account limit, or use Application Insights Analytics to correlate spikes in Request Duration with cold start events.
Interpreting this data requires context. If you see sporadic latency spikes, check cold start frequency before blaming your code. If error rates rise under load, verify whether you’re hitting concurrency thresholds or if downstream dependencies – like a database – are throttling requests. Cost metrics should be read alongside concurrency and duration: an optimized function might average 100ms per run, but if traffic surges and concurrency maxes out, both latency and spend can climb.
Serverless performance is inherently multi-dimensional. By embracing these metrics and using built-in monitoring from your cloud provider, you set yourself up for more accurate, actionable performance testing – and fewer surprises in production.
The Serverless Benchmark Suite (SeBS): Standardizing Performance Testing
Serverless architecture performance testing is a moving target. Functions scale rapidly, cold starts inject unpredictable latency, and concurrency limits shape the user experience in ways that most traditional tools cannot capture. The Serverless Benchmark Suite (SeBS) provides a practical answer for teams seeking consistency and repeatability in this new testing reality.
SeBS automates benchmarking across major Function-as-a-Service (FaaS) platforms, supporting AWS Lambda, Azure Functions, and Google Cloud Functions. Its core strength lies in running a set of pre-defined benchmark applications – spanning multiple programming languages – so you can test with Python, JavaScript, Java, and more, without reinventing the wheel for each provider. By streamlining deployment and invocation, SeBS removes much of the manual overhead involved in multi-cloud testing.
SeBS enables apples-to-apples comparisons. You can deploy the same workload pattern to AWS Lambda and Azure Functions, then compare cold start latency, concurrency handling, and cost metrics using a consistent methodology. This helps teams avoid the trap of comparing bespoke workloads or running ad hoc tests that obscure real differences in platform behavior.
For organizations invested in rigorous serverless architecture performance testing, SeBS makes it possible to:
- Quantify cold start delays in milliseconds across providers and runtimes
- Surface bottlenecks caused by concurrency or downstream resource limits
- Track performance regressions over time as code or infrastructure changes
- Benchmark cost and execution duration together for a full picture of efficiency
Integrating SeBS into Load Testing Workflows
Bringing SeBS into your continuous performance testing pipeline is straightforward with the right workflow. Start by selecting benchmark applications that mirror your production workloads – SeBS offers options from simple compute tests to I/O-heavy scenarios. Configure your cloud credentials for each provider you wish to target.
Trigger automated test runs as part of your CI/CD process, ideally after each major deployment or infrastructure update. Pair SeBS output with provider metrics (such as AWS CloudWatch or Azure Application Insights) to build dashboards that highlight outliers and regressions in latency or throughput. Schedule regular benchmarking sweeps to catch subtle performance drifts that may not trigger alarms in daily monitoring. By integrating SeBS into this feedback loop, teams can address serverless inefficiencies before they impact users or budgets.
Avoiding Common Pitfalls in Serverless Load and Performance Testing
Testing serverless systems is fundamentally different from testing legacy monoliths. Many teams stumble by assuming serverless functions behave like traditional servers or by overlooking behaviors unique to the model. Here’s where serverless architecture performance testing frequently goes off track – and how to avoid these traps.
Oversight of Cold Starts Skews Results
One of the most persistent mistakes is ignoring cold starts. A cold start occurs when a function hasn’t been used for a while and the platform needs to allocate resources and load code, adding unpredictable latency. Testing only “warm” functions paints an incomplete picture. For instance, on AWS Lambda, cold starts can add several hundred milliseconds to the first invocation – enough to degrade user experience for low-traffic endpoints.
To avoid this, deliberately include cold starts in your test scenarios. Alternate between steady invocations and idle periods, then measure the impact. Don’t just average response times; break out cold and warm start timings to see the true variability users experience.
Neglecting Downstream Bottlenecks
It’s tempting to focus only on the function itself, but serverless functions rarely operate in isolation. They often depend on databases, queues, or third-party APIs that may not scale as fast as the functions. During bursty load spikes, these downstream systems can quickly become bottlenecks, even if the serverless platform is handling thousands of concurrent executions without issue.
For example, if you test a Lambda that writes to a database, but the database throttles after a certain throughput, your function’s performance will degrade regardless of Lambda’s scalability. Always include the full call chain in your tests, and monitor every hop – not just the function’s response.
Assuming Linear Scalability Is a Fallacy
Serverless marketing often touts “infinite” scaling, but providers enforce hard concurrency limits. AWS Lambda, for example, sets a default concurrency cap of 1,000 executions per account. If your test pushes past that, new requests get queued or dropped, distorting your metrics. Even before you hit the hard limit, you might see soft throttling or increased latency.
Linear scaling is a myth because real-world systems are constrained by provider limits, downstream capacity, and unpredictable queueing. Structure your tests to explore how performance degrades as you approach and cross these thresholds, rather than just ramping up requests and expecting a straight line on the chart.
Checklist: Serverless Performance Testing Best Practices
- Simulate both cold and warm starts. Alternate idle periods with bursts to surface latency spikes.
- Test at and beyond provider concurrency limits. Know your platform’s caps (e.g., AWS Lambda’s 1,000 concurrent executions) and observe how your system behaves under throttling.
- Include downstream systems in your scope. Monitor databases, APIs, and queues for bottlenecks during load tests.
- Use multi-dimensional metrics. Measure duration, concurrency, error rates, and cost – not just response time. Provider tools like CloudWatch or Application Insights are essential here.
- Employ benchmarking tools tailored for serverless. Suites like SeBS provide standardized, repeatable ways to compare function performance across providers and languages.
- Avoid static, predictable loads. Incorporate bursty and unpredictable traffic patterns that mimic real-world usage, rather than steady-state loads.
Effective serverless architecture performance testing means questioning old habits and adapting your approach to reflect the distributed, ephemeral nature of these systems. By addressing these pitfalls directly, you’ll produce results that reflect how your serverless applications behave in production.
Expert Perspectives: How Performance Engineers Are Adapting
From Infrastructure to Application-Level Metrics
Serverless adoption is forcing a fundamental shift in performance engineering. Where engineers once focused on server CPU utilization and load balancer stats, the focus now is on function execution time, cold start latency, and downstream bottlenecks. Analysis from the Serverless Benchmark Suite (SeBS) project highlights that cold starts can make or break user experience, especially for low-traffic APIs. Integrating cold start scenarios directly into any serverless architecture performance testing routine is critical. Ignoring these outliers leads to results that may not hold up under real-world usage.
Automation and Observability Take Center Stage
The unpredictable scaling of serverless functions means manual spot-checks are no longer enough. Leading practitioners are calling for end-to-end automation: scheduled test runs, synthetic traffic spikes, and CI/CD integration for performance baselining. Tools like SeBS, which automatically deploy and invoke functions across AWS, Azure, and Google Cloud, are becoming a standard for repeatable, unbiased benchmarks.
But numbers alone are not enough. Observability platforms such as AWS CloudWatch and Azure Application Insights now play a critical role, surfacing metrics like invocation concurrency, error rates, and resource consumption. Modern performance engineers are expected to interpret this data in context, identifying how cost, latency, and scalability interact.
Collaboration: Blurring the Lines Between Dev and Test
Increasingly, developers and testers are working together to design performance scenarios that mirror production traffic. With serverless, performance issues often stem from unexpected interactions with downstream services – such as a database throttling before Lambda concurrency limits are reached. The best teams bring development, QA, and operations into the same feedback loop, iterating on test cases and interpreting anomalies as a group.
The consensus among practitioners is clear: serverless architecture performance testing demands new skills and mindsets. Mastery now means automating the unpredictable, collaborating across silos, and measuring what actually matters – wherever bottlenecks appear.
The Future of Serverless Performance Testing
AI-Driven Observability and Anomaly Detection
The next phase of serverless architecture performance testing is being shaped by intelligent automation. AI-powered anomaly detection is moving from research to reality. Instead of sifting through endless logs, engineers are now using machine learning to flag latency spikes, cold start outliers, and cost anomalies in near real time. This approach is especially valuable in serverless environments, where traditional baselines are less meaningful and traffic patterns change rapidly. Tools use provider data from AWS CloudWatch or Azure Application Insights to surface unexpected cold start patterns or highlight sudden increases in concurrency-related throttling.
Continuous Monitoring and CI/CD Integration
Performance monitoring in serverless is becoming a continuous, integrated process rather than a one-off activity before release. Many teams are embedding performance checks directly into their CI/CD pipelines, allowing every deployment to be measured against historical data and dynamic benchmarks. This shift enables rapid feedback, so teams can spot regressions before they reach production. Developers can now trigger synthetic load tests as part of automated workflows, capturing metrics like cold start latency, concurrency, and downstream dependency bottlenecks. The goal is real-time visibility – not just for operations, but for the entire engineering team.
Benchmarking Suites and Standardization
The Serverless Benchmark Suite (SeBS) is a sign of progress toward industry-wide benchmarking. SeBS enables automated performance analysis across AWS Lambda, Azure Functions, and Google Cloud Functions, standardizing how engineers and researchers evaluate serverless platforms. Its support for multiple languages and automatic deployment has made it a go-to for systematic comparison, which is essential in a space where performance can swing dramatically based on implementation details.
Limitations: Complexity and Immature Standards
Despite these advances, the field faces real constraints. The complexity of serverless environments means even the best tools struggle to account for every variable – cold starts, concurrency limits, and downstream throttling often interact in unpredictable ways. There is also no unified standard for serverless architecture performance testing: teams rely on a mix of custom scripts, cloud-native metrics, and emerging suites like SeBS. This fragmentation leads to inconsistent results and makes cross-platform comparisons challenging.
While AI and automation are rapidly improving testing capabilities, human expertise remains essential to interpret results and design realistic scenarios. As serverless adoption grows, expect the gap between tool sophistication and real-world complexity to narrow – but not disappear entirely. Teams that combine sharp engineering instincts with the best available tools will have the clearest view of serverless performance in the years ahead.
Actionable Takeaways for Testers and DevOps Teams
Priorities for Effective Serverless Architecture Performance Testing
- Always Test for Cold Starts
Cold starts remain the top source of unpredictable latency in serverless environments. Ensure your test scripts explicitly simulate idle function invocations in addition to steady, warm traffic. If your endpoint serves low or spiky traffic, measure and report cold start delays – these can be several hundred milliseconds or more, especially with complex runtimes or larger deployment packages.
- Don’t Ignore Provider Concurrency Limits
Each major cloud provider enforces hard concurrency caps on serverless functions. For example, AWS Lambda sets a default account-level limit of 1,000 concurrent executions. Your test plan should mimic real-world surges, but also monitor for throttling or queued requests that may occur when you exceed these caps. Failing to do so can result in misleadingly optimistic reports.
- Measure More Than Just Response Time
Serverless performance is multi-dimensional. Track invocation durations, error rates, concurrent executions, and downstream dependency latency in addition to classic response times. Use provider-native observability tools like AWS CloudWatch or Azure Application Insights to collect and correlate these metrics for comprehensive analysis.
- Standardize Benchmarks with Tools Like SeBS
Ad-hoc scripts are no longer sufficient. Adopt proven benchmarking frameworks such as the Serverless Benchmark Suite (SeBS) to automate deployment, invocation, and comparison of FaaS workloads across providers. SeBS supports multiple languages and platforms, allowing teams to conduct apples-to-apples performance comparisons in a repeatable way.
- Benchmark Downstream Dependencies
Your function may scale, but the underlying database or queue often won’t. Use realistic load profiles to stress-test downstream services and identify hidden bottlenecks early in your serverless architecture performance testing efforts.
- Update Testing Mindsets and Documentation
Move away from assumptions built for legacy infrastructure. Document new test patterns and regularly review them as your cloud provider’s limits, runtimes, and best practices evolve.
Staying precise and proactive with these strategies will give your team a head start as serverless adoption grows and testing demands become more nuanced.
Frequently Asked Questions: Serverless Architecture Performance Testing
What makes serverless architecture performance testing different from traditional approaches?
Serverless functions like AWS Lambda or Azure Functions can scale from zero to thousands of concurrent executions in seconds. Unlike fixed-capacity servers, this unpredictable scaling creates unique challenges for performance testing. Classic methods focused on steady-state load don’t apply – you need to simulate bursty, event-driven traffic and focus on behaviors like cold starts and concurrency limits.
How can I accurately test for cold start latency?
A cold start occurs when a function runs after being idle, triggering extra latency as resources spin up. To test this, ensure that your load test includes periods of inactivity followed by new invocations. Avoid only sending constant traffic, or you’ll only measure warm starts. Cold starts can add noticeable latency depending on language and configuration.
What are concurrency limits, and why do they matter?
Major serverless providers enforce concurrency limits. For instance, AWS Lambda has a default concurrent execution cap of 1,000 per account. If your test exceeds this, new invocations are queued or dropped, which can skew your metrics and mask real bottlenecks. Always align your test design with the actual concurrency settings in your cloud environment, and monitor for throttling via provider dashboards.
Which metrics are most important for serverless performance testing?
Response time is just the beginning. You should also track cold start frequency, execution duration, error rates, and cost per invocation. Provider-native tools like AWS CloudWatch or Azure Application Insights surface these metrics. Don’t overlook downstream latencies – databases and APIs can bottleneck even if your function scales.
How do I benchmark performance across different serverless platforms?
The Serverless Benchmark Suite (SeBS) is an open-source tool that automates deployment and testing of benchmark apps on AWS Lambda, Azure Functions, and Google Cloud Functions. It helps objectively compare performance, cold start times, and scaling behaviors, supporting multiple programming languages. SeBS is used by engineers and researchers to standardize cross-platform testing.
What are the most common mistakes in serverless load testing?
- Ignoring cold starts and only testing continuously warm functions
- Overlooking concurrency and throttling limits, leading to misleading results
- Measuring only response times instead of multi-dimensional metrics
- Forgetting to simulate real-world bursty and unpredictable event traffic
Can serverless performance testing reveal cost issues?
Yes. Since you’re billed per invocation and execution time, inefficient code paths or excessive cold starts can drive up costs unexpectedly. An effective test uncovers not just technical bottlenecks but also cost hotspots, helping teams optimize both performance and spend.
As the shift to serverless architecture performance testing grows, a thoughtful approach is crucial. Teams that adapt their testing strategies to these new realities will be better positioned to deliver reliable, scalable, and cost-effective cloud applications.
{“@context”:”https://schema.org”,”@type”:”FAQPage”,”mainEntity”:[{“@type”:”Question”,”name”:”What makes serverless architecture performance testing different from traditional approaches?”,”acceptedAnswer”:{“@type”:”Answer”,”text”:”Serverless functions like AWS Lambda or Azure Functions can scale from zero to thousands of concurrent executions in seconds. Unlike fixed-capacity servers, this unpredictable scaling creates unique challenges for performance testing. Classic methods focused on steady-state load don’t apply – you need to simulate bursty, event-driven traffic and focus on behaviors like cold starts and concurrency limits.”}},{“@type”:”Question”,”name”:”How can I accurately test for cold start latency?”,”acceptedAnswer”:{“@type”:”Answer”,”text”:”A cold start occurs when a function runs after being idle, triggering extra latency as resources spin up. To test this, ensure that your load test includes periods of inactivity followed by new invocations. Avoid only sending constant traffic, or you’ll only measure warm starts. Cold starts can add noticeable latency depending on language and configuration.”}},{“@type”:”Question”,”name”:”What are concurrency limits, and why do they matter?”,”acceptedAnswer”:{“@type”:”Answer”,”text”:”Major serverless providers enforce concurrency limits. For instance, AWS Lambda has a default concurrent execution cap of 1,000 per account. If your test exceeds this, new invocations are queued or dropped, which can skew your metrics and mask real bottlenecks. Always align your test design with the actual concurrency settings in your cloud environment, and monitor for throttling via provider dashboards.”}},{“@type”:”Question”,”name”:”Which metrics are most important for serverless performance testing?”,”acceptedAnswer”:{“@type”:”Answer”,”text”:”Response time is just the beginning. You should also track cold start frequency, execution duration, error rates, and cost per invocation. Provider-native tools like AWS CloudWatch or Azure Application Insights surface these metrics. Don’t overlook downstream latencies – databases and APIs can bottleneck even if your function scales.”}},{“@type”:”Question”,”name”:”How do I benchmark performance across different serverless platforms?”,”acceptedAnswer”:{“@type”:”Answer”,”text”:”The Serverless Benchmark Suite (SeBS) is an open-source tool that automates deployment and testing of benchmark apps on AWS Lambda, Azure Functions, and Google Cloud Functions. It helps objectively compare performance, cold start times, and scaling behaviors, supporting multiple programming languages. SeBS is used by engineers and researchers to standardize cross-platform testing.”}},{“@type”:”Question”,”name”:”Can serverless performance testing reveal cost issues?”,”acceptedAnswer”:{“@type”:”Answer”,”text”:”Yes. Since you’re billed per invocation and execution time, inefficient code paths or excessive cold starts can drive up costs unexpectedly. An effective test uncovers not just technical bottlenecks but also cost hotspots, helping teams optimize both performance and spend. As the shift to serverless architecture performance testing grows, a thoughtful approach is crucial. Teams that adapt their testing strategies to these new realities will be better positioned to deliver reliable, scalable, and cost-effective cloud applications.”}}]}