If you know nothing about your customers’ experience with your website, Google Lighthouse might be the right tool for you.
Google Lighthouse is an open source automated website auditing tool from Google, used for discovering issues and opportunities to improve the overall user experience of your website.
Is Your Infrastructure Ready for Global Traffic Spikes?
Unexpected load surges can disrupt your services. With LoadFocus’s cutting-edge Load Testing solutions, simulate real-world traffic from multiple global locations in a single test. Our advanced engine dynamically upscales and downscales virtual users in real time, delivering comprehensive reports that empower you to identify and resolve performance bottlenecks before they affect your users.
Whether you’re a product owner, business owner or analyst, software developer or tester, Google Lighthouse offers the possibility to identify opportunities to improve your website through simple steps, no coding skills required.
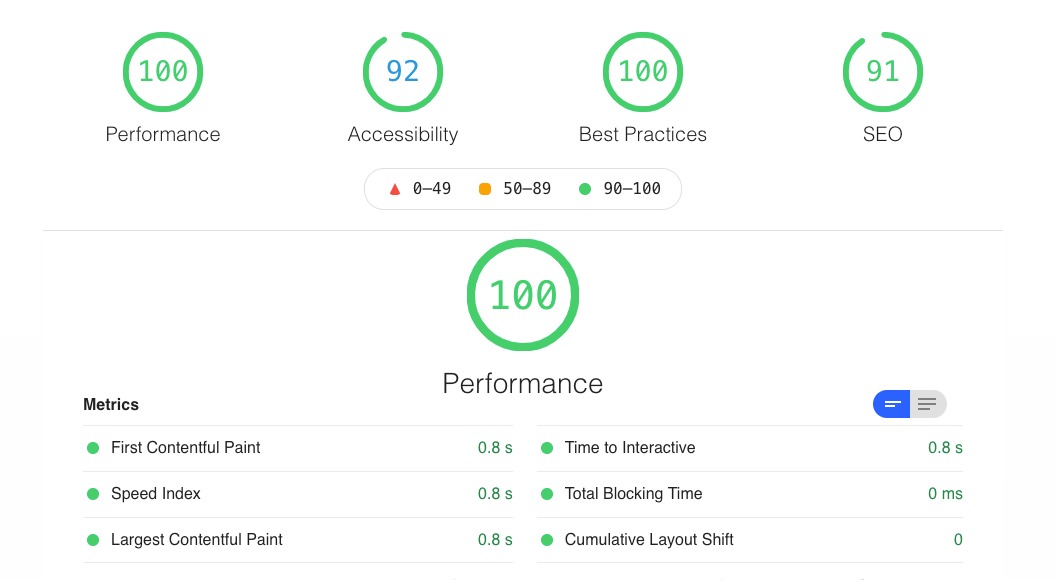
What does Google Lighthouse measure?
Google Lighthouse measures several aspects of user experience quality, in a simulated environment, aspects that include performance, SEO, accessibility metrics and other best practices. Everything is focused on the user experience and ways on how to achieve a High Quality User Experience.
Which are the metrics used by Google Lighthouse?
Google Lighthouse has defined their own audit metrics, metrics which are not part of what they call Core Web Vitals. The Role of Core Web Vitals is that it offers a better understanding about the main focus, which is your users’ experience while using your website.
Think your website can handle a traffic spike?
Fair enough, but why leave it to chance? Uncover your website’s true limits with LoadFocus’s cloud-based Load Testing for Web Apps, Websites, and APIs. Avoid the risk of costly downtimes and missed opportunities—find out before your users do!
The new user experience metrics introduced in 2020 are Largest Contentful Paint (LCP) and Cumulative Layout Shift (CLS) and are part of Core Web Vitals. The First Input Delay (FID) metrics can be correlated to the Total Blocking Time (TBT) in a lab environment.
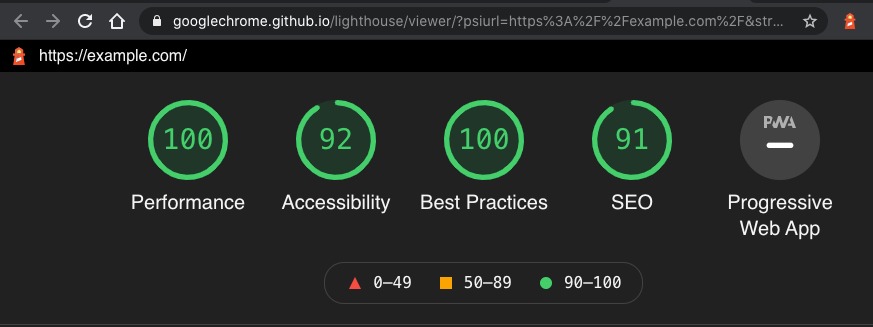
View your website through Google’s algorithm eyes, and improve your website in terms of performance, speed, seo, progressive web app and other metrics.
So with all these metrics introduced, Google Lighthouse helps you view your website through Google’s algorithm eyes, and make sure you stay up to date with latest changes in terms of performance, speed, seo and other metrics, also to focus on experience—loading, interactivity, and visual stability.
What are the Core Web Vitals?
Core Web Vitals is a subset of the Web Vitals and it tries to reflect the real world user experience. The main focus of the user experience gravitates around: loading, interactivity and visual stability of web sites.
LoadFocus is an all-in-one Cloud Testing Platform for Websites and APIs for Load Testing, Apache JMeter Load Testing, Page Speed Monitoring and API Monitoring!
Core Web Vitals Metrics:
- Largest Contentful Paint (LCP): measures loading performance. To provide a good user experience, LCP should occur within 2.5 seconds of when the page first starts loading.
- First Input Delay (FID): measures interactivity. To provide a good user experience, pages should have a FID of less than 100 milliseconds.
- Cumulative Layout Shift (CLS): measures visual stability. To provide a good user experience, pages should maintain a CLS of less than 0.1.
Ways to Measure and Report Core Web Vitals
| Tool | LCP | FID | CLS |
| Chrome User Experience Report | ✔ | ✔ | ✔ |
| PageSpeed Insights | ✔ | ✔ | ✔ |
| Search Console (Core Web Vitals report) | ✔ | ✔ | ✔ |
Tools like Lighthouse that load pages in a simulated environment without a user cannot measure FID (there is no user input). However, the Total Blocking Time (TBT) metric is lab-measurable and is an excellent proxy for FID. Performance optimizations that improve TBT in the lab should improve FID in the field (see performance recommendations below).
The performance of a site can vary dramatically based on a user’s device capabilities, their network conditions, what other processes may be running on the device, and how they’re interacting with the page. In fact, each of the Core Web Vitals metrics can have its score affected by user interaction.
Lab tools to measure Core Web Vitals
| Lab Tool | LCP | FID | CLS |
|---|---|---|---|
| Chrome DevTools | ✔ | ✘ (use TBT instead) | ✔ |
| Lighthouse | ✔ | ✘ (use TBT instead) | ✔ |
How to User Google Lighthouse?
There are a couple of ways to generate a Google Lighthouse audit:
- Google Lighthouse in Chrome Developer Tools
- Google Lighthouse as a Chrome Extension
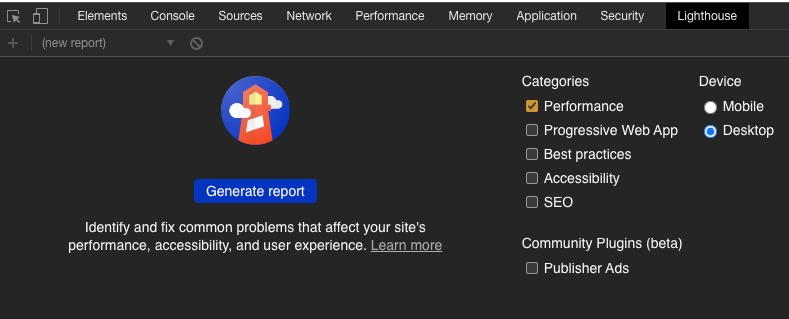
Google Lighthouse in Chrome Developer Tools
- Open the desired website in a new tab in Chrome Browser
- Open Developer tools by:
- Clicking F12 key or fn+F12
- Ctrl+Shift+J for Windows
- ⌘⌥I (Cmd+Opt+I) on Mac
- Right click on your mouse anywhere in the webpage and click Inspect
- Click “Lighthouse” from the tabs of the Developer tools
- Choose the Categories for your audits and the Device (Desktop or Mobile device)
- Click Generate Report
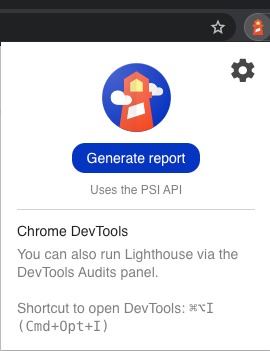
Google Lighthouse as a Chrome Extension
- Go to Lighthouse Chrome Extension link
- Click Add to Chrome
- Click on the browser toolbar on the Lighthouse extension (top-right corner)
- Click Generate Report
- Google Lighthouse Report will open in a new tab
Written by Bogdan Vazzolla.
LoadFocus is a cloud performance, load and stress testing tool which provides the infrastructure to run tests with thousands of concurrent users, from multiple cloud locations, in less than a few minutes, keep history of the results, compare different runs to inspect performance improvements or performance degradation. It also supports running JMeter load tests from the cloud.