Case Study: How Targeted Load Testing Cut API Response Times by 89%
When Slow APIs Threaten User Experience
In high-traffic applications, API response times directly shape the user experience. What starts as a minor delay can quickly escalate into a major obstacle – users notice when screens lag, support tickets increase, and engineering teams face mounting pressure to deliver improvements.
This was the reality in the cutting API response times case study. Response times had reached 1.9 seconds per request, a delay that frustrated users and risked driving them to competitors. Business stakeholders demanded faster interactions, but the team needed a solution that avoided a disruptive rebuild.
Is Your Infrastructure Ready for Global Traffic Spikes?
Unexpected load surges can disrupt your services. With LoadFocus’s cutting-edge Load Testing solutions, simulate real-world traffic from multiple global locations in a single test. Our advanced engine dynamically upscales and downscales virtual users in real time, delivering comprehensive reports that empower you to identify and resolve performance bottlenecks before they affect your users.
Finding the Real Bottleneck
The team’s first instinct was to blame the database. Instead, they implemented targeted load testing and detailed performance logging. The data revealed a surprise: 71% of delays came from slow external API calls, not the database. This insight redirected their efforts and prevented wasted time on low-impact fixes.
Small, Targeted Changes – Big Results
Armed with real metrics, the team focused on high-impact optimizations. The first breakthrough came from parallelizing independent API calls, reducing wait time for a key workflow from 1,340 milliseconds to 380 milliseconds – a 50% improvement, achieved in just 20 minutes. Next, they introduced caching for user settings and analytics summaries using Redis, eliminating redundant fetches for rarely changing data.
These focused efforts reduced average API response time from 1.9 seconds to 200 milliseconds – an 89% improvement. The key lesson: data-driven, incremental optimizations can deliver dramatic gains without major disruption.
Think your website can handle a traffic spike?
Fair enough, but why leave it to chance? Uncover your website’s true limits with LoadFocus’s cloud-based Load Testing for Web Apps, Websites, and APIs. Avoid the risk of costly downtimes and missed opportunities—find out before your users do!
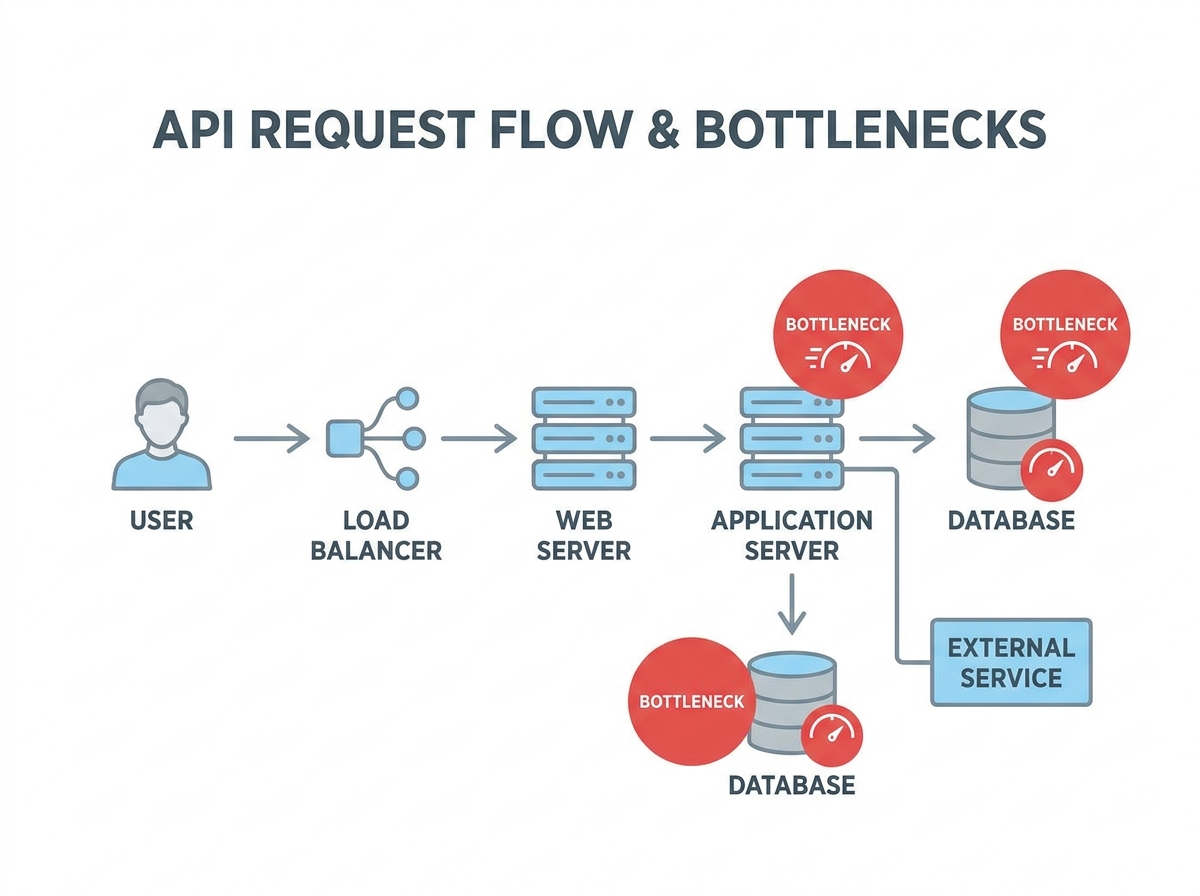
Challenge: Identifying the True Bottlenecks in API Performance
The Database Assumption – And Why It Often Fails
When API performance lags, teams often suspect the database. Complex queries and outdated indexes are common culprits in many systems. In this case, early discussions centered on SQL tuning and even switching database engines. However, this approach risked misdirecting engineering effort and leaving the real problem unsolved.
Performance logging quickly disproved the assumption. The majority of latency was traced to external API calls. This experience highlights the importance of measuring every major component before committing to optimizations.
| Assumed Bottleneck | Actual Bottleneck | Key Metric | Impact on Response Time |
|---|---|---|---|
| Database queries | External API calls | 71% of total latency | 1,340ms before optimization |
| Slow joins/indexes | Serial execution of API requests | Multiple calls not parallelized | Reduced to 380ms after parallelization |
| Cache misses | Lack of caching for settings/analytics | Repeated fetching of static data | Further cut response time after caching |
Performance Logging: The Turning Point
By instrumenting each segment of the API request lifecycle, the team pinpointed exactly where time was lost. The data showed that external API calls were the main source of delay, not the database. This clarity enabled them to focus on the most effective optimizations first.
LoadFocus is an all-in-one Cloud Testing Platform for Websites and APIs for Load Testing, Apache JMeter Load Testing, Page Speed Monitoring and API Monitoring!
Approach: Targeted Load Testing with Cloud Tools
Defining the Test Scope
Rather than running broad, generic stress tests, the team concentrated on endpoints with the slowest observed response times. Performance logs identified that analytics and user settings endpoints – both reliant on external services – were the main bottlenecks. By mirroring real-world usage patterns in their load scenarios, they ensured that their testing surfaced the most impactful issues.
Each scenario reflected actual traffic spikes and concurrency levels, yielding actionable insights that guided targeted optimizations. For example, parallelizing external API calls and adding caching delivered immediate improvements, as confirmed by follow-up testing.
| Testing Approach | Scope | Setup Time | Insights Yielded |
|---|---|---|---|
| Traditional On-Prem Load Testing | Entire API, generic traffic patterns | Several hours | Broad system health, less detail on bottlenecks |
| Cloud-Based Targeted Testing (LoadFocus) | Slowest endpoints, real-world scenarios | Under an hour | Pinpointed external call delays, validated optimizations in real time |
| Ad Hoc Local Scripts | Single endpoints, limited concurrency | 1 – 2 hours | Surface-level latency, missed multi-endpoint interactions |
Cloud Testing Platforms in Practice
Cloud-based tools like LoadFocus allowed the team to rapidly simulate production-level traffic and iterate on optimizations. After each change, they reran tests to confirm improvements, using real-time dashboards to monitor latency and response rate. The scalability of cloud testing made it easy to validate changes under realistic load, ensuring that optimizations held up in practice.
While cloud testing is highly effective for most API-centric architectures, specialized scenarios or non-internet-facing systems may still require custom setups. For the majority of use cases, however, cloud platforms now offer the speed and reliability needed for ongoing performance management.
Implementation: Metrics That Matter
Latency and Response Rate
Latency – the time a request takes to travel to the server and back – was the primary user-facing metric in this case. Starting at 1.9 seconds, the team’s optimizations brought latency down to 200 milliseconds. By instrumenting each step, they discovered that 71% of total latency was due to external API calls, leading to targeted fixes.
Response rate measures how consistently the API can handle incoming requests, especially under load. The team tracked this closely during optimizations, ensuring that improvements to speed did not compromise reliability. After parallelizing requests and adding caching, response rates remained stable, confirming that performance gains did not come at the expense of stability.
Balancing these metrics is essential: focusing on latency alone can undermine reliability, while chasing response rate without addressing speed leaves users waiting. The team’s approach prioritized improvements that advanced both metrics together.
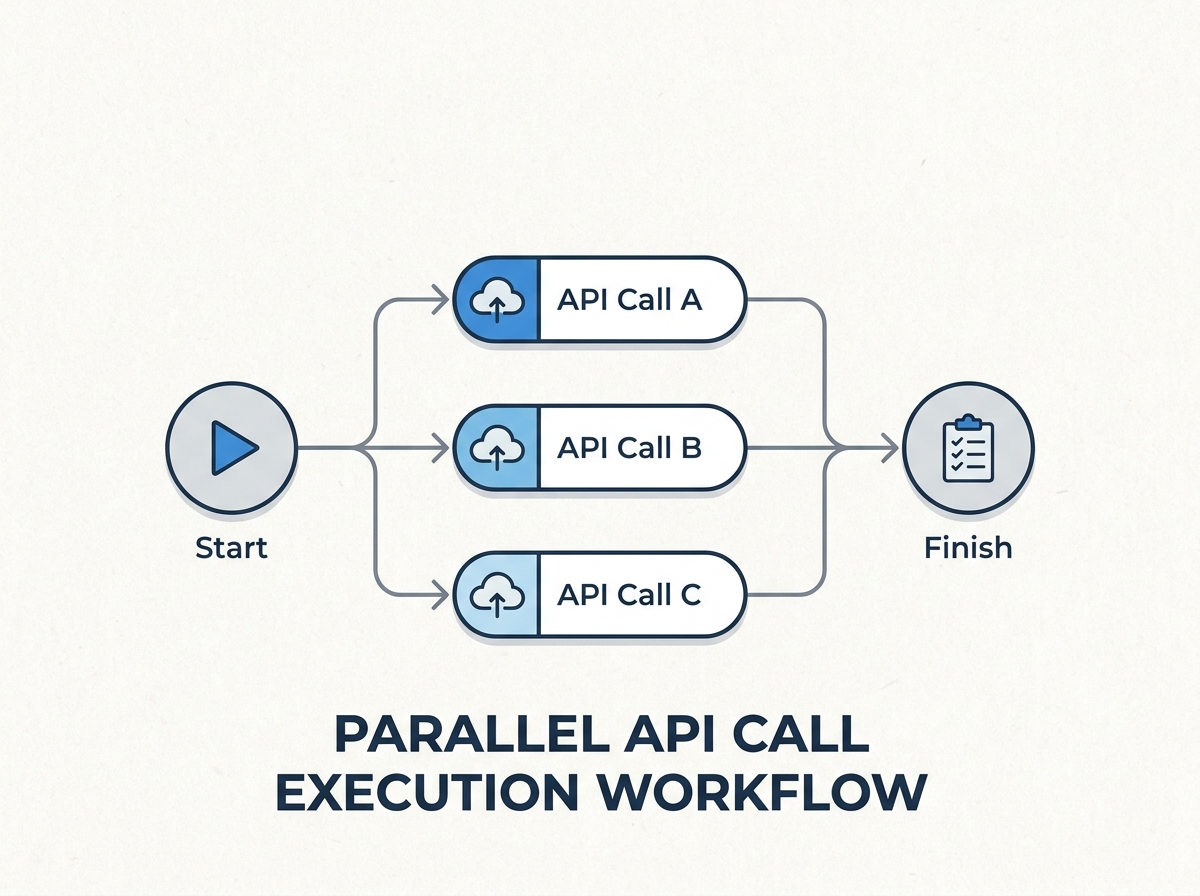
Optimization 1: Parallelizing Independent API Calls
One of the fastest ways to cut API response times is to run independent external API calls in parallel. In this case, parallelizing reduced wait time from 1,340 milliseconds to 380 milliseconds – a 50% improvement achieved in just 20 minutes, without a major rewrite.
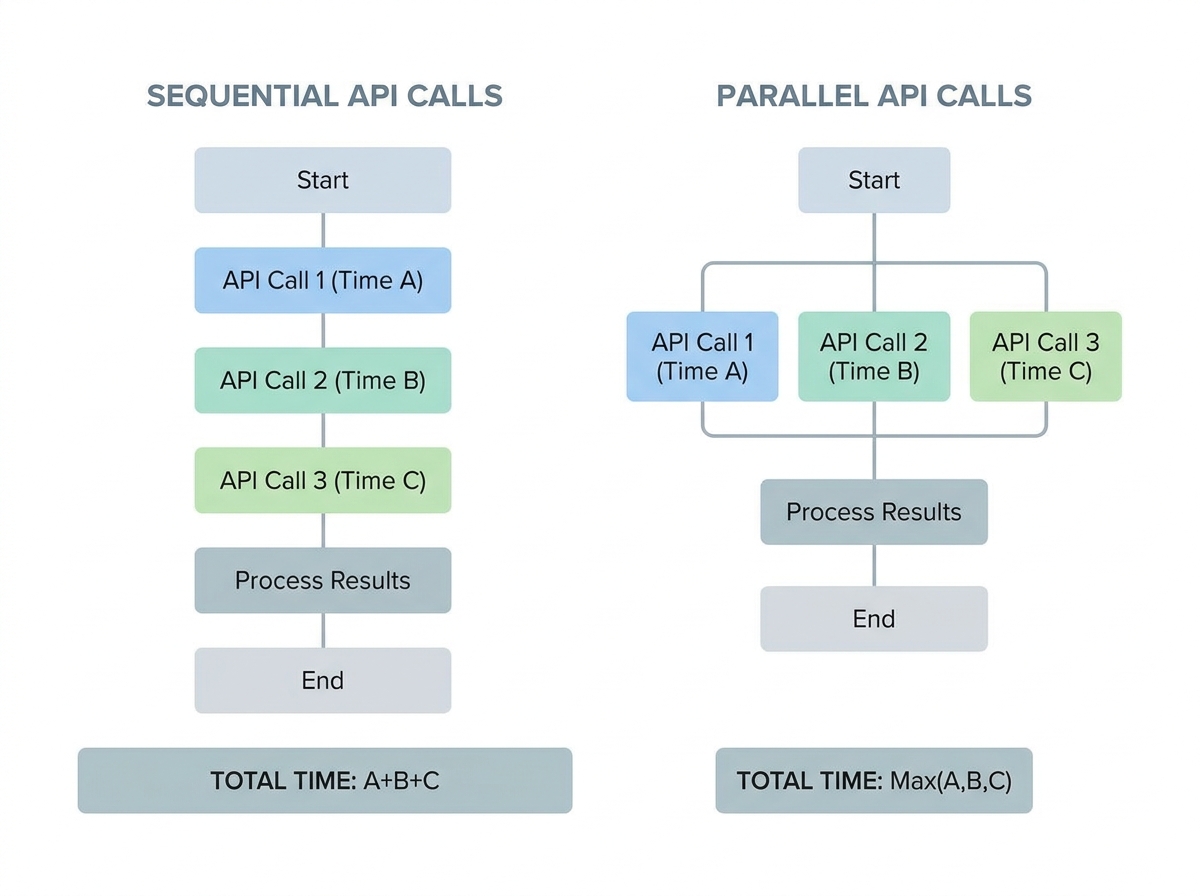
| Before | After |
|---|---|
| Sequential API Calls: Each external API was called one after another. A single slow call could delay the entire response by nearly two seconds. | Parallel API Calls: All independent APIs were called at the same time. The slowest call (380ms) became the only constraint, immediately reducing overall wait time. |
This approach works because parallelization limits total wait time to the duration of the slowest call, not the sum of all calls. For teams running regular load tests, these wins are often visible within minutes of deploying the change.
How to Identify and Implement Parallelization
Not every API call can be parallelized. The key is to identify calls that fetch unrelated data and do not depend on each other. In this case, most delays came from independent external APIs, making them ideal candidates. Use performance logs to spot sequential waits, and only parallelize calls without shared dependencies or side effects.
- Look for unrelated data fetches – such as user profiles, analytics, and notifications.
- Spot “fan-out” patterns where aggregation is needed from multiple sources.
- Check for side effects and only parallelize safe, independent calls.
Implementing parallelization is straightforward in most modern languages using concurrency primitives or async/await. Monitor for API rate limits and handle errors gracefully to avoid introducing new issues.
Optimization 2: Caching Frequently Requested Data
Choosing What to Cache
After parallelization, the next major win came from caching frequently requested, rarely changing data. In this case, user settings and analytics summaries were ideal candidates. These values changed infrequently but were fetched on nearly every request. By introducing Redis caching, the team eliminated redundant data fetches and further reduced response times.
| Before | After |
|---|---|
| Every request fetched fresh data from the external source, leading to repeated delays. | Requests first checked the Redis cache. Only if the cache was empty or expired did the API fetch new data, cutting average response times. |
The cache was configured with sensible expiration policies: user settings refreshed on profile updates, analytics summaries expired hourly. This balanced data freshness with speed, minimizing the risk of serving stale information.
- Stale data: Set realistic expiration times and clear cache on updates.
- Cache stampede: Use request coalescing or pre-warming to avoid spikes on cache misses.
- Over-caching: Focus on read-heavy, write-light data for best results.
Results: The Impact of Targeted Load Testing
Timeline of Changes
The improvements were delivered through a sequence of focused, incremental changes over several days – not a lengthy rewrite. Here’s how the timeline unfolded:
| Phase | Duration | Key Activities | Outcomes |
|---|---|---|---|
| Initial Analysis | 1 Day |
|
|
| Parallelization | 20 Minutes |
|
|
| Caching | Half Day |
|
|
| Load Testing & Monitoring | 3 Days |
|
|
The most dramatic gains came from parallelization, while caching and validation ensured improvements were strong and sustainable.
Qualitative Before/After Comparison
After these changes, API response times dropped from nearly two seconds to under a quarter of a second. Users noticed the difference immediately – support tickets about slow loading declined, and feedback highlighted the app’s new responsiveness. Developers gained confidence, relying on real performance data to guide further improvements and monitor for regressions.
Importantly, these results were achieved without major rewrites or infrastructure changes. The emphasis was on small, focused optimizations guided by measurement and validation.
Lessons Learned: Practical Insights for API Performance
The cutting API response times case study offers several transferable lessons:
- Measure before optimizing: Data-driven analysis is essential. The team avoided wasted effort by instrumenting and logging every step.
- Start with quick wins: Parallelizing independent API calls and caching stable data delivered the biggest improvements.
- Balance speed and reliability: Track both latency and response rate to ensure optimizations don’t introduce instability.
- Iterate and validate: Use targeted load testing to confirm each change, and monitor over time to sustain gains.
Pitfalls to Avoid
- Optimizing based on assumptions: Always validate bottlenecks with real data.
- Applying broad fixes: Focus on endpoints and flows where users feel the most pain.
- Neglecting external dependencies: Third-party APIs can introduce unpredictable delays.
- Assuming improvements are permanent: Regular monitoring is needed as usage patterns and dependencies evolve.
Maintaining Performance Gains
Sustaining improvements requires regular load testing and monitoring. Automate tests in your CI/CD pipeline, set alerts for latency and response rate deviations, and periodically review logs to catch new bottlenecks. As features evolve, revisit your caching strategy to ensure it aligns with current usage patterns.
These habits encourage a culture of proactive performance management, keeping your APIs fast and reliable as your system grows.
Applying Load Testing With LoadFocus: Practical Steps
Setting Up a Load Test
To replicate the success of the cutting API response times case study, start by selecting the API endpoints most critical to your application’s performance. Focus on endpoints with known delays, not the entire stack. With LoadFocus, you can configure the number of virtual users and test duration, mirroring real-world traffic patterns. Incrementally increase load to identify where latency spikes or error rates rise.
Test at different times and with varying payloads. This approach, as in the case study, exposes issues with external API calls and database latency, allowing you to target optimizations where they matter most.
Interpreting and Acting on Results
After each test, LoadFocus provides real-time analytics – including response times, error rates, and throughput by endpoint. Use these insights to guide optimizations, such as parallelizing calls or introducing caching. Ongoing monitoring ensures that improvements persist as usage evolves.
Frequently Asked Questions
How did targeted load testing identify the real API performance bottleneck?
By focusing on user-facing endpoints and implementing detailed performance logging, the team discovered that 71% of delays were due to external API calls – not the database. This data-driven approach prevented wasted effort and led directly to the most effective optimizations.
What are the most practical ways to cut API response times without major rewrites?
Start by parallelizing independent API calls and caching stable data like user settings. Both strategies can yield dramatic improvements with minimal code changes. Always measure and validate bottlenecks before optimizing.
How often should you run load tests, and how does this help maintain low response times?
Regular load testing – weekly for high-traffic APIs, monthly or per-release for more stable systems – helps catch emerging issues early. Scheduled tests and historical trend tracking ensure that latency and response rate remain within targets as your system evolves.
Why is balancing latency and response rate important?
Optimizing for speed alone can compromise reliability, while focusing only on response rate can leave users waiting. Both metrics must be tracked and balanced to deliver a consistently strong user experience.
How can you apply lessons from this case study to your own APIs?
Instrument your system to capture actionable metrics, use targeted load tests on real user scenarios, start with quick wins like parallelization and caching, and iterate based on measured results. This approach delivers sustainable improvements without major rewrites.
What are the limitations of this approach?
Not all performance problems can be solved with parallelization or caching. APIs limited by third-party dependencies or heavy computation may require different strategies. Caching also introduces complexity around data freshness and invalidation, and targeted load testing requires discipline in selecting endpoints and monitoring over time.
The cutting API response times case study demonstrates how targeted, data-driven optimizations can deliver substantial performance gains – without the need for extensive rewrites or new infrastructure. By focusing on measurement, parallelization, and caching, teams can achieve fast, reliable APIs that scale with user demand.
{“@context”:”https://schema.org”,”@type”:”FAQPage”,”mainEntity”:[{“@type”:”Question”,”name”:”How did targeted load testing identify the real API performance bottleneck?”,”acceptedAnswer”:{“@type”:”Answer”,”text”:”By focusing on user-facing endpoints and implementing detailed performance logging, the team discovered that 71% of delays were due to external API calls – not the database. This data-driven approach prevented wasted effort and led directly to the most effective optimizations.”}},{“@type”:”Question”,”name”:”What are the most practical ways to cut API response times without major rewrites?”,”acceptedAnswer”:{“@type”:”Answer”,”text”:”Start by parallelizing independent API calls and caching stable data like user settings. Both strategies can yield dramatic improvements with minimal code changes. Always measure and validate bottlenecks before optimizing.”}},{“@type”:”Question”,”name”:”How often should you run load tests, and how does this help maintain low response times?”,”acceptedAnswer”:{“@type”:”Answer”,”text”:”Regular load testing – weekly for high-traffic APIs, monthly or per-release for more stable systems – helps catch emerging issues early. Scheduled tests and historical trend tracking ensure that latency and response rate remain within targets as your system evolves.”}},{“@type”:”Question”,”name”:”Why is balancing latency and response rate important?”,”acceptedAnswer”:{“@type”:”Answer”,”text”:”Optimizing for speed alone can compromise reliability, while focusing only on response rate can leave users waiting. Both metrics must be tracked and balanced to deliver a consistently strong user experience.”}},{“@type”:”Question”,”name”:”How can you apply lessons from this case study to your own APIs?”,”acceptedAnswer”:{“@type”:”Answer”,”text”:”Instrument your system to capture actionable metrics, use targeted load tests on real user scenarios, start with quick wins like parallelization and caching, and iterate based on measured results. This approach delivers sustainable improvements without major rewrites.”}},{“@type”:”Question”,”name”:”What are the limitations of this approach?”,”acceptedAnswer”:{“@type”:”Answer”,”text”:”Not all performance problems can be solved with parallelization or caching. APIs limited by third-party dependencies or heavy computation may require different strategies. Caching also introduces complexity around data freshness and invalidation, and targeted load testing requires discipline in selecting endpoints and monitoring over time. The cutting API response times case study demonstrates how targeted, data-driven optimizations can deliver substantial performance gains – without the need for extensive rewrites or new infrastructure. By focusing on measurement, parallelization, and caching, teams can achieve fast, reliable APIs that scale with user demand.”}}]}