Key Takeaways
Start With a Baseline
Before running any load tests, establish a clear memory usage baseline under normal operating conditions. This gives you a concrete reference point. If memory usage jumps significantly during stress tests, you can reliably spot abnormal growth and direct your investigation efficiently.
Combine Profilers and Heap Analysis
No single tool tells the whole story. Profiling tools help you track object allocations and flag suspicious patterns, but pairing them with heap dump analysis exposes the root cause of memory leaks. For example, using Java VisualVM or .NET Memory Profiler during load can reveal objects that persist in memory unexpectedly.
Is Your Infrastructure Ready for Global Traffic Spikes?
Unexpected load surges can disrupt your services. With LoadFocus’s cutting-edge Load Testing solutions, simulate real-world traffic from multiple global locations in a single test. Our advanced engine dynamically upscales and downscales virtual users in real time, delivering comprehensive reports that empower you to identify and resolve performance bottlenecks before they affect your users.
Automate Detection in CI Pipelines
Manual checks aren’t enough – integrate automated memory leak checks into your CI pipeline. This approach is now a best practice, catching regressions before they slip into production. If you’re looking to systematize performance safeguards, consider approaches outlined in our guide to integrating performance testing with DevOps toolchains.
Separate Leaks from Legitimate Growth
Not all memory growth signals trouble. Some applications use caching or buffering under load, which naturally increases memory usage. The challenge is to distinguish genuine memory leaks from legitimate patterns. Monitoring tools – especially when paired with real-time telemetry – can help you avoid chasing false alarms. For additional strategies, see our comparison of real-time API monitoring tools.
Addressing memory leaks demands a mix of methodical measurement, the right tooling, and continuous vigilance. As applications grow more complex, these habits become non-negotiable for teams who care about reliability and performance.
Think your website can handle a traffic spike?
Fair enough, but why leave it to chance? Uncover your website’s true limits with LoadFocus’s cloud-based Load Testing for Web Apps, Websites, and APIs. Avoid the risk of costly downtimes and missed opportunities—find out before your users do!
Why Memory Leaks Derail Load Testing Success
When Subtle Flaws Become Expensive Failures
Imagine your team is running a week-long load test on a new API endpoint. Early results look promising, but on day three, response times creep upward, and the service grinds to a halt. Hours are spent combing through logs before the culprit emerges: a memory leak – a bug that quietly allocates memory without releasing it. Once discovered, the test results are compromised, time is lost, and confidence in the release is shaken.
This scenario is common. Up to 30% of performance issues observed during load testing are caused by memory leaks. The real danger? Subtle leaks rarely surface during short manual tests or basic QA cycles. They often appear only under sustained, high-concurrency traffic – precisely the environment simulated by load testing platforms designed for thorough analysis.
The Cost of Undetected Leaks Under Load
Undiagnosed memory leaks undermine application reliability in unpredictable and costly ways. Over time, the gradual accumulation of unreleased memory can cripple server processes, crash containers, and trigger cascading failures in distributed architectures. Leaks also drive up infrastructure costs by forcing teams to overprovision resources for what appears to be “peak” usage but is actually inefficient memory churn. In cloud-native and microservices-based systems, this inefficiency multiplies as loads scale out across many instances.
What makes memory leaks especially challenging is their ability to hide in plain sight. Languages with automatic garbage collection, like Java or C#, are not immune – they simply make the underlying issue more subtle. Leaks often stem from missed object dereferences, lingering event listeners, or unclosed resources that even experienced developers can overlook. As Mark Seemann notes, these leaks “go unnoticed until they cause significant problems under load.”
LoadFocus is an all-in-one Cloud Testing Platform for Websites and APIs for Load Testing, Apache JMeter Load Testing, Page Speed Monitoring and API Monitoring!
Proactivity Beats Firefighting
Relying on manual checks or post-mortem debugging is a losing strategy when performance is on the line. Teams that embed memory profiling tools and automated leak detection into their load testing workflow save themselves hours of high-stakes troubleshooting after deployment. This approach is especially crucial for organizations aiming to make continuous performance testing a standard part of development.
By treating memory leak detection as an integral part of performance engineering, you reduce firefighting, boost application resilience, and keep infrastructure costs in check. In load testing, what you can’t see will hurt you – so invest in the right tools and practices to expose leaks before they become tomorrow’s production outage.
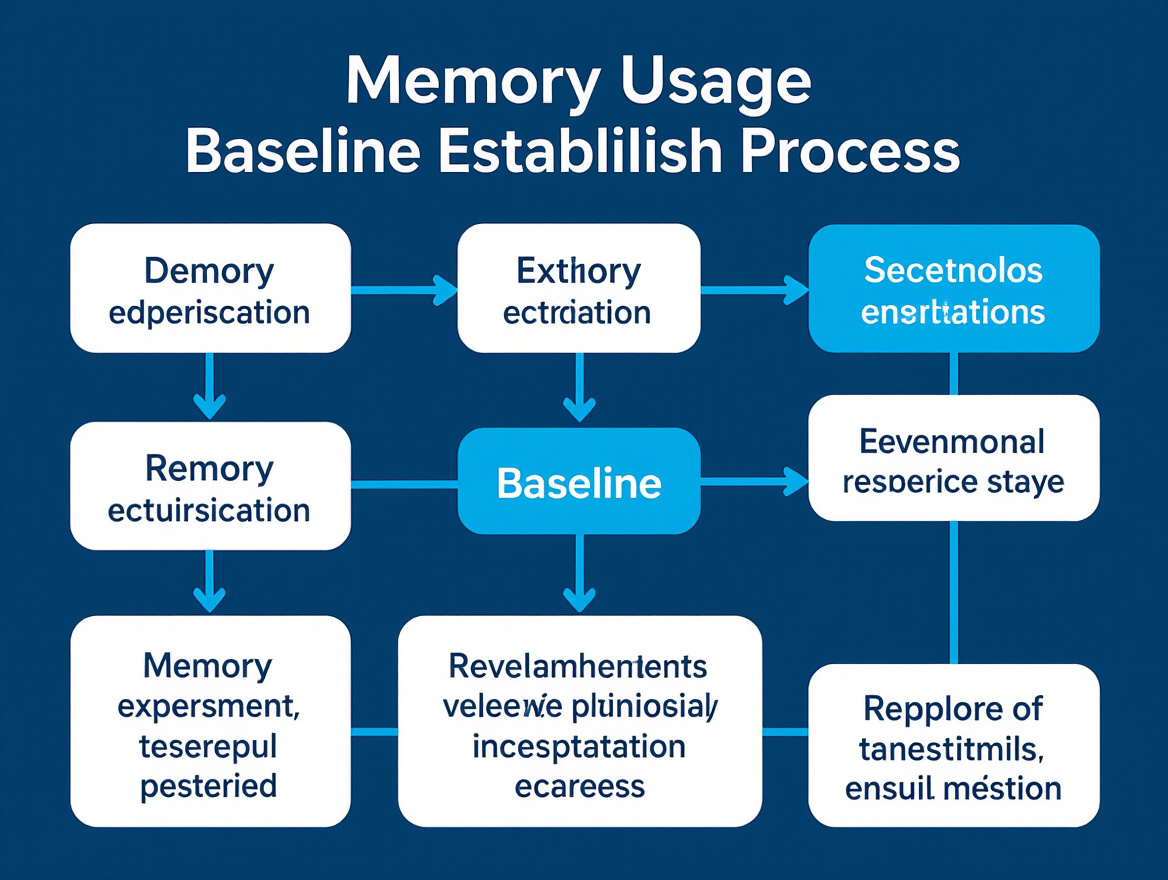
Step 1: Establish a Baseline for Memory Usage
If you want to spot memory leaks before they spiral into production incidents, you need a solid baseline. Skipping this step is the fastest route to false alarms and wasted hours. A baseline shows what “normal” memory consumption looks like before you apply any load – idle, nominal traffic, and after user activity. This is the reference point that lets you separate legitimate memory growth (like caching or buffering) from actual leaks that chip away at app stability.
Key Insight: Without a clear baseline, distinguishing memory leaks from expected usage spikes is nearly impossible – guesswork replaces diagnosis.
Start by running your application in a controlled, isolated environment. This means no other major processes, no background jobs, and no leftover resource hogs from previous tests. If you’re using cloud infrastructure, spin up a clean instance with only your app and its dependencies.
Monitor memory usage during periods of:
- Idle: Just after startup, before any user or automated traffic.
- Nominal load: Typical daily activity, light user simulations or API calls.
- Post-load: After sustained activity, but before the system fully recovers.
Multiple tools help here. Cloud providers offer monitoring dashboards (AWS CloudWatch, Azure Monitor), and platforms like LoadFocus provide integrated performance insights alongside your load tests. For granular details, lightweight profilers – such as Java VisualVM or .NET Memory Profiler – let you watch heap and non-heap memory allocation in real time. For modern microservices, open-source options like LeakCanary help track leaks in distributed systems as well.
Common mistakes? They’re avoidable if you stay vigilant:
- Sampling memory for just a few minutes instead of capturing long enough to spot slow leaks
- Running tests on shared servers where “noise” from other apps pollutes your data
- Failing to reset the environment between runs, which leaves orphaned processes behind
| Check Item | What to Look For | Why It Matters |
|---|---|---|
| Idle Baseline | Stable memory usage after startup, before traffic | Highlights initial footprint and static allocations |
| Nominal Load Baseline | Memory plateaus or predictable small increases with light activity | Distinguishes between healthy usage and early leaks |
| Post-Load Snapshot | Returns close to nominal or idle after load stops | Shows whether temporary spikes are cleaned up |
| Environment Isolation | No unrelated processes consuming memory | Prevents false positives from system “noise” |
| Sample Duration | Baseline covers hours, not just minutes | Detects slow, creeping memory leaks |
Choosing the Right Baseline Metrics
Not all memory metrics are created equal. If your goal is to root out memory leaks, focus on metrics that expose long-term growth and inefficient resource retention:
- Heap Memory: Tracks memory used for object allocation in managed runtimes (Java, .NET). Unexplained growth here usually signals leaks from forgotten object references or static collections.
- Non-Heap Memory: Includes buffers, code caches, and permgen/metaspace. Leaks may hide here, especially with excessive classloading or native libraries.
- GC Activity: Sudden increases in garbage collection frequency, or a rise in time spent in GC, suggest that the runtime is struggling to reclaim memory.
- Swap Usage: If your process pushes the system to swap, this often surfaces as a late-stage symptom of a leak – your app is using more physical memory than available.
Cross-reference these metrics during and after load tests. A healthy system shows memory growth with activity, but returns close to baseline once the load subsides. If you see a steady upward trend – especially after the load has stopped – that’s a red flag. For a deeper dive into how cloud-only monitoring can miss these cues, check out our breakdown of cloud-based vs on-premise website monitoring.
Setting a precise, context-aware baseline is the single most effective way to make memory leak detection actionable instead of anecdotal. The rigor you invest here pays off when the real load hits – and your monitoring catches issues before they become outages.
Step 2: Run Controlled Load Tests to Stress the Application
To surface memory leaks before they impact production, move beyond short, burst-style load tests. Brief spikes and unrealistic traffic patterns rarely reveal the subtle, cumulative memory issues that can destabilize a system. Instead, design endurance-style load tests – tests that gradually ramp up and sustain real-world usage over hours, not minutes. This approach uncovers incremental memory growth that signals a true leak.
Platforms like LoadFocus allow you to simulate hundreds or thousands of concurrent users over extended periods, providing real-time insights into resource consumption and enabling you to correlate memory usage with specific traffic profiles. This is especially critical as more teams adopt cloud-native architectures and microservices, where memory management is less predictable and leaks are more insidious. For a refresher on endurance (soak) tests, see the detailed guide on what is endurance testing (soak testing).
Key Insight: The only way to reliably catch memory leaks is with controlled, long-duration load tests that align closely with real user behavior.
Designing Load Scenarios for Leak Detection
The core of any effective leak detection test is a realistic load scenario. Carefully plan the following:
- User concurrency: Analyze your peak traffic patterns and simulate the actual number of users your service expects at its busiest. LoadFocus lets you orchestrate and scale these numbers easily in the cloud, matching your usage forecasts.
- Session patterns: Mimic authentic user journeys. Real users log in and out, idle, and perform different actions at varying intervals. Script these flows and ensure your test isn’t just hammering one endpoint. This helps surface leaks tied to specific workflows, not just generic traffic.
- Test duration: Avoid the mistake of running tests for only 15 minutes. Memory leaks rarely show up that quickly. Industry experience and LoadFocus best practices recommend at least 2 – 4 hours of sustained activity, with longer tests for mission-critical systems. This is the only way to reveal gradual, creeping memory growth.
Control for environmental variables by using dedicated, consistent test infrastructure for every run. Background system jobs, patching windows, or overlooked monitoring agents can either hide or exaggerate memory usage, muddying your results. Recent analysis highlights how subtle differences in container orchestration or VM sizing can impact memory profiles. Keep your environment stable and document all variables before starting endurance tests.
Finally, tie your load profile directly to how users actually use your system. For media streaming services, simulate thousands of users starting, pausing, and switching streams. For SaaS apps, create patterns that reflect realistic business workflows throughout the day. The closer your test matches production reality, the more confidence you’ll have that any memory leak you find is a real operational risk – not just a test artifact.
Short, artificial tests provide a false sense of security. Only endurance-style, controlled load scenarios – like those you can run and monitor with LoadFocus – put your application’s memory management under the microscope it deserves. For more on integrating this approach with modern DevOps workflows, see LoadFocus’s guide to integrating performance testing with DevOps toolchains.
Step 3: Monitor Real-Time Memory Metrics During the Test
Selecting Monitoring Tools for Load Testing
Real-time monitoring during a load test is essential for catching memory leaks before they escalate into production outages. Cloud environments require tools that can keep pace with containerized workloads and distributed deployments. Java VisualVM remains a go-to profiler for JVM-based applications, allowing you to visualize heap usage, object allocation, and garbage collection activity live. For .NET, .NET Memory Profiler offers similar depth – tracking reference chains and highlighting objects not eligible for collection.
For cloud-native teams, platforms like LoadFocus integrate memory monitoring with load test orchestration, letting you overlay memory graphs atop load spikes and surface correlations at a glance. If you’re testing mobile or microservices stacks, open-source profilers such as LeakCanary (for Android) and Heapster (for Kubernetes) extend this visibility to distributed environments. Many performance teams now plug memory profilers into their CI/CD pipelines, a practice covered in detail in our DevOps integration guide.
Key Memory Metrics and Leak Indicators
Effective monitoring starts with continuous visibility into all stages of the test. Baseline memory usage alone won’t suffice – what matters is how metrics behave as load ramps up, plateaus, and subsides. Live dashboards can reveal subtle trends that static post-test reports miss. The table below highlights which metrics to watch and how to spot abnormal patterns that point to memory leaks.
| Metric | Normal Pattern | Leak Indicator |
|---|---|---|
| Heap Memory Usage | Oscillates with GC cycles; returns close to baseline after each major GC event | Steadily climbs over time, never dropping to prior levels even after GC |
| Object Count | Rises during load, then stabilizes or drops post-GC | Consistently increases or flat-lines at a new high, with no significant reduction |
| Garbage Collection Frequency | GC events become more frequent with load, but intervals remain predictable | GC becomes increasingly aggressive, yet memory usage does not decrease |
| Resident Set Size (RSS) | Stays within a reasonable range as application scales | Grows steadily, often outpacing expected workload-driven changes |
| Thread Count | Stable, with minor fluctuations during high concurrency | Gradual, unexplained increase may indicate threads holding onto memory |
Live monitoring lets you correlate these memory metrics with specific load test events – such as traffic spikes, error bursts, or new feature toggles. For example, if heap usage spikes immediately after a particular API call and never recovers, the culprit may be a code path that allocates but never releases memory. Teams using LoadFocus can overlay these graphs with load curves and response times, making root cause analysis more actionable. For a deeper comparison of real-time monitoring tools, see our API performance monitoring roundup.
Without continuous visibility, slow, creeping leaks can hide until they cause catastrophic failures. A disciplined approach – combining dashboards, profilers, and integrated load testing – prevents missed signals and supports effective diagnosis long before code hits production.
Step 4: Profile and Analyze Heap Dumps for Memory Leaks
Capturing and analyzing heap dumps is the most direct way to uncover memory leaks hiding beneath the surface of your application. Heap dumps offer a snapshot of your application’s memory at a given point, exposing the actual objects and references responsible for uncollected memory. By collecting dumps at intervals during load testing, you can spot problematic growth and track down exactly where memory is accumulating.
Modern memory profilers like Java VisualVM, .NET Memory Profiler, and open-source tools such as LeakCanary provide granular views of heap contents, making it easier to identify stuck objects, reference chains, and oversized collections. The process is straightforward: run your load test, capture a heap dump at baseline, then collect additional dumps as the test continues. Comparing these snapshots helps isolate which objects persist unexpectedly and which references are preventing their release.
Key Insight: Effective heap dump analysis transforms memory leaks from a guessing game into a methodical, evidence-driven process.
How to Capture and Analyze Heap Dumps
During a load test, collect heap dumps at regular intervals – ideally before the test, during peak load, and after the load subsides. This cadence shows how memory usage evolves under stress, and helps clarify the difference between legitimate memory growth (such as caching) and true leaks.
- Baseline dump: Capture before starting the load test. This is your control for normal memory use.
- Mid-test dump: Take at peak load, when leaks are most likely to manifest.
- Post-test dump: Grab after the load ends, to check if extra memory is released.
Load the dumps into your profiling tool. Focus on:
- Objects with high instance counts that persist across dumps (especially custom classes or collections).
- Reference chains leading from root objects (like static fields or singletons) to the leaked instances.
- Large collections (e.g., Lists, Maps) that keep growing, often due to missing cleanup logic.
In complex, distributed systems, heap analysis requires extra discipline. Microservices can introduce cross-process leaks or resource contention that’s tough to trace. For practical strategies in these scenarios, the Guide to Load Testing Microservices Architectures in Cloud Environments (2026 Edition) provides a detailed roadmap for tackling distributed memory issues.
Before/After Example: Heap Dump Analysis
| Before | After |
|---|---|
|
Weak Example: “After running a load test, the heap dump showed some objects were not being garbage collected.” |
Strong Example: “In the pre-fix heap dump, the OrderCache Map contained 40,000 entries, with customer session objects still referenced from a static field – even after sessions were closed. Post-fix, the heap dump revealed the Map size stabilized at around 1,000 entries, and session objects were released as expected once orders completed.” |
The improved example is specific: it names the leaking object (OrderCache Map), describes the reference pattern (static field holding session objects), quantifies the leak (40,000 entries), and demonstrates the fix (Map size reduction and expected object release). This level of detail is what turns a heap dump from noise into an actionable diagnostic tool.
Common Leak Patterns in Heap Dumps
Some leak patterns appear again and again in real-world systems. During analysis, keep an eye out for these recurring culprits:
- Static collections: Maps or Lists attached to static fields often accumulate objects indefinitely because their lifecycle matches the application.
- Unreleased event listeners: Listeners registered to UI components or application events but never removed, causing the observed objects to persist in memory.
- Unclosed resources: Database connections, files, or sockets left open tie up memory through their underlying buffers and sometimes thread objects.
- Caching gone awry: Legitimate caches that never evict entries due to misconfigured policies or logic bugs, leading to gradual growth.
- ThreadLocal misuse: Objects stored in ThreadLocals can persist as long as their threads do, especially in thread pools, resulting in subtle leaks that are hard to diagnose.
Every one of these patterns has tripped up even experienced teams – especially when load testing multi-service or cloud-native applications. For more on integrating memory profiling into a pipeline designed for reliability, see Guide to Integrating Performance Testing with DevOps Toolchains (2026 Edition).
Heap dump analysis, when applied methodically, provides concrete evidence of memory leaks and validates whether your fixes are working. Sometimes you’ll find ambiguous growth caused by legitimate factors like caching or traffic spikes. But with a disciplined approach and the right tools, you can root out real leaks long before they threaten production stability or inflate your cloud bill. For teams invested in performance testing and cloud testing, this is a core competency that pays off every sprint.
Step 5: Automate Memory Leak Detection in CI/CD Pipelines
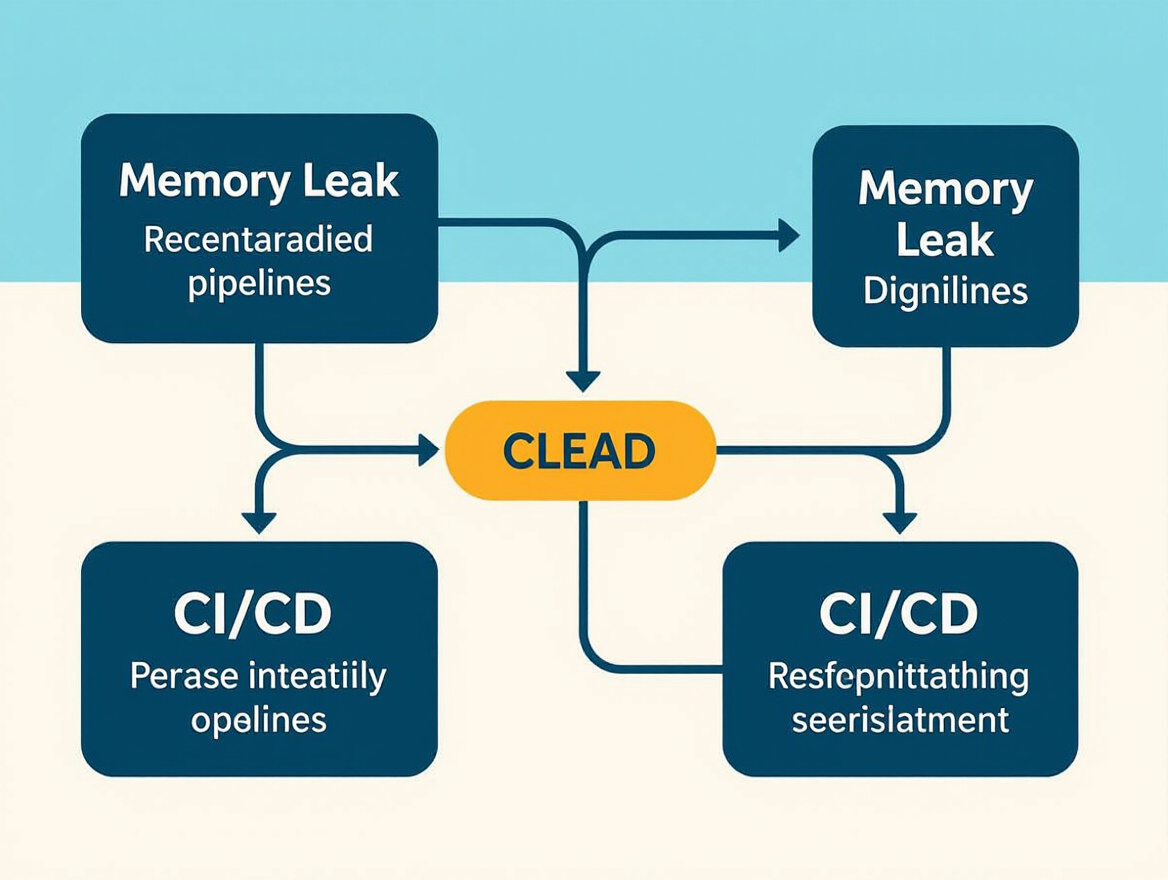
Integrating memory profiling and leak detection into your automated test runs is now essential for teams building modern, cloud-native systems. The complexity of microservices, ephemeral infrastructure, and distributed state makes it easy for memory leaks to slip past local testing. When these issues make it to production, the consequences range from sluggish response times to full-blown outages – especially under load.
Key Insight: Automating memory leak detection in CI/CD pipelines is the most effective way to prevent subtle regressions from undermining application performance before code reaches production.
Why Early, Automated Detection Matters
Manual leak detection – running a profiler locally, checking heap dumps by hand – simply doesn’t scale. By the time a human spots a memory leak, it’s often already caused instability in staging or production. CI-integrated profiling flips that dynamic: leaks are identified and flagged as soon as they appear, often before any user ever experiences an issue.
When you run memory profiling tools as part of your CI/CD pipeline, you gain:
- Rapid feedback on new leaks introduced by recent code changes
- Consistent thresholds for memory usage and leak detection, enforced automatically
- Actionable alerts – failures or warnings that trigger when memory anomalies are detected, preventing faulty builds from being promoted
This is especially important if you’re already investing in performance and API monitoring or load testing. Integrating memory leak checks into your existing DevOps workflows closes a crucial gap: it ensures your system doesn’t just pass functional tests, but remains healthy under real-world stress. For deeper strategies on aligning performance and CI/CD, LoadFocus’ Guide to Integrating Performance Testing with DevOps Toolchains (2026 Edition) is a strong reference for advanced teams.
Actionable Playbook: Setting Up Automated Leak Checks
- Establish a baseline: Profile a known-good version of your application under normal load. Capture key metrics – heap usage, object retention, garbage collection frequency – using a profiler like Java VisualVM, .NET Memory Profiler, or an open-source tool relevant to your stack. These metrics form your “healthy” reference point.
- Integrate profiling into test suites: Add a memory profiler invocation to your automated test jobs. For example, configure your pipeline to launch the application with profiling enabled during integration or load test stages. Ensure heap snapshots or memory allocation logs are captured at logical points – before, during, and after the test run.
- Define thresholds and anomaly criteria: Set rules for what constitutes a leak or suspicious growth. This might include “no more than X% heap growth during test,” “no uncollected objects of type Y,” or “no consistent upward trend in memory usage.” Not all increases are leaks – consider legitimate buffers or caches, as discussed in troubleshooting sections elsewhere in this guide.
- Automate alerting and build failures: Use your CI/CD platform’s reporting features to fail builds or raise alerts if memory thresholds are breached. Many modern profilers can output machine-readable logs; connect these results to your test runner or use scripts to parse and interpret them.
- Review and refine: As your architecture evolves, revisit your baseline and thresholds. Monitor for false positives, especially after introducing caching, new frameworks, or third-party components. The goal is to catch genuine leaks, not to block legitimate changes.
Teams using platforms like LoadFocus for cloud-based load testing can enhance this approach by correlating load test results with memory health data, flagging leaks that only appear under specific stress scenarios. Combining automated leak detection with continuous performance monitoring ensures your application remains resilient – even as usage patterns shift or the codebase evolves.
Automated memory leak detection isn’t just about shipping “clean” code – it’s a foundational discipline for any team serious about scalability and reliability in 2026.
Step 6: Apply Code Best Practices to Prevent Future Memory Leaks
Preventing memory leaks at the source is always more efficient than chasing them down after damage is done. Once an application is in production – or even just under heavy load in a test environment – a single overlooked code pattern can snowball into outages and costly firefighting. Building a habit of code-level diligence, reinforced by focused code reviews, is your best defense.
Top Memory Leak Prevention Practices
Start with proper resource management. Every file stream, network connection, or database cursor you acquire must be released, no matter how short-lived you expect the object to be. Relying solely on automatic memory management, like garbage collection in Java or .NET, won’t protect you if you keep unnecessary references alive. For example, static fields holding large objects can prevent memory from being reclaimed, causing insidious leaks that evade detection until the system is under significant stress.
Use weak references where appropriate, particularly for caching or observer patterns. This allows the garbage collector to reclaim memory when no strong references exist. Event listeners are another classic trap: if you register a listener but never remove it, the system may retain the entire object graph, especially in UI-heavy or asynchronous applications. A disciplined approach – such as always unregistering listeners in cleanup methods – can prevent these leaks from accumulating over time.
It’s not just about the code you write, but the environment where it runs. The deployment model can influence leak-prone patterns. For example, long-running server processes in cloud load testing scenarios may surface leaks that never appear during brief local tests. See Cloud Load Testing vs Local Load Testing for Enterprises: A 2026 Comparison for a detailed breakdown of how deployment choices affect memory management risks and code review priorities.
Code reviews focused on memory management can catch subtle issues before they escalate. Use profiling tools proactively during development and integrate memory analysis into your continuous integration pipeline. For more on automating this process, check out the Guide to Integrating Performance Testing with DevOps Toolchains (2026 Edition). Ultimately, the goal is to prevent leaks from ever reaching production, rather than reactively patching them after users are impacted.
Memory Leak Prevention Code Review Checklist
| Check Item | What to Look For | Why It Matters |
|---|---|---|
| Resource Disposal | Are all file streams, sockets, and database connections explicitly closed or disposed? | Unreleased resources can consume memory indefinitely, leading to gradual leaks that often go unnoticed until under load. |
| Static References | Are you avoiding static fields that reference large objects or collections? | Static references persist for the lifetime of the application, so leaks here are persistent and cumulative. |
| Event Listener Management | Are event listeners unregistered when no longer needed (e.g., on component unmount or object disposal)? | Lingering listeners can keep entire object graphs in memory, especially in UI or real-time systems. |
| External Library Usage | Are third-party libraries known for proper memory management, and are you using their APIs correctly? | Poorly managed libraries or improper use can introduce leaks outside your direct control. |
| Object Lifecycle Documentation | Is the ownership and lifecycle of objects clearly documented in code comments? | Clear documentation helps reviewers spot patterns that might lead to leaks, especially in complex codebases. |
| Profiling Integration | Are you using memory profilers as part of the development workflow? | Profilers can surface subtle retention issues that manual review might miss, especially when combined with load testing. |
Strong memory hygiene is as much about discipline as it is about tooling. By weaving these practices into your daily development and review cycles, you’ll save your team from late-stage fire drills and build software that handles load with confidence. For a deeper look at how complex deployment environments shape these coding standards, the Emerging Cloud Testing Standards post offers current perspectives from across the industry.
Step 7: Monitor for Memory Leaks in Production Environments
You can catch many memory leaks during controlled load tests, but the harsh reality is that some only appear once your code faces the unpredictable mix of real-world production traffic. Users don’t follow your test scripts or stick to predictable workflows. Unusual edge cases, rare API calls, and long-lived sessions can all contribute to leaks that never show up in pre-release environments. That’s why continuous monitoring is not just a nice-to-have – it’s essential for keeping your systems reliable under actual load.
Even the most comprehensive test suite can’t simulate every usage pattern, making runtime monitoring a critical safety net. When a leak slips through to production, the consequences can be severe: gradual slowdowns, unexpected crashes, and spiraling infrastructure costs as memory consumption creeps up over days or weeks.
Ongoing monitoring closes the detection gap by tracking memory usage trends over time, surfacing issues that don’t fit neatly into a single test window. It’s not enough to rely on snapshot metrics or ad-hoc health checks. You need trend analysis – watching for slow, steady increases in process memory, which are the classic signature of a leak rather than a legitimate memory spike from caching or traffic bursts.
Top-tier monitoring solutions offer both real-time detection and long-term analytics. Many of the tools highlighted in this recent LoadFocus post on API monitoring support custom memory metrics, integration with alerting platforms, and historical reporting. Combining these with your existing load and performance tests, as covered in the 2026 guide to performance testing cloud-native applications, creates a full lifecycle memory management strategy.
Setting Up Memory Usage Alerts
In production, set up both threshold-based alerts and anomaly detection for memory usage. Threshold alerts are straightforward: set a baseline by observing typical memory consumption during steady-state operation, then trigger an alert if usage exceeds this baseline by a significant margin for a sustained period. This approach helps you catch rapid leaks or runaway processes early.
However, subtle leaks require more nuanced detection. Anomaly detection tools can analyze historical usage patterns and raise alarms when memory increases gradually but consistently over hours or days. Look for monitoring platforms that support trend-based alerting rather than just reacting to spikes. The best results come from combining these two approaches – thresholds for immediate incidents, and trending analysis for the slow burns that can be even more damaging in the long run.
Ultimately, catching memory leaks in production is about vigilance. By putting alerting and trend analysis in place, you protect your applications from subtle degradations that can undermine user experience and reliability.
Troubleshooting: When Memory Growth Isn’t a Leak
Key Indicators of Legitimate Memory Growth
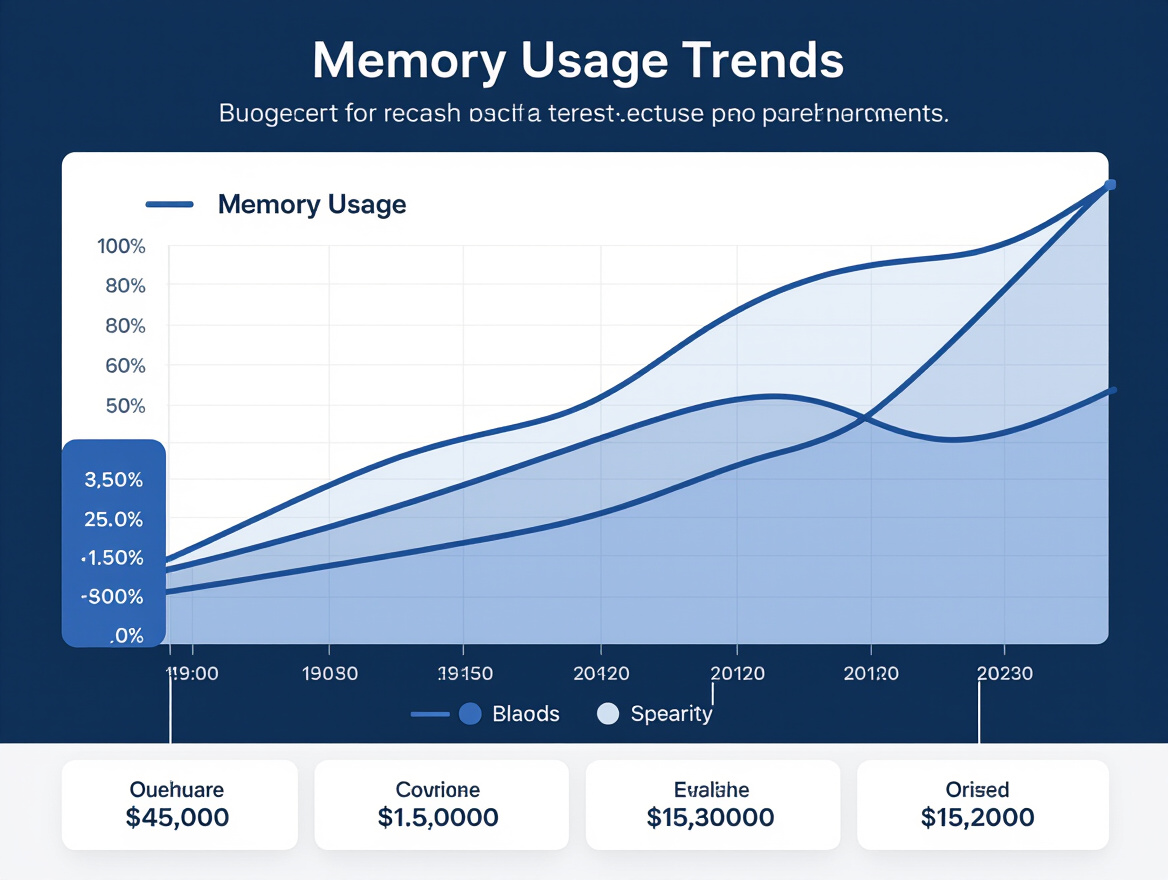
When you spot increasing memory usage during a load or stress test, it’s tempting to jump straight to talk of memory leaks. But not every uptick in resource consumption is a problem. Modern applications – especially those built around microservices and cloud-native architectures – often rely on aggressive caching and buffering to deliver acceptable performance at scale. If your application is designed to cache database query results or buffer network traffic, it’s normal to see memory usage climb as load increases, then level off when the cache is full or peak load subsides.
What matters is the pattern. Healthy memory growth typically shows a “stair-step” shape: usage rises quickly as the cache fills, then stabilizes. When the workload drops, memory usage may hold steady, reflecting retained data in cache for faster future access. This is especially true for cloud-based apps focused on performance optimization, where caching is an intentional design choice.
Compare that to a memory leak, where usage climbs steadily with no plateau, eventually leading to out-of-memory errors or process restarts. Distinguishing these two scenarios requires real-world context and an understanding of your application’s memory strategies.
Diagnosing Ambiguous Memory Growth
If you’re unsure whether the memory growth you’re seeing is justified, start with a clear baseline memory profile under light or idle conditions. Run controlled load tests and watch for a leveling off in memory usage – this usually indicates healthy caching or buffering. If growth continues without stabilization, it’s time to dig deeper.
- Profile memory allocations using tools like Java VisualVM or .NET Memory Profiler. Look not just for objects that accumulate, but for those that persist across requests or sessions.
- Capture heap dumps at intervals during testing. Compare them to isolate retained objects that shouldn’t be around.
- Review application code for explicit caching mechanisms, buffer pools, or connection pools. Are these configured to release resources, or are they holding on to memory indefinitely?
- Integrate real-time memory monitoring into your CI/CD process. This approach, as covered in our guide to microservices load testing in cloud environments, helps catch leaks and distinguish them from healthy memory growth during automated test runs.
Pay attention to how the application behaves under varying traffic patterns. If memory spikes only under rare edge cases or specific loads, you may be seeing cache adaptation rather than a leak.
Why Aggressive GC Tuning Isn’t a True Fix
It’s common to tweak garbage collection settings in hopes of taming memory usage graphs. While this might delay the symptoms, GC tuning only postpones the inevitable if there’s a real leak. You might see memory reclaimed more frequently or pauses grow shorter, but if the application is holding references it doesn’t need, no amount of tuning will solve the root problem.
Instead, use profiling and heap analysis to find and fix memory leaks at the source. Think of GC tuning as fine-tuning for performance after you’ve verified the application’s memory usage is fundamentally healthy – not as a workaround for poor memory management.
The difference between a true memory leak and intentional memory usage often comes down to context, observation, and the right tooling.
Summary Checklist
A disciplined approach to memory leak detection is essential for reliable load testing and production stability. Use this table to self-audit your workflow and sidestep the most common pitfalls at each stage of the process.
| Step | Objective | Key Pitfall to Avoid |
|---|---|---|
| Establish Baseline Memory Usage | Document initial memory footprint under normal load | Skipping this step makes it impossible to spot abnormal memory growth later |
| Run Controlled Load Tests | Stress the application to reveal latent memory leaks | Using unrealistic workloads can hide genuine issues |
| Monitor Real-Time Memory Metrics | Track RAM usage and garbage collection activity | Ignoring spikes or only monitoring averages can miss critical leaks |
| Profile and Analyze Heap Dumps | Pinpoint leaking objects and reference chains | Failing to capture heap dumps at the right intervals may overlook intermittent leaks |
| Automate Leak Detection in CI/CD | Catch regressions before code reaches production | Not integrating automated checks allows leaks to slip through unnoticed |
| Apply Code Best Practices | Reduce risk by disposing of resources and avoiding static references | Overlooking event listeners or large caches can perpetuate leaks |
| Monitor in Production | Detect leaks that only appear under real-world usage | Relying solely on pre-release testing ignores the realities of production traffic |
If you need a refresher on integrating this process with your DevOps toolchain, take a look at our performance testing integration guide. For more on real-time monitoring strategies, see our breakdown of the top API monitoring tools in 2026.
Frequently Asked Questions
What exactly is a memory leak, and why do they matter in load testing?
A memory leak happens when an application fails to release memory it no longer needs, causing its memory usage to grow without bound. This can lead to application crashes, slow response times, and increased operational costs – especially during load testing when systems are under sustained stress. Up to 30% of performance issues detected during load testing are linked to memory leaks. If left unchecked, these leaks can turn minor inefficiencies into full-blown outages during peak traffic.
How can I distinguish a memory leak from normal memory growth under load?
Not all increases in memory usage indicate a leak. Some applications legitimately consume more memory under load due to caching or buffering strategies for performance. The telltale sign of a memory leak is a continually rising memory footprint that does not decrease even after the load subsides. Establish a baseline memory usage for your application under typical conditions, then during load tests, watch for abnormal, irreversible growth in memory utilization. For more practical strategies, see our analysis of cloud vs local mobile performance testing.
What tools and methods should I use to detect memory leaks during load testing?
Modern profiling tools such as Java VisualVM, .NET Memory Profiler, and open-source options like LeakCanary for Android provide granular insights into object allocations and retention. During load tests, use these profilers to monitor object lifecycles and capture heap dumps at intervals. By analyzing heap dumps, you can pinpoint which objects are being retained in memory and why. Integrating memory profiling directly into your CI/CD pipeline is now a best practice for early leak detection. For a broader comparison of approaches, check our guide to cloud load testing vs local load testing.
Can automated tests really catch all memory leaks?
Automated detection is invaluable, but it’s not foolproof. Some memory leaks only emerge under specific production-like conditions or after extended uptime, which typical test runs might miss. That’s why combining automated leak detection with continuous monitoring in production is recommended. Set up alerts for abnormal memory trends over time. Even the best test coverage can’t guarantee you’ll catch every edge case – real-world usage patterns often reveal leaks that didn’t manifest in the test lab.
What are the best practices for preventing memory leaks in the first place?
Solid prevention starts with disciplined coding practices: always dispose of resources properly, avoid static references to large objects, and manage event listeners carefully. Regular code reviews focused on resource management are also key. It’s more effective to bake leak prevention into your development culture than to rely solely on after-the-fact fixes.
Is aggressive garbage collection tuning a solution for memory leaks?
Tuning garbage collection may temporarily reduce memory usage, but it can’t fix a true leak. It might even hide the problem until it becomes catastrophic under heavy load. Instead, focus on identifying and eliminating the underlying issues causing objects to persist longer than necessary.
Addressing memory leaks is not just about running tools – it’s about understanding the difference between healthy growth and true resource loss. By combining baseline measurement, profiling, automation, and disciplined engineering, teams can build applications that stand up to real-world scale and complexity.
Authored with PostNext