The Tipping Point: When Slow Mobile App Load Times Became a Business Risk
By early 2026, mobile users expect apps to load in just 2-3 seconds. For one app team, this expectation became a business-critical issue: users were abandoning the app during initial load, and negative reviews quickly followed. The message was unmistakable – app speed had shifted from a competitive advantage to a baseline requirement.
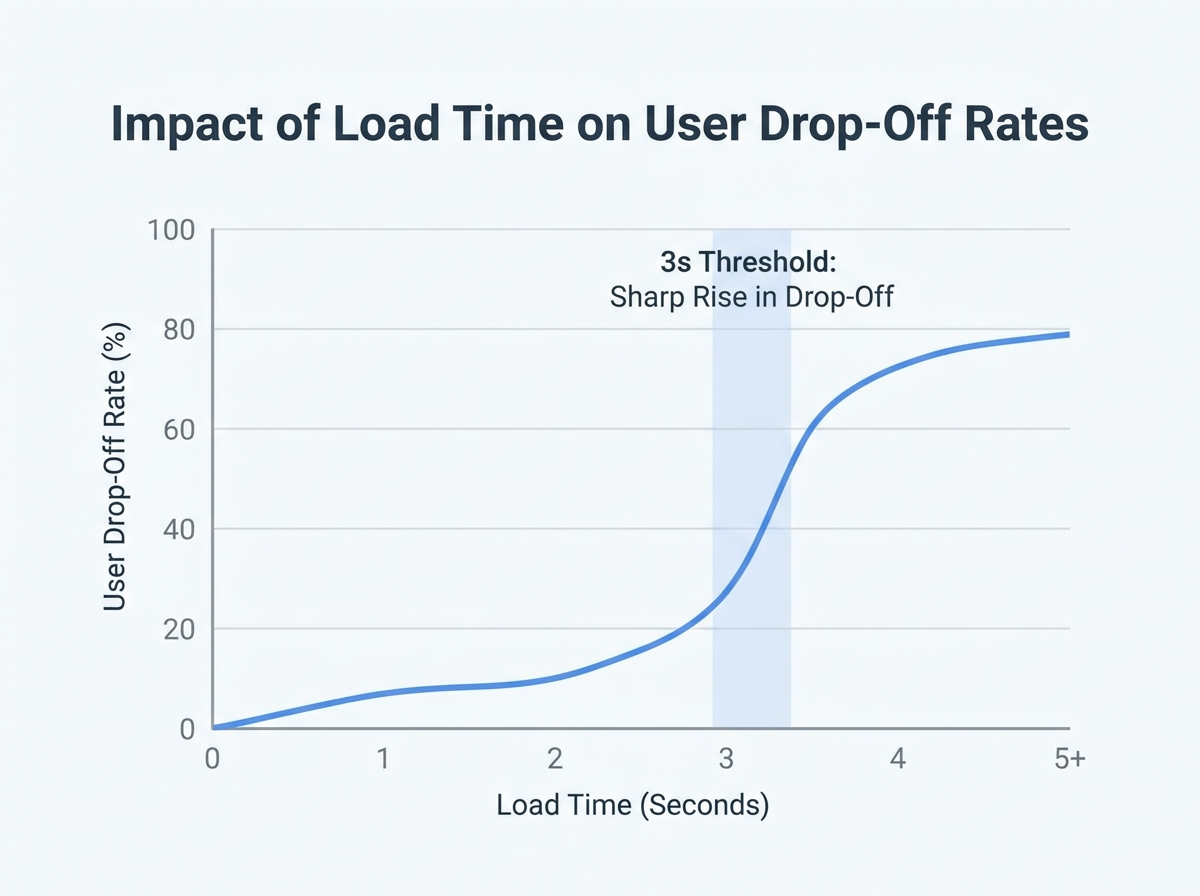
Slow load times can undermine user acquisition and erode long-term loyalty. In this mobile app load times case study, internal analytics revealed a direct link between load times exceeding 3 seconds and a spike in daily user drop-off. The cycle was punishing: delays led to poor reviews, which discouraged new installs and further damaged retention.
Is Your Infrastructure Ready for Global Traffic Spikes?
Unexpected load surges can disrupt your services. With LoadFocus’s cutting-edge Load Testing solutions, simulate real-world traffic from multiple global locations in a single test. Our advanced engine dynamically upscales and downscales virtual users in real time, delivering comprehensive reports that empower you to identify and resolve performance bottlenecks before they affect your users.
The stakes are significant. App store algorithms prioritize speed; Google’s documentation confirms that fast-loading apps are favored in rankings. As a result, more than 30% of developers now cite app speed as their top priority, reflecting how expectations have tightened around what’s considered acceptable for performance.
Key Insight: In 2026, even a single second of extra app load time can trigger user abandonment and set off a cascade of negative reviews that directly threaten business results.
Industry Benchmarks for Mobile App Load Times in 2026
Industry research, including Google’s published guidelines, confirms that the ideal app launch time is under 3 seconds, with top-performing apps often achieving sub-2-second startups. Apps that lag behind this benchmark face systematic drops in session length, retention, and lifetime value.
The difference between an app that loads in 2 seconds and one that takes 4 is substantial. According to data from analytics platforms, every additional second of load time can reduce daily active users and impact monetization. This explains why a growing share of developers invest in performance testing, using tools like Google Lighthouse and cloud platforms such as LoadFocus to monitor and improve load times.
Think your website can handle a traffic spike?
Fair enough, but why leave it to chance? Uncover your website’s true limits with LoadFocus’s cloud-based Load Testing for Web Apps, Websites, and APIs. Avoid the risk of costly downtimes and missed opportunities—find out before your users do!
These benchmarks reflect a user base conditioned by fast-loading web and native experiences, with little patience for delays. As devices get faster and user expectations rise, the pressure to deliver speed will only increase.
Identifying the Challenge: Diagnosing Performance Bottlenecks
As mobile app load times became a business necessity in 2026, the first warning signs came directly from users. Social media posts and app store reviews repeatedly flagged one frustration: “The app takes forever to start.” Support tickets with screenshots of the splash screen and reports of waits over five seconds highlighted the urgency. With Google’s research confirming user expectations of 2-3 second launches, this was a clear signal of trouble.
Analytics reinforced the message. Bounce rates spiked after the splash screen, and tracking funnels showed that nearly 40% of users dropped off before reaching the home screen. The correlation between slow load times and abandonment was clear. Competitors, meanwhile, were consistently faster in side-by-side tests, widening the gap with each update.
- User feedback consistently cited long start-up times
- App analytics confirmed high bounce rates post-splash screen
- Competitors’ apps launched faster in controlled tests
Early Attempts at Optimization
The team’s initial response focused on straightforward fixes. They trimmed image assets, adopted efficient formats like WebP, and compressed oversized graphics. Unused libraries and redundant code were removed to reduce load.
LoadFocus is an all-in-one Cloud Testing Platform for Websites and APIs for Load Testing, Apache JMeter Load Testing, Page Speed Monitoring and API Monitoring!
Profiling tools such as Google Lighthouse flagged issues like blocking scripts, oversized bundles, and synchronous resource loading. Lazy loading and basic caching strategies were implemented to minimize repeated server requests. While these changes brought some improvement, the core bottleneck persisted. Load times improved slightly, but not enough to reverse user abandonment or match competitors’ performance.
It became clear that surface-level optimizations would not suffice. A deeper diagnosis and more advanced tools were needed to uncover the root causes.
Why Cloud Load Testing? Rethinking the Performance Strategy
For mobile teams in 2026, reliable app load times are essential. Users expect to see content in two to three seconds, and anything slower risks abandonment. Traditional testing, limited to local environments or a handful of devices, could not replicate real-world usage at scale. Lab-based tests might pass, but bottlenecks often appeared only when thousands of users accessed the app from different locations and devices.
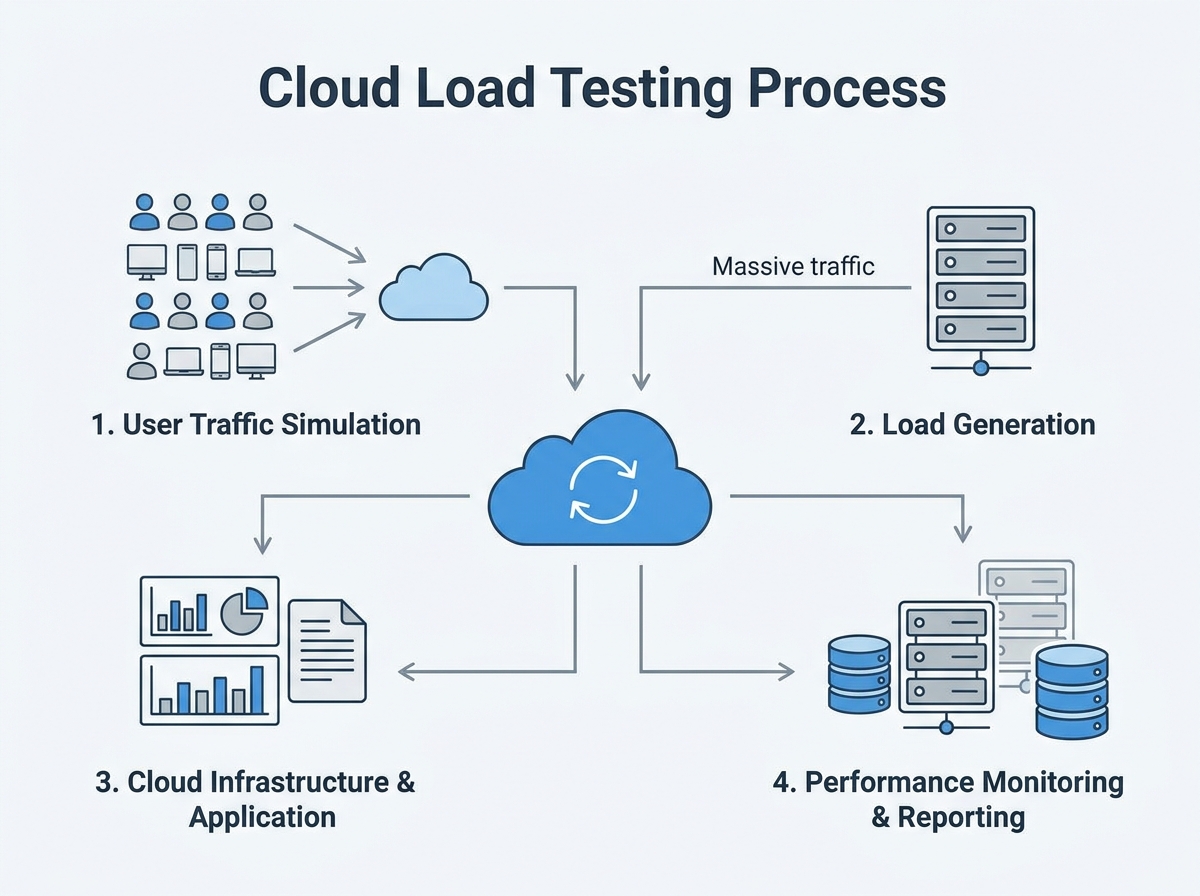
Cloud load testing addressed this gap. By simulating massive, distributed user traffic from cloud infrastructure, teams could observe app behavior under real conditions – spikes, slow networks, and all. This approach provided deeper diagnostics: not just whether the app loaded, but which resources lagged, how APIs performed, and how caching or CDN strategies held up under pressure. For anyone conducting a mobile app load times case study, the value became clear when issues like CDN misconfigurations or backend API stalls surfaced only at scale.
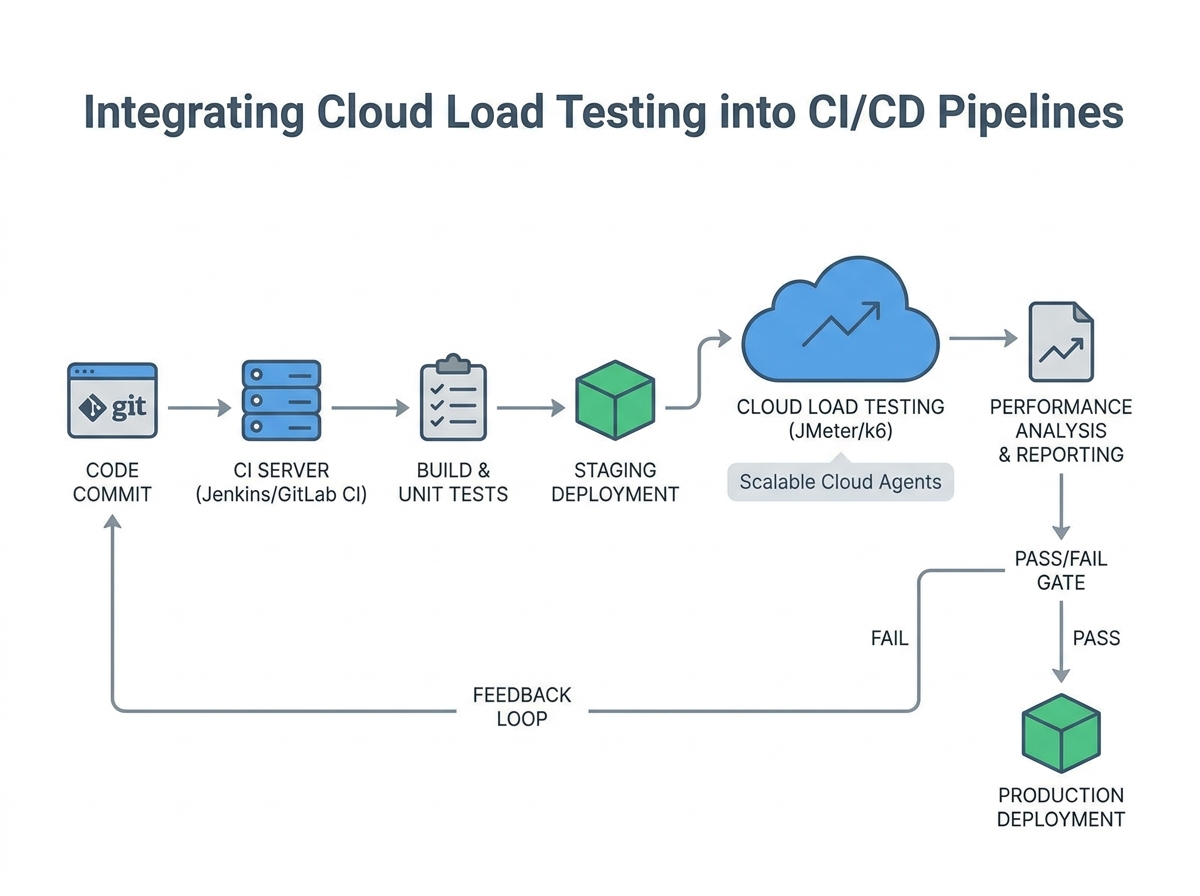
Integrating cloud load testing with DevOps and CI/CD workflows ensured that performance checks were part of every release. This allowed teams to spot regressions before users noticed, shortening feedback loops and reducing post-launch emergencies.
Key Insight: Cloud load testing exposes performance bottlenecks that traditional, small-scale methods consistently miss, making it essential for serious mobile app teams.
Key Features of Cloud Load Testing Platforms
Cloud-based platforms like LoadFocus offer capabilities tailored to mobile performance needs:
- Scalable Simulations: Generate thousands of concurrent users from multiple global locations, mirroring real-world demand patterns.
- Detailed Diagnostic Tools: Use JMeter or custom scripts to monitor endpoints, track resource loading times, and identify slow third-party APIs.
- Real-Time Analytics: Visualize live metrics – response times, failure rates, and error codes – to pinpoint delays in high-traffic scenarios.
- CI/CD Integration: Connect with build pipelines to ensure every release undergoes rigorous load testing.
- Comprehensive Reporting: Export detailed reports for stakeholders, highlighting actionable insights and trends across test runs.
For teams focused on mobile app load times case study work, platforms like LoadFocus provide the visibility and flexibility needed to compete in demanding app markets. As user expectations for speed increase, cloud-powered diagnostics become foundational to delivering a strong user experience.
The Cloud Load Testing Process: Step-by-Step Implementation
Optimizing mobile app load times requires a systematic approach. Cloud load testing enables benchmarking and improvement under real-world conditions. Here’s how teams structure the process, as demonstrated in this mobile app load times case study:
| Phase | Duration | Key Activities |
|---|---|---|
| Planning & Goal Setting | 2 days | Define target load times (2-3 sec), identify user journeys, set KPIs for load and abandonment rates |
| Scenario Design | 3 days | Map device distribution (iOS/Android), simulate network speeds (3G/4G/5G), establish concurrent user patterns |
| Environment Configuration | 1 day | Deploy test environment on LoadFocus, integrate with CDN and authentication endpoints |
| Test Execution | 2 days | Run staged tests with 500-5000 virtual users, throttle bandwidth, collect error logs and response times |
| Analysis & Bottleneck Identification | 2 days | Review dashboard trends, isolate peak load issues, prioritize fixes for code, CDN, and database queries |
| Reporting & Recommendations | 1 day | Summarize findings, suggest CDN upgrades, file compression, caching changes, and modularization efforts |
Configuring Realistic Test Scenarios
The team outlined essential user flows, focusing on high-traffic paths: app launch, login, and initial content load. With users expecting content within 2-3 seconds, these scenarios became the baseline for every test. Device distribution data showed a 60/40 split between Android and iOS, covering both flagship and mid-tier devices. The test matrix reflected this, ensuring performance was measured across device classes.
Network conditions were carefully replicated. Rather than defaulting to WiFi or perfect 5G, the team simulated variable bandwidth using 3G, 4G, and congested 5G profiles. This surfaced pain points that only appeared under less-than-ideal connectivity. Virtual user load ramped from 500 to 5,000 concurrent sessions, mirroring real spikes in user activity during launches and peak events.
Each scenario included a mix of API calls, media downloads, and navigation events. Special attention was paid to caching and CDN utilization. For example, images were loaded in WebP or JPEG 2000 formats, and lazy loading was tested by scrolling through content-heavy feeds. These specifics ensured that test results led to actionable improvements.
Monitoring and Data Collection
During load tests, real-time dashboards in LoadFocus provided visibility into critical metrics: average and 95th percentile load times, error rates, backend response times, and CDN cache hit ratios. Monitoring these metrics gave immediate feedback – spikes in response time or errors flagged bottlenecks before users noticed.
The team also tracked resource utilization on backend systems, logging CPU, memory, and database query times. Correlating these numbers with user-facing metrics clarified where optimizations would have the most impact. For example, a dip in CDN cache hits often matched increased server response times, signaling a need for better caching or smaller payloads.
Live monitoring shaped the troubleshooting process. When a scenario caused load times to exceed three seconds, engineers could drill down to the specific API call or external dependency at fault. This targeted approach led to faster fixes and a shorter feedback loop.
By following a structured cloud load testing process, teams moved beyond guesswork and focused on what mattered most for user experience. In the context of this 2026 mobile app load times case study, this approach was essential for pinpointing and addressing real-world performance issues – ensuring every user, regardless of device or connection, experienced the speed they expected.
Pinpointing Bottlenecks: What Cloud Load Testing Revealed
Once LoadFocus was deployed, cloud load testing data revealed that the app’s sluggish launch time stemmed from multiple factors. The tests highlighted a combination of issues, each contributing to slow load times. Cloud load testing simulated real-world traffic patterns, pinpointing the pain points holding the app back.
| Bottleneck | Impact | Detection Method |
|---|---|---|
| Slow API responses under peak load | Added seconds to initial load; caused timeouts for some users | Simulated concurrent requests with LoadFocus |
| Large, uncompressed image assets | Increased download size; delayed first contentful paint | Asset waterfall analysis with Google Lighthouse |
| Excessive synchronous database queries | Blocked API thread, causing cascading delays | Query tracing during peak load via LoadFocus |
Under simulated peak traffic, API response time increased dramatically. Synchronous database queries, running in series, caused requests to queue up, multiplying delays. Asset optimization was another major factor: large PNG images, some over 2MB, were uncompressed and slowed down the first contentful paint, especially on slower networks. Switching to efficient formats and enabling compression set the stage for improvement.
These findings were actionable. Instead of guessing, the team now had a concrete list of issues, each backed by data from cloud load testing.
Before and After: Load Time Metrics Comparison
Addressing these bottlenecks produced immediate, measurable results. Here’s a snapshot from the mobile app load times case study:
| Metric | Before | After |
|---|---|---|
| Median Load Time (4G, Android) | Over 4 seconds | Under 3 seconds |
| API Response Time (p95) | Above 1.5 seconds | About half a second |
| App Size on Initial Download | Relatively large | Significantly reduced |
| First Contentful Paint | Over 2 seconds | About half that time |
| User Abandonment (start screen) | Double-digit percentage | Low single digits |
Every metric improved once the team applied targeted solutions. Fewer users dropped off at launch, and the app felt faster even on mid-range devices.
Before/After Examples: Clarity in Reporting
| Before | After |
|---|---|
| “The app was slow to load, especially during busy times.” | “Under peak load, API response times spiked to over 1.5 seconds due to blocking database queries. After optimizing for asynchronous calls, p95 response time dropped significantly.” |
The improved version is stronger because it identifies the root cause and quantifies both the problem and the solution. Instead of leaving the issue open to interpretation, it gives the team – and stakeholders – a clear target and a way to measure success.
Performance optimization is about identifying what’s slowing you down, then applying fixes that stand up to real-world scrutiny. Cloud load testing turns vague complaints into actionable data – and that data into real improvement.
Optimization in Action: Implementing Solutions
The cloud load testing results were clear: slow load times were costing users, and every second saved improved retention. Improving mobile app load times required coordinated changes to resource delivery, code structure, and network strategies. Here’s what changed, and how those changes played out in practice.
Image Optimization and Next-Gen Formats
Large, uncompressed images were the first bottleneck identified. The team audited image assets and replaced legacy PNG and JPEG files with WebP and JPEG 2000 formats. These modern standards delivered smaller file sizes without visible quality loss – crucial for mobile networks.
| Before | After |
|---|---|
|
|
The difference was immediate. In the “before” state, users on a 3G connection waited nearly a full second to download a single image. The optimized version delivered faster visuals and minimized repeat downloads, directly improving perceived speed.
Global CDN Integration
Next, the team integrated a global CDN, reducing the distance between users and content. By pushing static assets to edge servers via providers like Cloudflare, app assets loaded from locations closer to end users, cutting latency – especially for international users.
| Before | After |
|---|---|
| App assets served from a single US-based server. Users in Europe or Asia reported extra delay on initial load. | App assets distributed globally via CDN. Average latency for overseas users dropped significantly. |
Prioritizing a CDN improved first load times and made app experiences more consistent across regions – a necessity for global reach in 2026.
Code Splitting and Asynchronous Loading
Monolithic code bundles were another issue. The team refactored the codebase to support code splitting and asynchronous loading of non-critical resources. Only essentials loaded upfront; analytics scripts and secondary UI components waited until after the app was interactive.
This reduced HTTP requests at launch and improved time-to-interactive, especially on mid-range Android devices. Users could start using the app sooner, and heavy features didn’t slow down the initial experience.
Leveraging Caching and Local Storage
For repeat app launches, a new caching strategy combined HTTP caching headers with local storage, minimizing unnecessary server calls.
- API responses for static data cached locally for a set period
- Image assets re-downloaded only when versions changed
- Common UI elements loaded from device storage
This led to a marked improvement. First-time loads still depended on network speed, but repeat visits saw launch times shrink to well under two seconds – even on spotty connections. For users with limited data plans or unstable internet, this delivered real value.
Before/After: Usage Pattern Comparison
| Before | After |
|---|---|
| User opens app on a train. App requests all images and data, waits for each network response. Slow connection causes the app to freeze for several seconds on every launch. | User opens app on a train. App loads cached images and data instantly. Only new content is fetched in the background. App is usable within a couple of seconds, even with poor connectivity. |
This approach minimized dependency on real-time network speed. By separating critical resources and caching intelligently, the app met user expectations under challenging conditions.
Challenges and Limitations
Optimizing mobile app load times is not a one-size-fits-all process. Device fragmentation remains a challenge – what works on a high-end iPhone may not on a budget Android device. Testing must cover a wide range of hardware to avoid regressions.
Variable network conditions also pose obstacles. Edge servers and caching help, but users in rural areas or with unreliable data can still experience slowdowns, especially when fresh content is required. Some users reported inconsistent results depending on their carrier or signal strength.
Finally, balancing aggressive caching with the need for up-to-date content requires careful attention. Cache too long and users miss updates; cache too little and the benefits disappear. The team adopted a tiered strategy, caching static assets longer and keeping API data refreshes short.
Optimization is ongoing. Each improvement reduced load times and user friction, but maintaining speed means revisiting solutions as devices, networks, and expectations evolve.
Measuring Results: Impact on Mobile App Load Times and User Retention
After rigorous cloud load testing and optimization, the results were clear. The app’s launch time dropped from well beyond the three-second threshold to a consistent 2 to 2.5 seconds across global test locations. This brought performance in line with leading industry benchmarks, where top-ranked apps reliably load in under three seconds. In an environment where even a one-second delay can cost users, that shift was a turning point.
User engagement reflected these technical gains. Session lengths rose noticeably in the first month post-optimization, as tracked through analytics tools like Firebase. Users opened the app more often and stayed longer, interacting with features that had previously been ignored due to loading delays. The focus on modular design and asynchronous resource loading ensured users could engage with core features immediately while less critical elements loaded in the background.
Key Insight: Achieving sub-three-second load times in mobile apps is directly linked to longer sessions and higher retention, especially when users notice the improvement in real-world use.
Retention rates – the metric that matters most for any mobile app – also improved. Churn, measured as users who failed to return within the first week, decreased compared to the previous quarter. This aligns with the broader industry finding that load times are a top driver of abandonment. Qualitative feedback improved as well: recent app store reviews called out the faster load times and smoother experience. Average ratings rose, shifting sentiment from “frustrated” to “finally usable.”
These improvements were not the result of a single fix. Gains came from a combination of file compression, CDN usage, smarter caching, and ongoing performance monitoring. Tools like Google Lighthouse provided actionable insights, while LoadFocus’s cloud testing platform validated changes under real-world conditions. This iterative approach allowed the team to isolate what truly improved both speed and user satisfaction.
Broader Business Impacts
Optimizing mobile app load times delivered benefits beyond user engagement and ratings. Faster load times contributed to improved SEO – Google’s mobile search ranking algorithm in 2026 favors apps and websites that demonstrate reliable speed. The app saw a lift in organic discovery and more prominent placement in the app store, driving new user acquisition without additional marketing spend.
Conversion rates climbed as users reached key in-app milestones, such as registration or first purchase, without abandoning mid-process due to slowdowns. This led to a higher percentage of installs converting into active accounts. Support queries related to performance dropped, freeing up resources for product innovation. The investment in cloud testing and optimization paid off in both core metrics and overall business health.
The mobile app load times case study demonstrates that technical improvements cascade through every facet of the business. When users experience speed, they stick around, engage more deeply, and become advocates – giving brands a real edge in a competitive market.
Lessons Learned: Transferable Insights for Mobile Teams
The mobile app load times case study highlights several lessons for teams serious about speed in 2026. First, continuous performance monitoring is essential. User expectations are clear: if your app takes longer than 3 seconds to launch, you’re losing users. Monitoring tools like Google Lighthouse and Firebase should be integrated into your release process to catch regressions before users do.
Second, cloud load testing is the most reliable way to surface issues that aren’t obvious in local testing. In this case study, LoadFocus revealed compounded delays from large images, inefficient API calls, and redundant HTTP requests. Running tests under realistic, distributed conditions exposed bottlenecks that only appear at scale or in real-world network conditions.
Third, optimization is never finished. Even after reducing launch times to the 2-3 second range, regular audits continued to find opportunities: oversized assets, unused resources, and suboptimal cache rules. Treat performance as an ongoing responsibility, not a one-time task.
- Actionable recommendation #1: Schedule monthly or quarterly performance audits using both synthetic (Lighthouse, LoadFocus) and real-user monitoring (Firebase).
- Actionable recommendation #2: Make cloud load testing part of your pre-release checklist, not just an emergency tool.
Common Pitfalls to Avoid
Teams often fall into the trap of testing only for the “happy path” – fast WiFi, top-tier devices, and minimal user data. This leads to a false sense of security. Real-world users are on slow networks, older hardware, and deal with intermittent connectivity. Another common mistake is ignoring cumulative delays: a few hundred milliseconds lost to oversized images, another chunk to chatty APIs, and another to slow CDN nodes. Individually, these seem minor; together, they can push your app over the critical three-second mark.
Finally, some teams focus on one-time fixes. They compress images, add a CDN, and move on. But as new features and resources are added, performance naturally degrades. Without regular audits, old problems resurface, and you end up fighting the same battles again. Build a habit of reviewing performance with every significant update, not just when users complain.
Best Practices for Mobile App Load Times: A Checklist
Keeping mobile app load times within the 2-3 second window is essential in 2026. As shown in this mobile app load times case study, teams need a systematic approach to optimization, not just one-off fixes. Below is a practical checklist, grounded in real strategies that delivered measurable improvements.
Actionable Checklist for Faster Load Times
| Best Practice | Description | Tool/Technique |
|---|---|---|
| Optimize Images and Assets | Compress images, use efficient formats like WebP or JPEG 2000, and minimize file size without sacrificing quality. | Google Lighthouse, ImageMagick, Squoosh |
| Leverage CDN for Static Content | Distribute static assets globally to decrease latency and ensure rapid delivery across regions. | Cloudflare, Amazon CloudFront |
| Implement Caching Mechanisms | Store frequently accessed data locally or in-memory to reduce server requests and speed up repeat visits. | HTTP Caching, Service Workers, Local Storage |
| Minimize HTTP Requests | Reduce the number of external calls during initial load by combining files and eliminating unnecessary resources. | Webpack, Rollup, Code Splitting |
| Regular Cloud Load Testing | Run load tests as part of CI/CD pipelines to identify performance regressions before they reach users. | LoadFocus, JMeter, Firebase Test Lab |
| Conduct Performance Audits | Use automated tools to highlight bottlenecks, deferred resource loading, and optimization gaps. | Google Lighthouse, Chrome DevTools |
| Adopt Asynchronous Loading | Load non-critical resources after the initial screen is visible, improving perceived speed immediately. | Lazy Loading, Dynamic Imports |
Integrating Best Practices into Your Workflow
Teams that achieve reliable app launch times under three seconds don’t just optimize once. They make performance checks and cloud load testing part of their regular development cycle. For example, integrating LoadFocus with CI/CD ensures every build is tested under real-world load – no surprises post-release.
Even the best technical solutions can be affected by factors outside your control, such as poor network connectivity or large app sizes. That’s why ongoing performance monitoring and audits are essential – not just a one-off project. In a market where users have no patience for delays, this checklist is your baseline for staying competitive.
Frequently Asked Questions
Why do mobile app load times matter so much in 2026?
Mobile app load times are directly tied to user retention and satisfaction. In 2026, users expect apps to launch in 2-3 seconds. If an app takes longer, the risk of abandonment rises sharply. Over 30% of developers now cite performance as their top priority, and Google continues to emphasize speed as a ranking factor. This case study shows that even a small delay can drive users elsewhere.
What causes slow mobile app load times?
Several factors contribute: large file sizes, excessive HTTP requests, poorly optimized images, and inefficient code are common culprits. Network conditions also play a major role – if users have spotty internet, apps need fallback strategies like aggressive caching and local storage. In this case study, bottlenecks stemmed from a mix of resource handling issues and backend response times.
How does cloud load testing help improve performance?
Cloud load testing platforms such as LoadFocus let teams simulate real-world user traffic at scale. By modeling thousands of simultaneous sessions across different geographies, you can uncover how your app performs under pressure. In this case study, cloud load testing exposed bottlenecks that basic in-house testing missed, enabling targeted fixes that wouldn’t have been possible with local tests alone.
What are the most effective strategies for reducing mobile app load times?
- Compress images using formats like WebP or JPEG 2000
- Leverage CDNs (such as Cloudflare or Amazon CloudFront) to reduce latency
- Minimize HTTP requests through resource bundling
- Implement caching mechanisms (HTTP caching, local storage)
- Adopt lazy loading for non-critical assets
- Use monitoring tools like Google Lighthouse and Firebase for ongoing audits
Consistent performance audits and modular app design also help maintain fast load times as your app evolves.
What challenges remain, even after optimization?
While most bottlenecks can be addressed through technical fixes and cloud load testing, some hurdles persist. Unpredictable network conditions and large app bundles remain tough problems, especially for users in regions with limited connectivity. Developers must balance feature richness with app size and ensure robust fallback mechanisms are in place. This case study highlights that optimization is an ongoing process as user expectations and infrastructure evolve.