
To increase the heap size in JMeter, create a file named setenv.sh in JMeter’s bin folder (setenv.bat on Windows) and set HEAP in it, for example export HEAP="-Xms1g -Xmx4g -XX:MaxMetaspaceSize=256m". The start script reads that file every time JMeter launches. The default heap is 1 GB, and jmeter.log prints the size JMeter actually got, so you can confirm the change in one line.
Key takeaways
- JMeter 5.6.3 starts with
-Xms1g -Xmx1g -XX:MaxMetaspaceSize=256m. Change it inbin/setenv.shorbin\setenv.bat, not inside thejmeterscript. JVM_ARGSis added afterHEAP, so a-XmxinJVM_ARGSwins. Handy for one run, confusing if you forget it is set.- After an OutOfMemoryError, JMeter writes a heap dump about as big as the heap and, in our test, still exited with status 0. Do not judge a run by the exit code alone.
- Most of JMeter’s memory goes to listeners and stored responses. Run in CLI mode without View Results Tree before you add heap, and add machines when CPU or network runs out.
Where to set the JMeter heap size
| Where you run JMeter | What to write | Where |
|---|---|---|
| macOS or Linux, every run | export HEAP="-Xms1g -Xmx4g -XX:MaxMetaspaceSize=256m" | bin/setenv.sh (create it) |
| Windows, every run | set HEAP=-Xms1g -Xmx4g -XX:MaxMetaspaceSize=256m | bin\setenv.bat (create it) |
| macOS or Linux, one run | HEAP="-Xms1g -Xmx4g" jmeter -n -t plan.jmx -l results.jtl | The command line |
| Any OS, override everything | -Xmx2g in JVM_ARGS | Environment variable |
The rest of this guide explains each row, how to check the result, and what to do when more heap is not the answer. Everything below was checked against JMeter 5.6.3, the current release, on Java 17.
What is the default heap size in JMeter?
JMeter’s default heap is 1 GB. Both start scripts in JMeter 5.6.3, bin/jmeter and bin\jmeter.bat, set -Xms1g -Xmx1g -XX:MaxMetaspaceSize=256m when HEAP is not already defined. The user manual says the same: by default JMeter runs with a 1 GB heap, which “might not be enough for your test” depending on the test plan and the number of threads.
The heap holds everything JMeter keeps in memory while it runs: every thread’s variables, the responses it is still processing, and whatever your listeners store. 1 GB is plenty for building and debugging a plan. A long run with hundreds of threads, large responses or a results listener that keeps every sample is where it runs out.
Older guides, including the first version of this post, tell you to edit jmeter.bat or the jmeter script directly. Those edits are lost when you upgrade, because a new release replaces the scripts. The header of the 5.6.3 script says it plainly: “Do not set the variables in this script. Instead put them into a script setenv.sh in JMETER_HOME/bin to keep your customizations separate.” A new install still needs setenv.sh copied across, but it is one small file you keep.
How to increase the heap size on macOS and Linux
Create bin/setenv.sh with a HEAP line. The jmeter script checks for that file at startup and sources it when it is readable, so it does not need to be executable.
- Open the
binfolder of your JMeter install. If you installed with Homebrew, the files are inside Homebrew’s directory; where Homebrew keeps the JMeter configuration files shows how to find it. - Create
setenv.shnext to thejmeterscript with this content:
# bin/setenv.sh, read by bin/jmeter on every start
export HEAP="-Xms1g -Xmx4g -XX:MaxMetaspaceSize=256m"- Start JMeter again, in GUI or CLI mode.
- Check what it got.
jmeter.logis written to the folder you started JMeter from, and its startup lines include the maximum heap in bytes:
grep "Max memory" jmeter.log
# <date> <time> INFO o.a.j.JMeter: Max memory     =4294967296   (4 GB)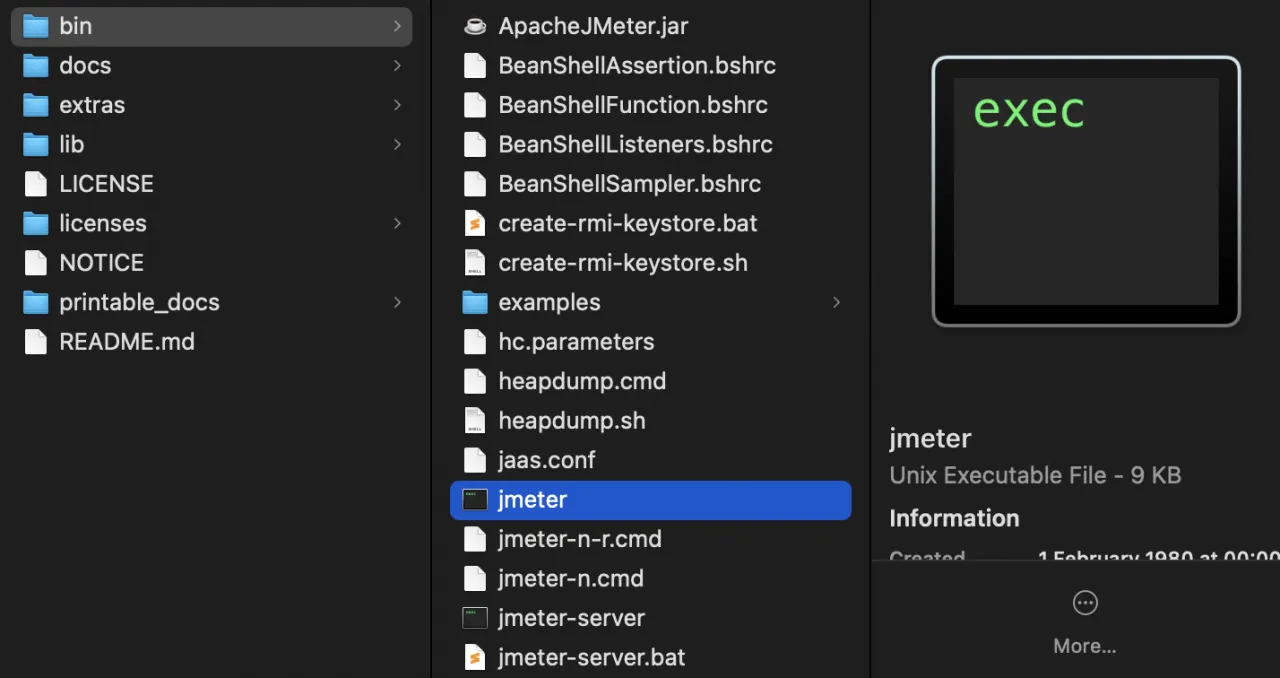
We ran a one-sampler plan four ways with JMeter 5.6.3 on Java 17 (macOS, October 2026) and read the same log line each time. A Groovy sampler that printed Runtime.getRuntime().maxMemory() agreed with the log in every case.
| How the heap was set | Max memory in jmeter.log |
|---|---|
| Nothing set (default) | 1,073,741,824 bytes (1 GB) |
HEAP="-Xms1g -Xmx4g ..." in bin/setenv.sh | 4,294,967,296 bytes (4 GB) |
Same setenv.sh, plus JVM_ARGS="-Xmx2g" | 2,147,483,648 bytes (2 GB) |
No setenv.sh, HEAP="-Xms1g -Xmx3g" before the command | 3,221,225,472 bytes (3 GB) |
The third row is the one that catches people out. The script puts JVM_ARGS after HEAP on the Java command line, and the manual notes that JVM_ARGS “will override the HEAP settings in the script”. If a heap change seems to do nothing, check whether JVM_ARGS is set in your shell profile or CI job.
How to increase the heap size on Windows
Create bin\setenv.bat and set HEAP in it, without quotes:
rem bin\setenv.bat, called by bin\jmeter.bat on every start
set HEAP=-Xms1g -Xmx4g -XX:MaxMetaspaceSize=256m
In the 5.6.3 release, jmeter.bat calls setenv.bat before anything else and only applies its own 1 GB default if not defined HEAP, so your value wins. The manual’s own setenv.bat example uses set JVM_ARGS=-Xms1024m -Xmx1024m, which also works because JVM_ARGS is added last. We read jmeter.bat from the 5.6.3 source; the timings above come from macOS, not from a Windows run. The same grep works in Git Bash, or search jmeter.log for Max memory in any editor.
How much heap should JMeter get?
Give JMeter enough heap that memory stays flat during the run, and keep well below the machine’s physical RAM. The Java process needs memory outside the heap as well (thread stacks, metaspace, the garbage collector), and the operating system needs its share. A machine that starts swapping produces response times that describe the swapping rather than the server.
There is no rule that turns thread count into gigabytes, because a plan that downloads 2 MB pages needs far more than one that posts small JSON. Measure instead. Run the plan at its target thread count for a few minutes and watch the heap with the tools that ship with the JDK: jconsole, or jcmd <pid> GC.heap_info (find the pid with jcmd -l). If used heap drops back after each collection, the size is right. If it climbs steadily until the run fails, something in the plan is keeping every result, and a bigger heap only moves the failure later.
The manual’s own setenv.sh example sets -Xms and -Xmx to the same value, so the heap does not have to grow during the test. Leave -XX:MaxMetaspaceSize at 256m unless the log shows OutOfMemoryError: Metaspace: metaspace holds class metadata, not test data. The first version of this post suggested -XX:MaxMetaspaceSize=12g, which was a mistake.
What a JMeter OutOfMemoryError looks like
To see the failure on purpose, we gave JMeter a 128 MB heap and a Groovy sampler that allocated memory until it ran out. The console showed:
Dumping heap to java_pid87802.hprof ...
Heap dump file created [110073232 bytes in 0.128 secs]
Uncaught Exception java.lang.OutOfMemoryError: Java heap space in thread Thread[tg 1-1,5,main]. See log file for details.
summary =      0 in 00:00:00 = ******/s Avg:     0 Min: 9223372036854775807 Max: -9223372036854775808 Err:     0 (0.00%)
Three things to take from it:
- A heap dump lands in your working folder. Both start scripts always add
-XX:+HeapDumpOnOutOfMemoryError. The file is roughly the size of the heap: 110 MB here, several gigabytes with a large heap. Open it in a heap analyser to see what filled the memory, then delete it. - The failed thread recorded nothing. The results file held only its header line, and the summary reported 0 samples with 0 errors.
- The exit status was 0. If JMeter runs in a CI job, also check the sample count and search
jmeter.logforOutOfMemoryError.
How to make JMeter use less memory
Before raising the heap, cut what fills it. JMeter’s best-practices page lists the main savings, and most plans that run out of memory break at least one of them.
- Run the load in CLI mode:
jmeter -n -t test.jmx -l test.jtl. The GUI is for building and debugging. Starting JMeter in non-GUI mode covers the options. - Disable View Results Tree and View Results in Table during the load test (right-click, Disable). The manual says to use them only while scripting, to debug the plan.
- Write CSV results, not XML, and save only the fields you need. Saving JMeter results to CSV or XML shows the settings.
- Use as few assertions as you can, and JSR223 elements with Groovy and “Cache compiled script if available” instead of BeanShell.
- Tick “Save response as MD5 hash?” in the HTTP Request’s Advanced tab for large downloads you do not need to inspect. JMeter then stores a 32-character hash instead of the body.
When a bigger heap will not help
A bigger heap removes a memory limit and nothing else. When the load generator’s CPU sits near 100% or its network link is full, the response times you record include JMeter waiting for its own machine, and more heap changes nothing. The manual’s advice for large-scale tests is several CLI instances on several machines, in distributed mode or as separate runs.
How many threads JMeter can run from one machine explains how to find that limit for your own plan, and JMeter distributed testing sets up the controller and workers. For the whole workflow from test plan to HTML report, start with the step-by-step JMeter load testing tutorial.
If you would rather not size and run generator machines yourself, LoadFocus runs your existing .jmx file in the cloud. Its JMeter page says it starts the cloud machines for each run, spreads your threads across them and shuts them down when the test ends, from 25 regions (loadfocus.com, October 2026).
Keep Java current
JMeter 5.6.3 runs on Java 8 or later, and the manual’s checklist for load generators says to install the latest version of Java that JMeter supports. On a Mac, /usr/libexec/java_home -V lists the installed JDKs; java -version shows the one on your path. The jmeter script uses JAVA_HOME when it is set, so point it at the JDK you mean to use.
Frequently Asked Questions
What is the default heap size in JMeter?
1 GB. JMeter 5.6.3’s start scripts use -Xms1g -Xmx1g -XX:MaxMetaspaceSize=256m unless HEAP is already set, and the user manual says the default may not be enough depending on your test plan and thread count.
Where is setenv.sh in JMeter?
It does not exist until you create it. Put it in JMeter’s bin folder, next to the jmeter script, and the script reads it on every start. On Windows the file is bin\setenv.bat, called by jmeter.bat.
Does JVM_ARGS override HEAP in JMeter?
Yes. JVM_ARGS comes after HEAP on the Java command line, so its -Xmx wins. In our test, HEAP set to 4 GB in setenv.sh plus JVM_ARGS="-Xmx2g" gave JMeter a 2 GB heap.
How do I check JMeter’s heap size?
Search jmeter.log for Max memory. JMeter logs the maximum heap in bytes at startup, for example Max memory =4294967296 for a 4 GB heap. The log is written to the folder you started JMeter from.
Why is the JMeter GUI so slow?
A frequent cause is running load from the GUI with a results listener such as View Results Tree collecting every sample. JMeter’s manual says not to load test in GUI mode: build and debug there with one or two threads, then run the load in CLI mode. If jmeter.log shows OutOfMemoryError, raise the heap as shown above.
Sources
- Getting Started, JMeter user manual: default 1 GB heap,
HEAPandJVM_ARGS, thesetenv.shandsetenv.batexamples, Java 8 or higher (jmeter.apache.org, October 2026). - Best Practices, JMeter user manual: reducing resource requirements, distributed runs for large-scale tests (jmeter.apache.org, October 2026).
- HTTP Request, JMeter component reference: “Save response as MD5 hash?” (jmeter.apache.org, October 2026).
- bin/jmeter and bin/jmeter.bat at the 5.6.3 release tag: default
HEAP,setenvhandling,JVM_ARGSorder,-XX:+HeapDumpOnOutOfMemoryError(github.com/apache/jmeter, October 2026). - jcmd, Java SE 17 documentation:
GC.heap_info(docs.oracle.com, October 2026). - Heap and OutOfMemoryError measurements: our own runs of JMeter 5.6.3 on Java 17 (OpenJDK 17.0.20), macOS, 24 October 2026.