Apache JMeter is an open source load and performance tool written in Java and it’s available on almost any OS. This is an intro post about Apache JMeter tool and I’m trying to point out how it can help you in your daily Quality Engineer job.
You can use Apache JMeter for performance, load, stress testing and memory-leak testing for accurate information. Also, JMeter can be used for understanding the performance of a web application, service, end-point etc.
I will present how to use Jmeter for creating a basic load test for a web application, below are Jmeter test configuration from the most basic one (without assertions and reporting), to the most advanced which includes Response Assertions, Reporting, Exporting Data and Chart Results and so on.
Is Your Infrastructure Ready for Global Traffic Spikes?
Unexpected load surges can disrupt your services. With LoadFocus’s cutting-edge Load Testing solutions, simulate real-world traffic from multiple global locations in a single test. Our advanced engine dynamically upscales and downscales virtual users in real time, delivering comprehensive reports that empower you to identify and resolve performance bottlenecks before they affect your users.
1. GET HTTP Request for https://www.example.com/
Description:
- no assertions
- no reporting
Steps:
- Start Jmeter
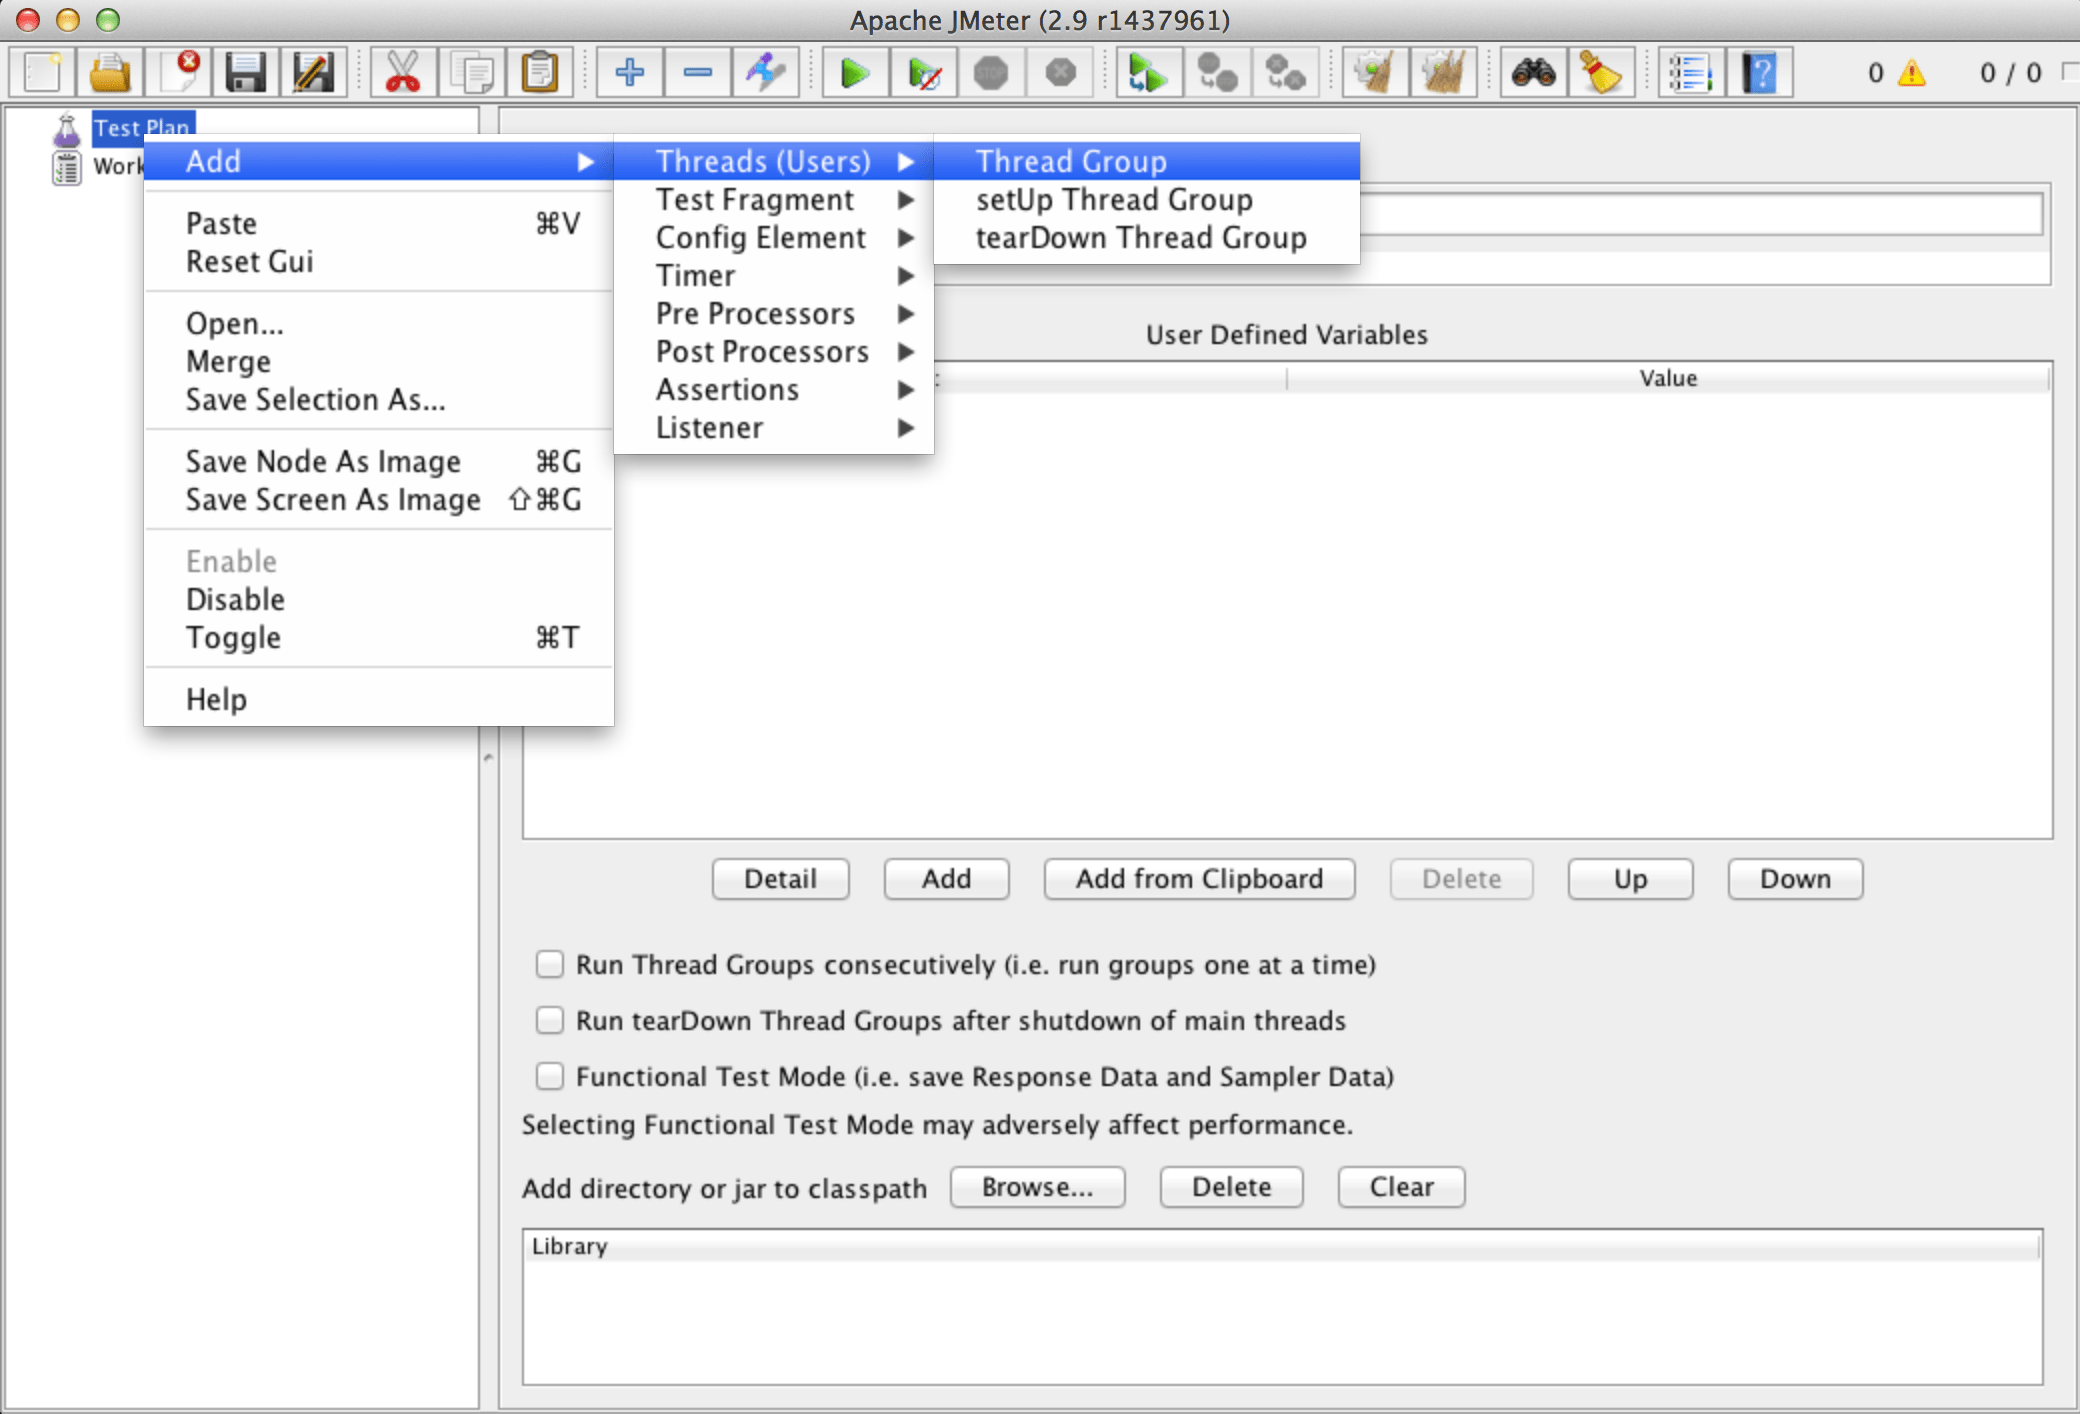
- Add a new Thread Group to the Test Plan
- Right Click on Test Plan and go to Add -> Threads (Users) -> Thread Group
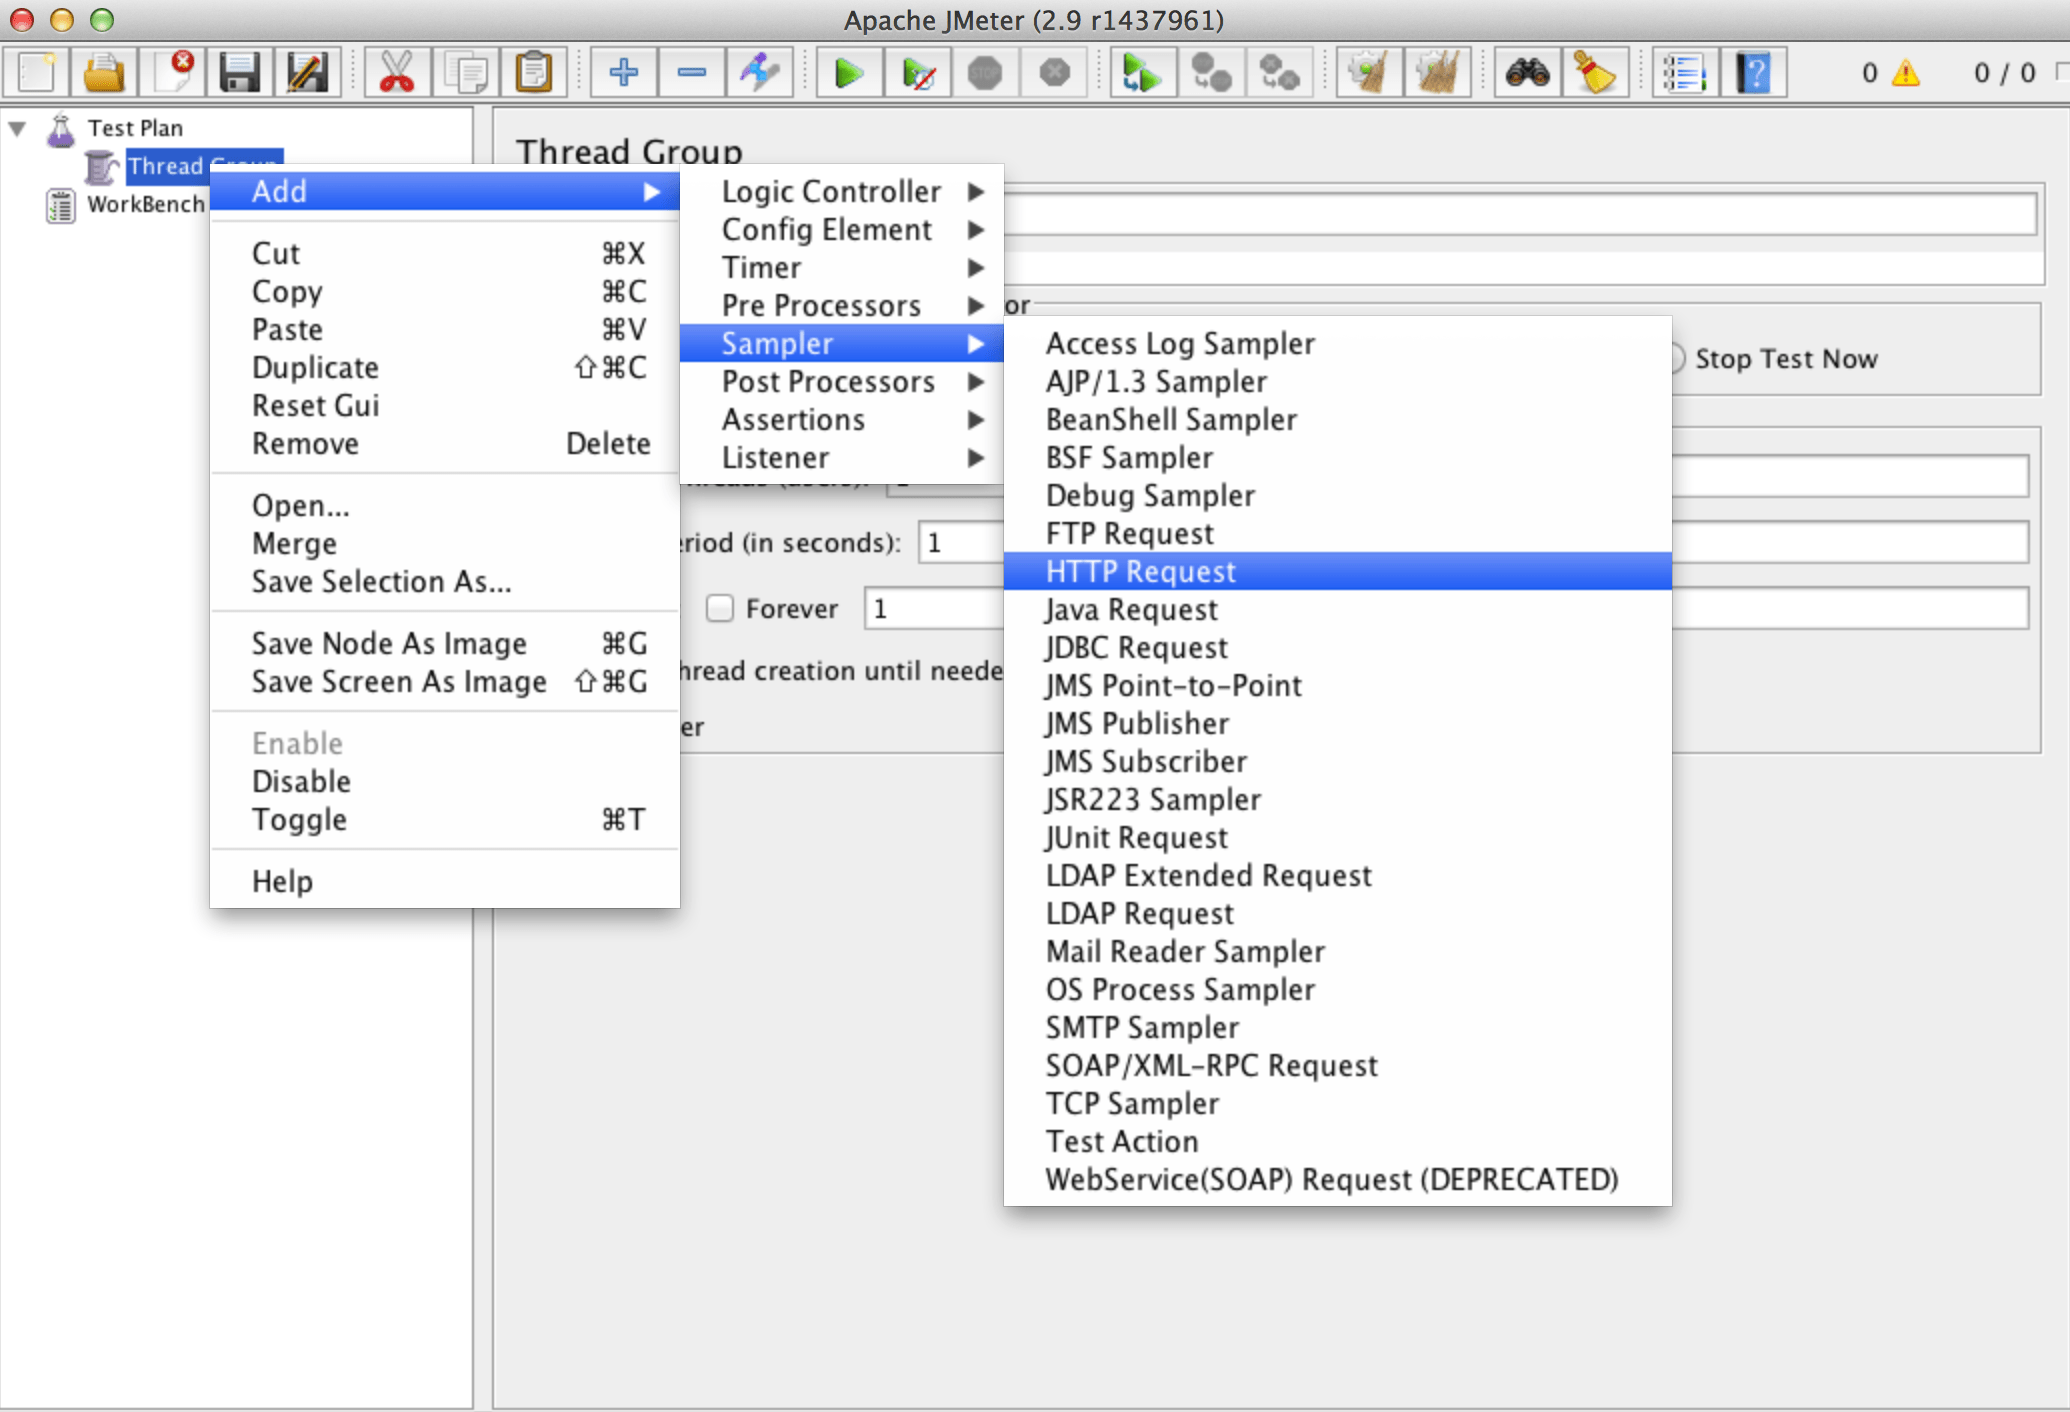
- Add a new HTTP GET Request to the Thread Group
- Right Click on Thread Group and go to Add -> Sampler -> HTTP Request
- This HTTP Request Sample is going to contain the configuration for your web request
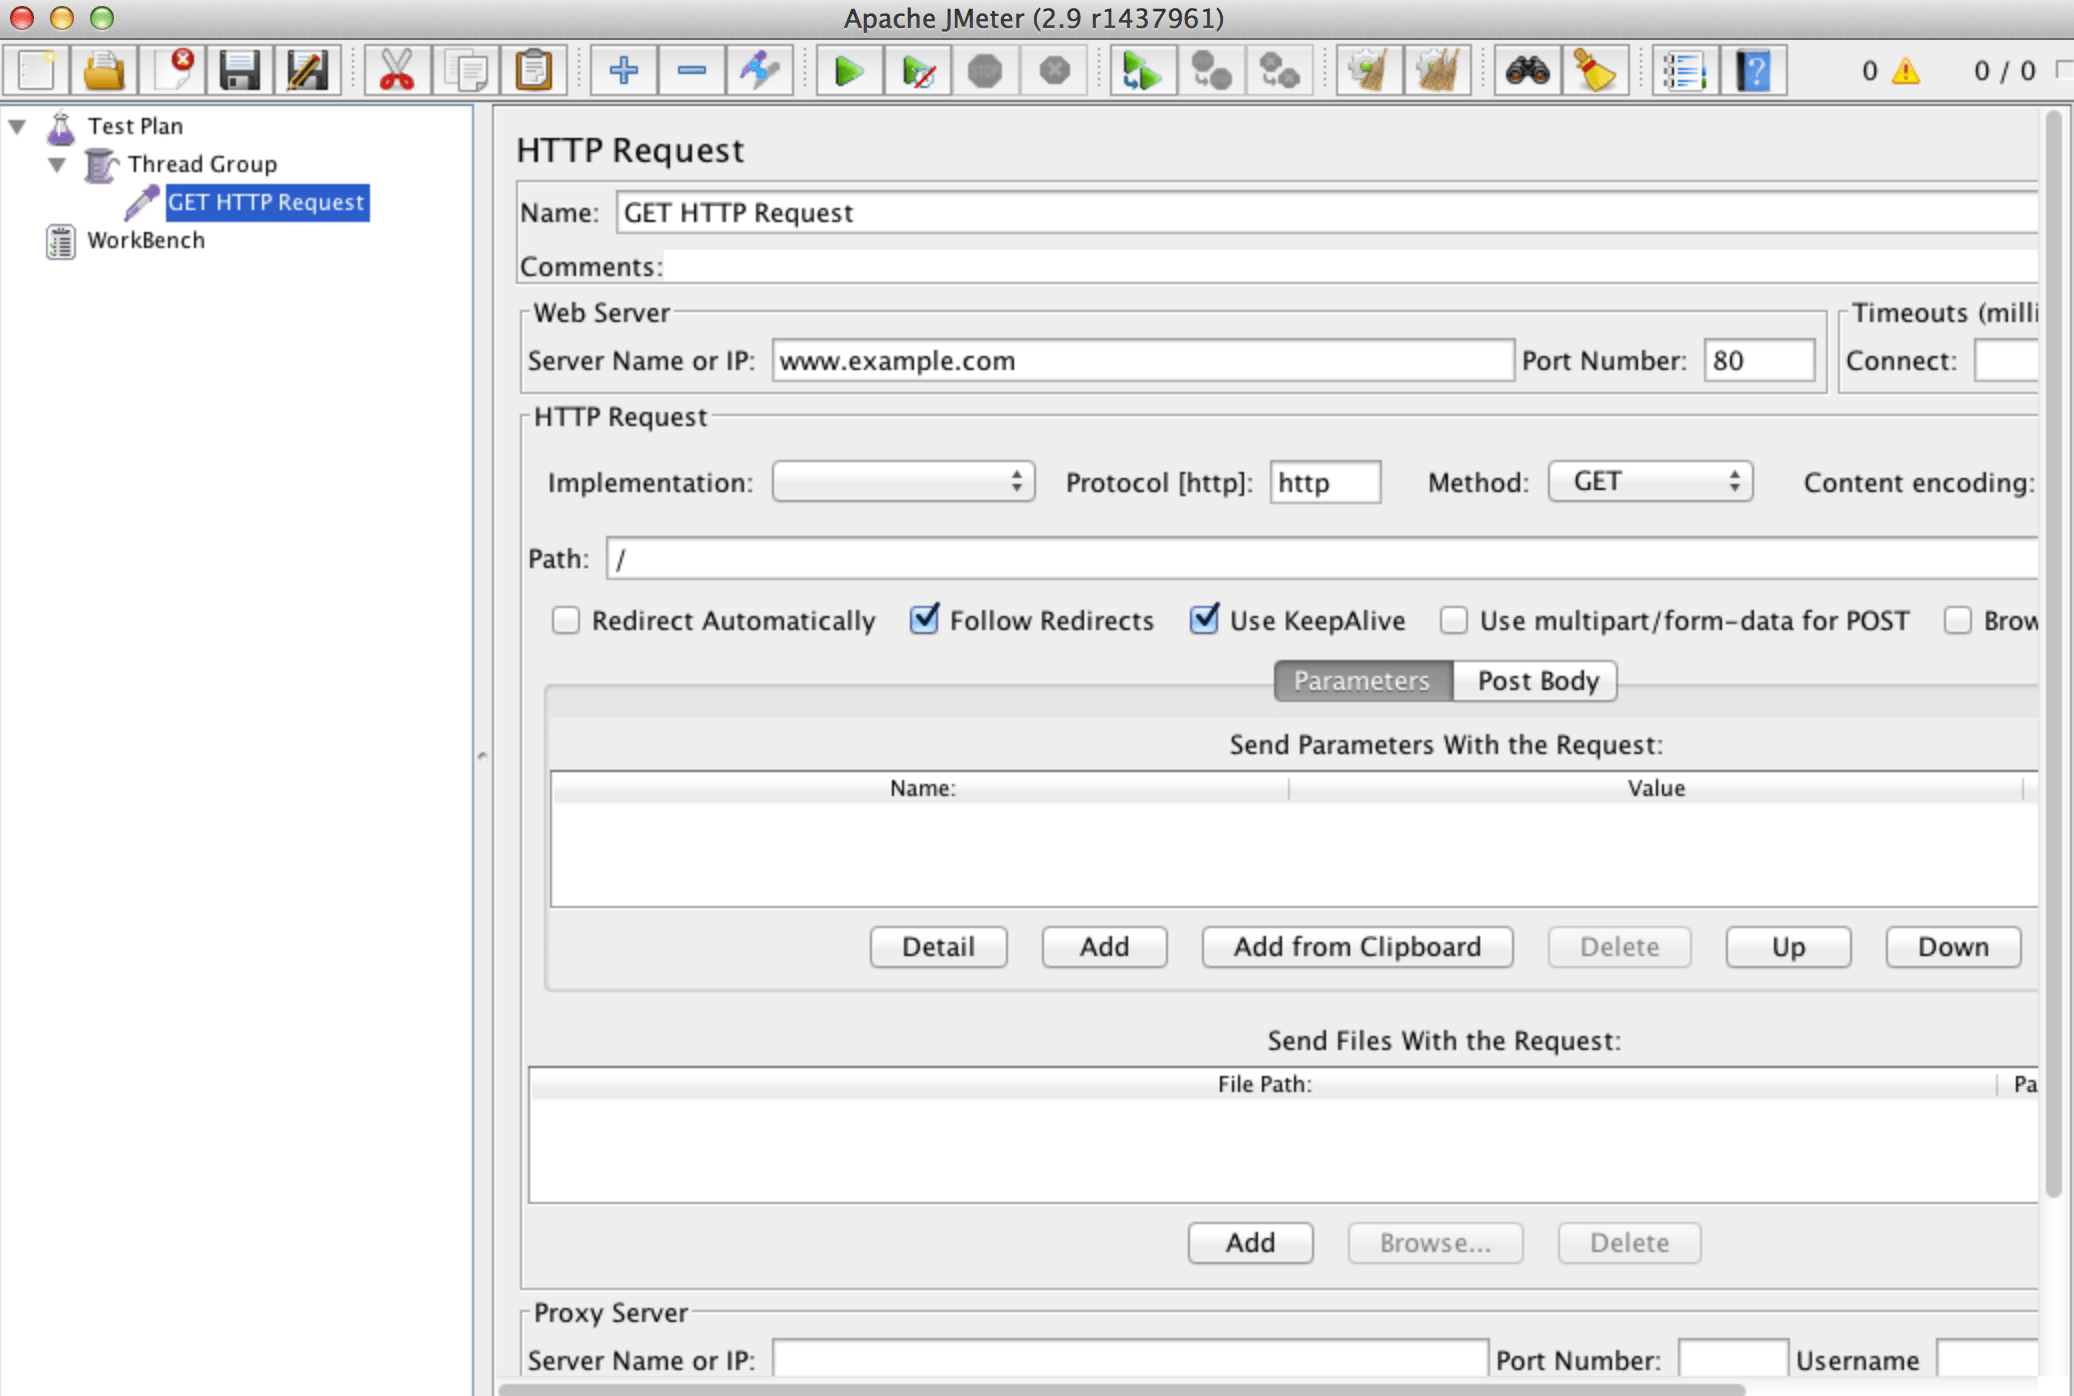
- Configure the GET HTTP Request Sampler
- In order to make a performance test you need to configure the HTTP Sampler request with the necessary data
- Change the name of the HTTP Request with a more descriptive one: GET Request www.example.com
- In the Web Server -> Server Name of IP add the URL of the website, web application that you want to test: www.example.com
- Do not add the protocol in front of the URL (I.e https://www.example.com or https://www.example.com), the protocol will be added only in the Protocol field
- Add the Port Number of the web application: 80 for HTTP or 443 for HTTPS
- Add the protocol in the Protocol [http] field: http
- Select the HTTP Method from the Method drop down: GET
- Add the Path of the request
- For testing the home endpoint you can add only a / character in Path field
- Or you can add a full URL: /index.html?query1=1&query2=2
- Follow Redirects and Keep Alive checkboxes should be selected by default, if not please check them
- Click the green Run icon from the toolbar or hit Ctrl+R to run the test
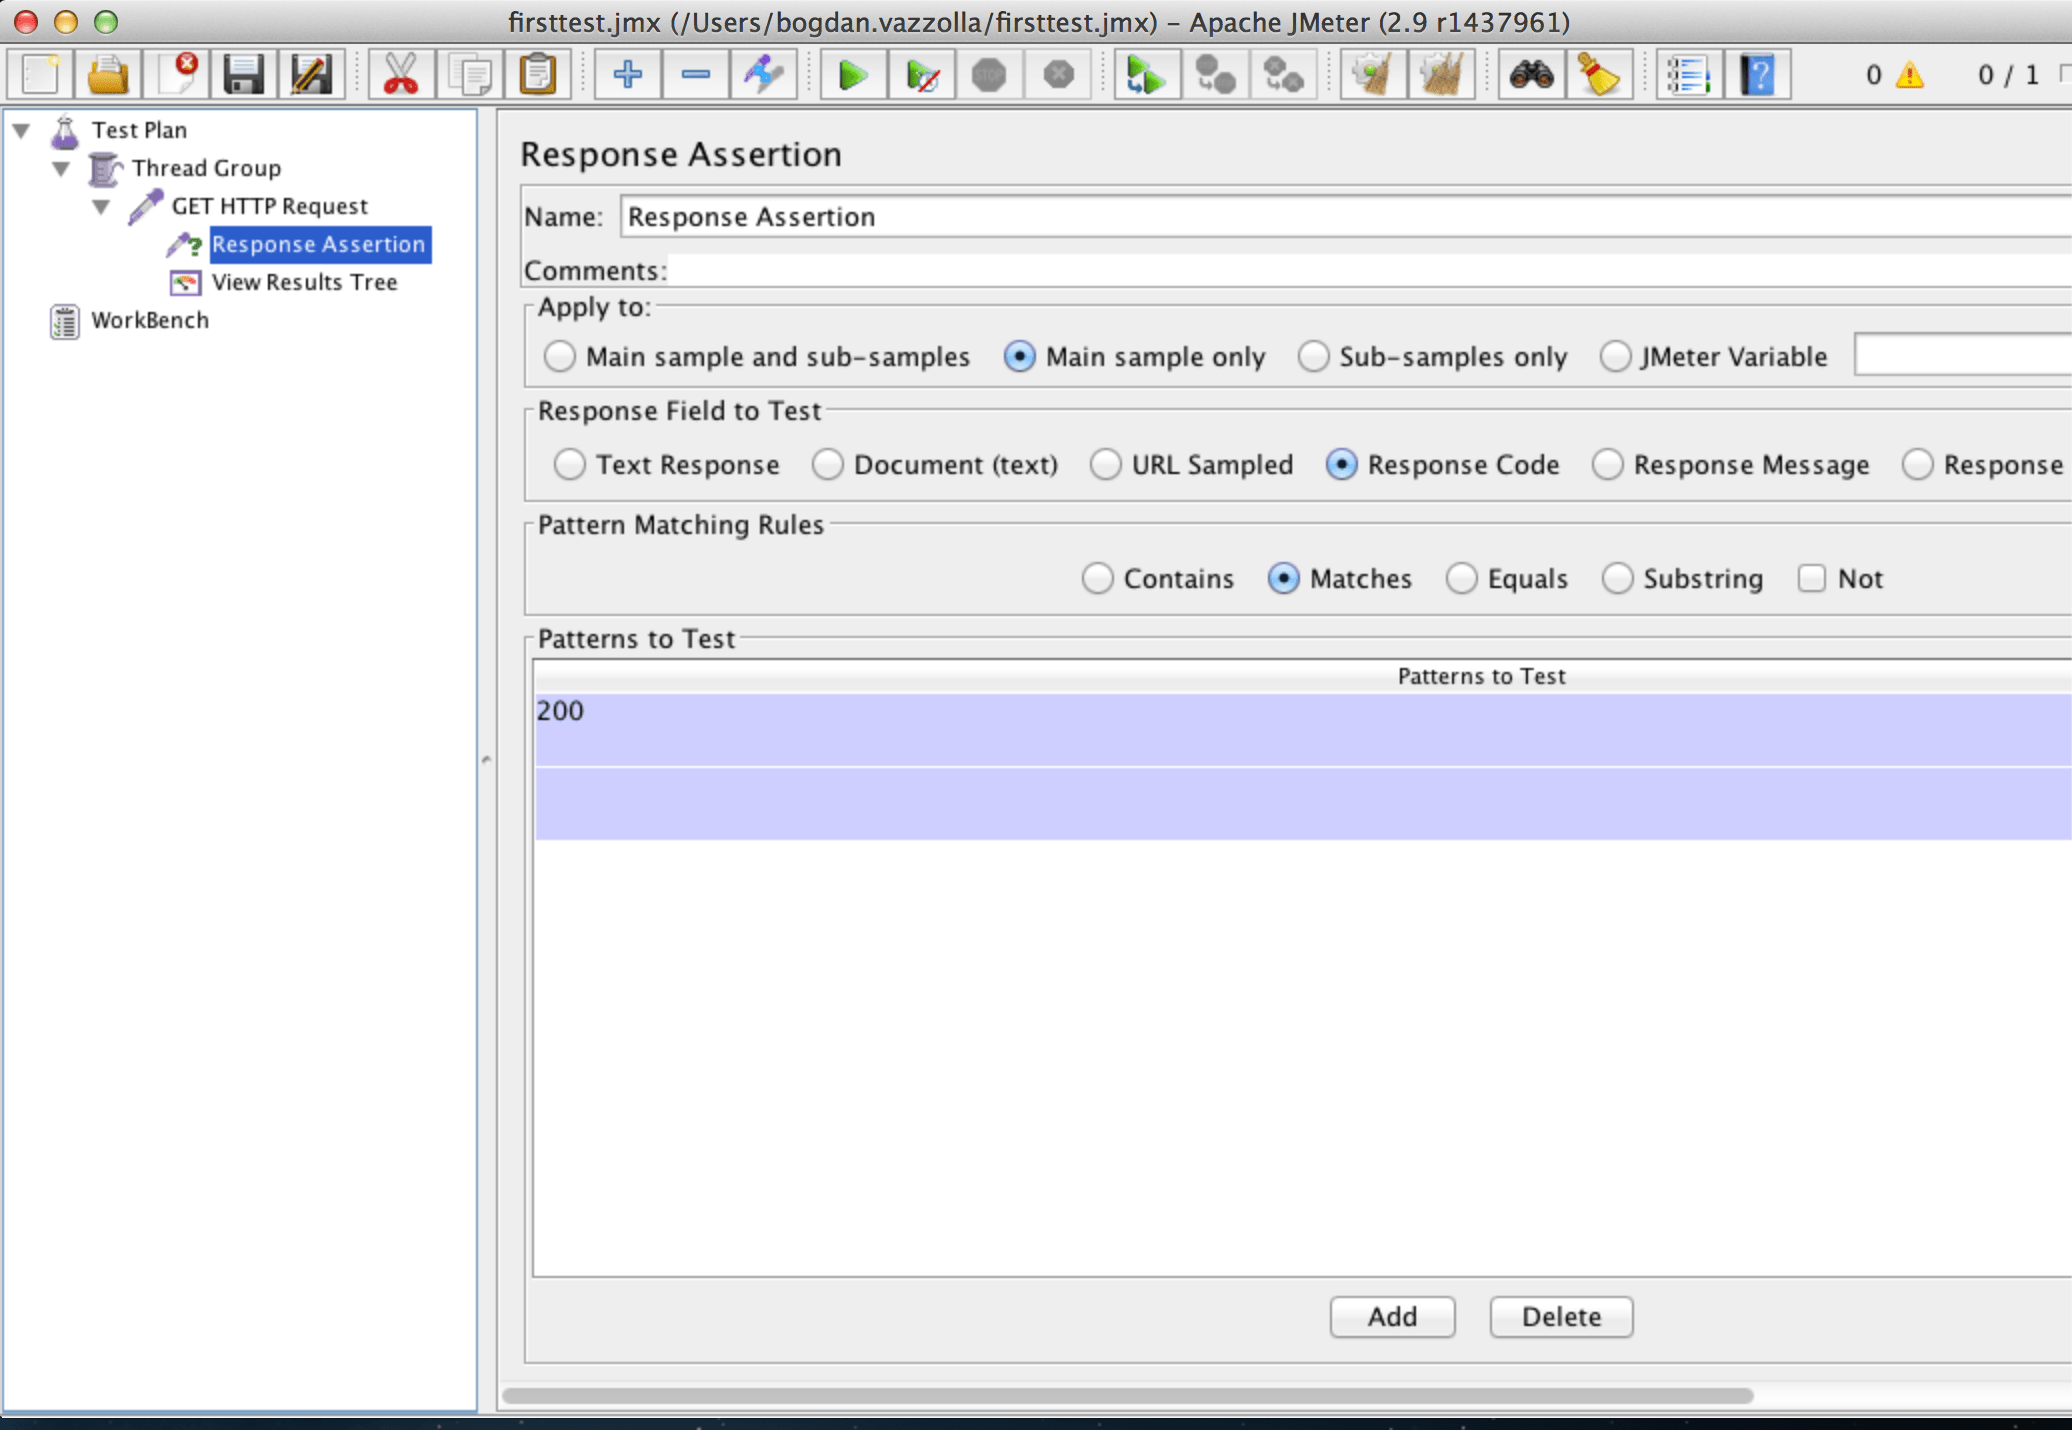
2. Add Assertions to the test:
Think your website can handle a traffic spike?
Fair enough, but why leave it to chance? Uncover your website’s true limits with LoadFocus’s cloud-based Load Testing for Web Apps, Websites, and APIs. Avoid the risk of costly downtimes and missed opportunities—find out before your users do!
Steps
- Right Click the added HTTP Sampler and go to Add -> Assertions -> Response Assertion
- Validate 200 response code for every request
- From the Response Filed to Test select the Response Code radio button
- From the Pattern Matching Rules select the Matches option
- Click the Add button and add 200 value in the Patterns to Test field
- Response code = 200 -> Pass
- Response code different from 200 -> Fail
3. Adding Visual Reporting to the performance test:
Steps
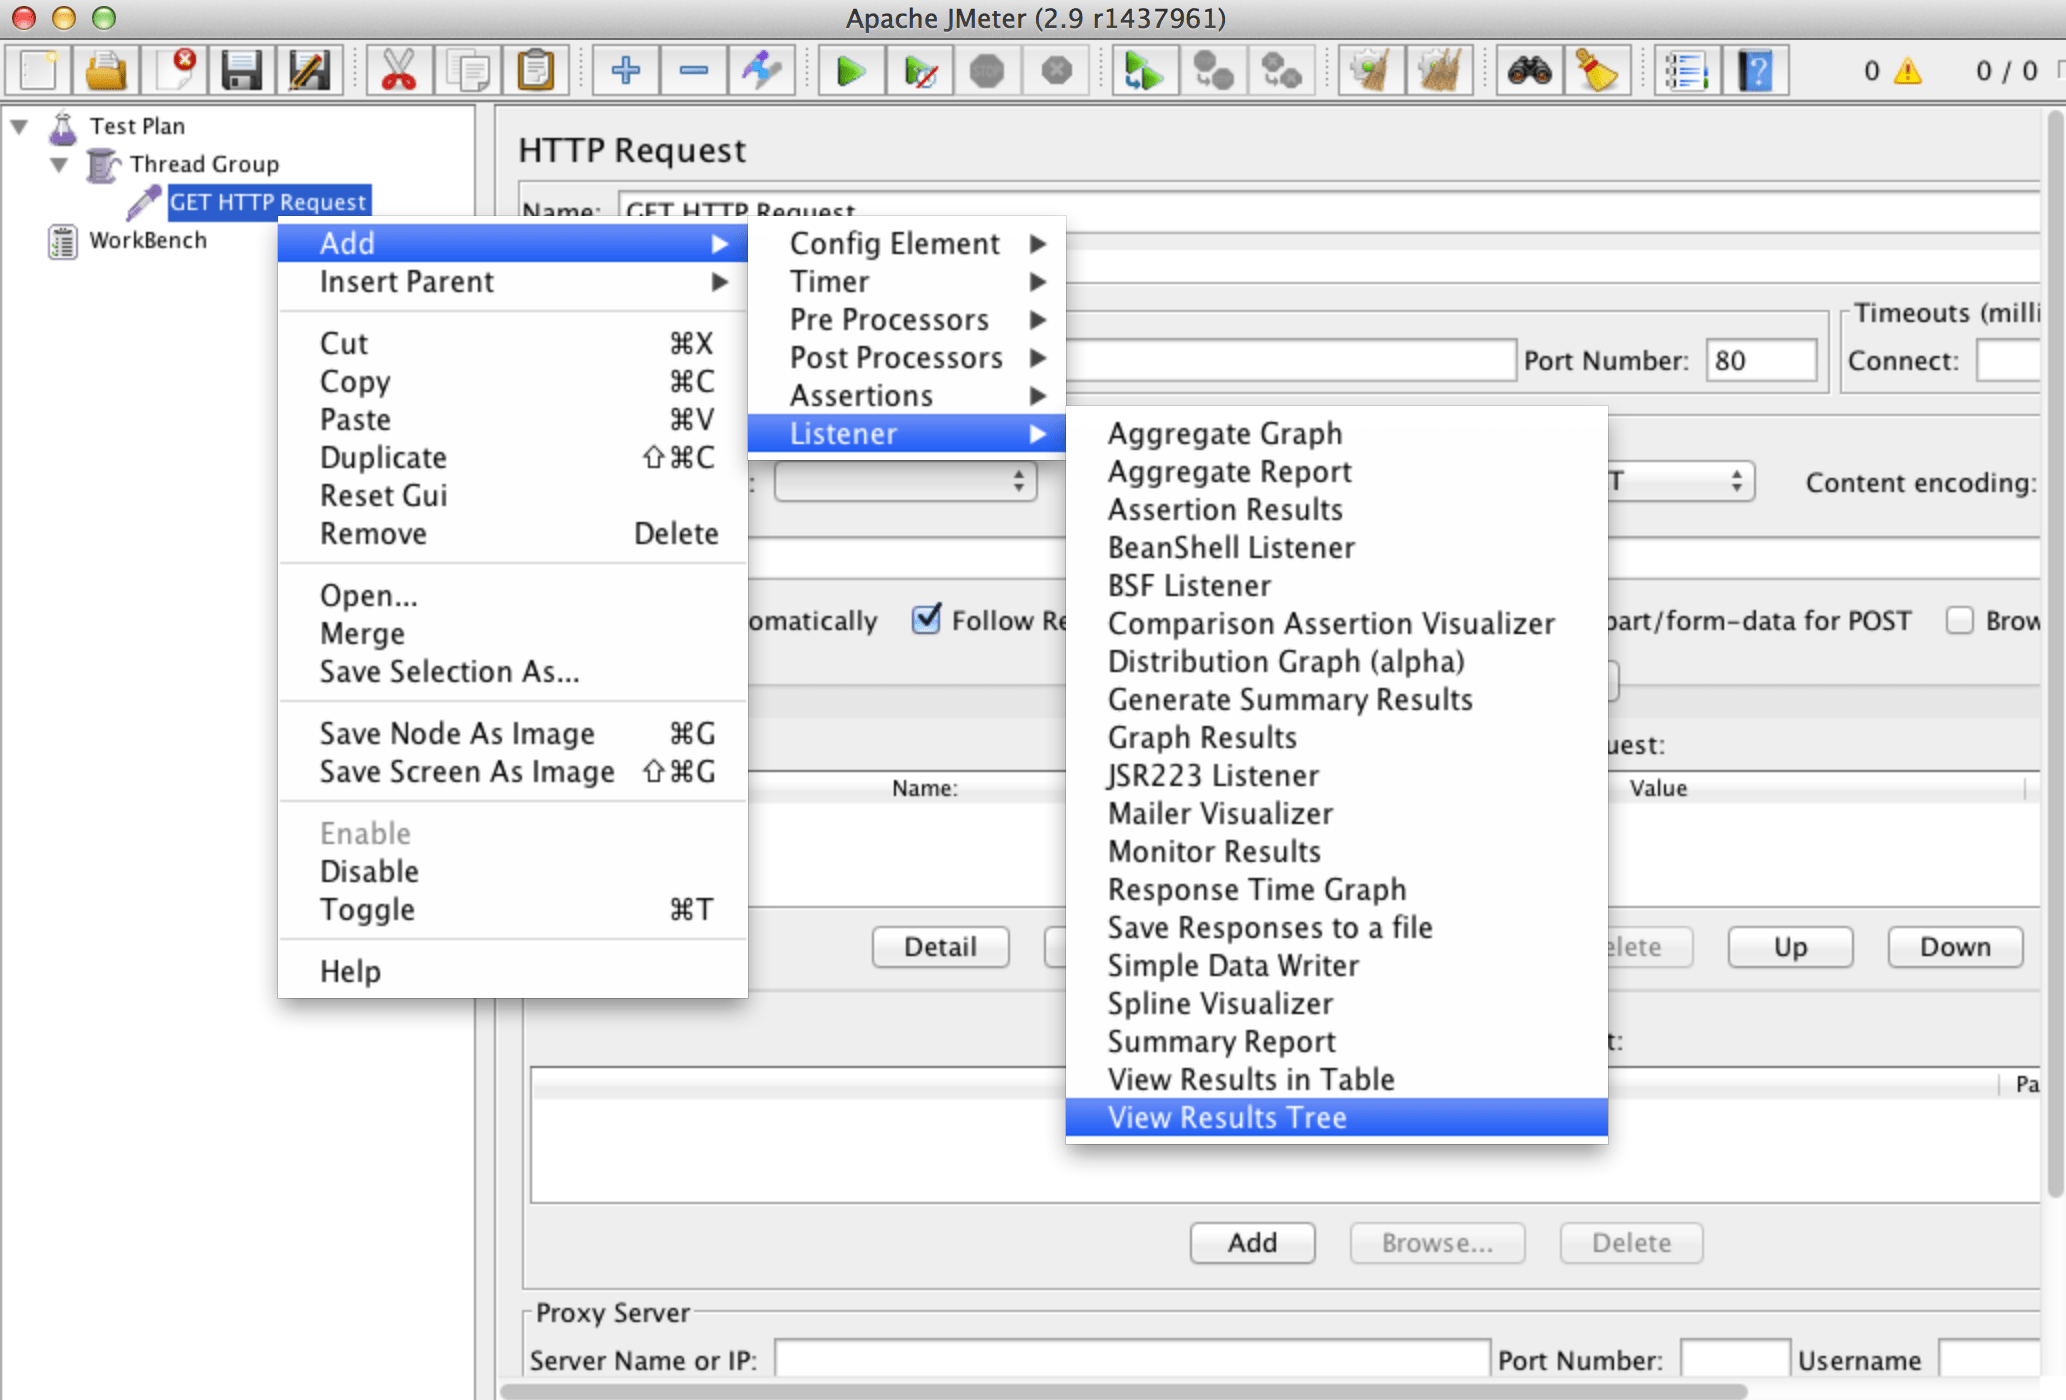
- Right Click the added HTTP Sampler and go to Add -> Listener -> View Results Tree
- Click the View Results Tree listener from the left area
- Run the test again (click the RUN icon from the toolbar or press Ctrl+R) and the test will appear in the list
- Click on the executed request from the list in View Results Tree to see more details of the request
- Green font color -> Pass; Red font color -> Fail
- Clicking the result in the list reveals new data in the right area: Sampler result, Request and Response Data
- Sampler result: shows overall data of the executed request, offer detail of the Thread Name, Latency, Size, Sample Count, Response Code, Message and Headers
- Request: shows details of the HTTP request, type of the request, cookies, request headers etc
- You can log only Errors or only Successes by clicking on the check boxes in the top-right area
- Clean the list of runs by pressing the Ctrl+E shortcut
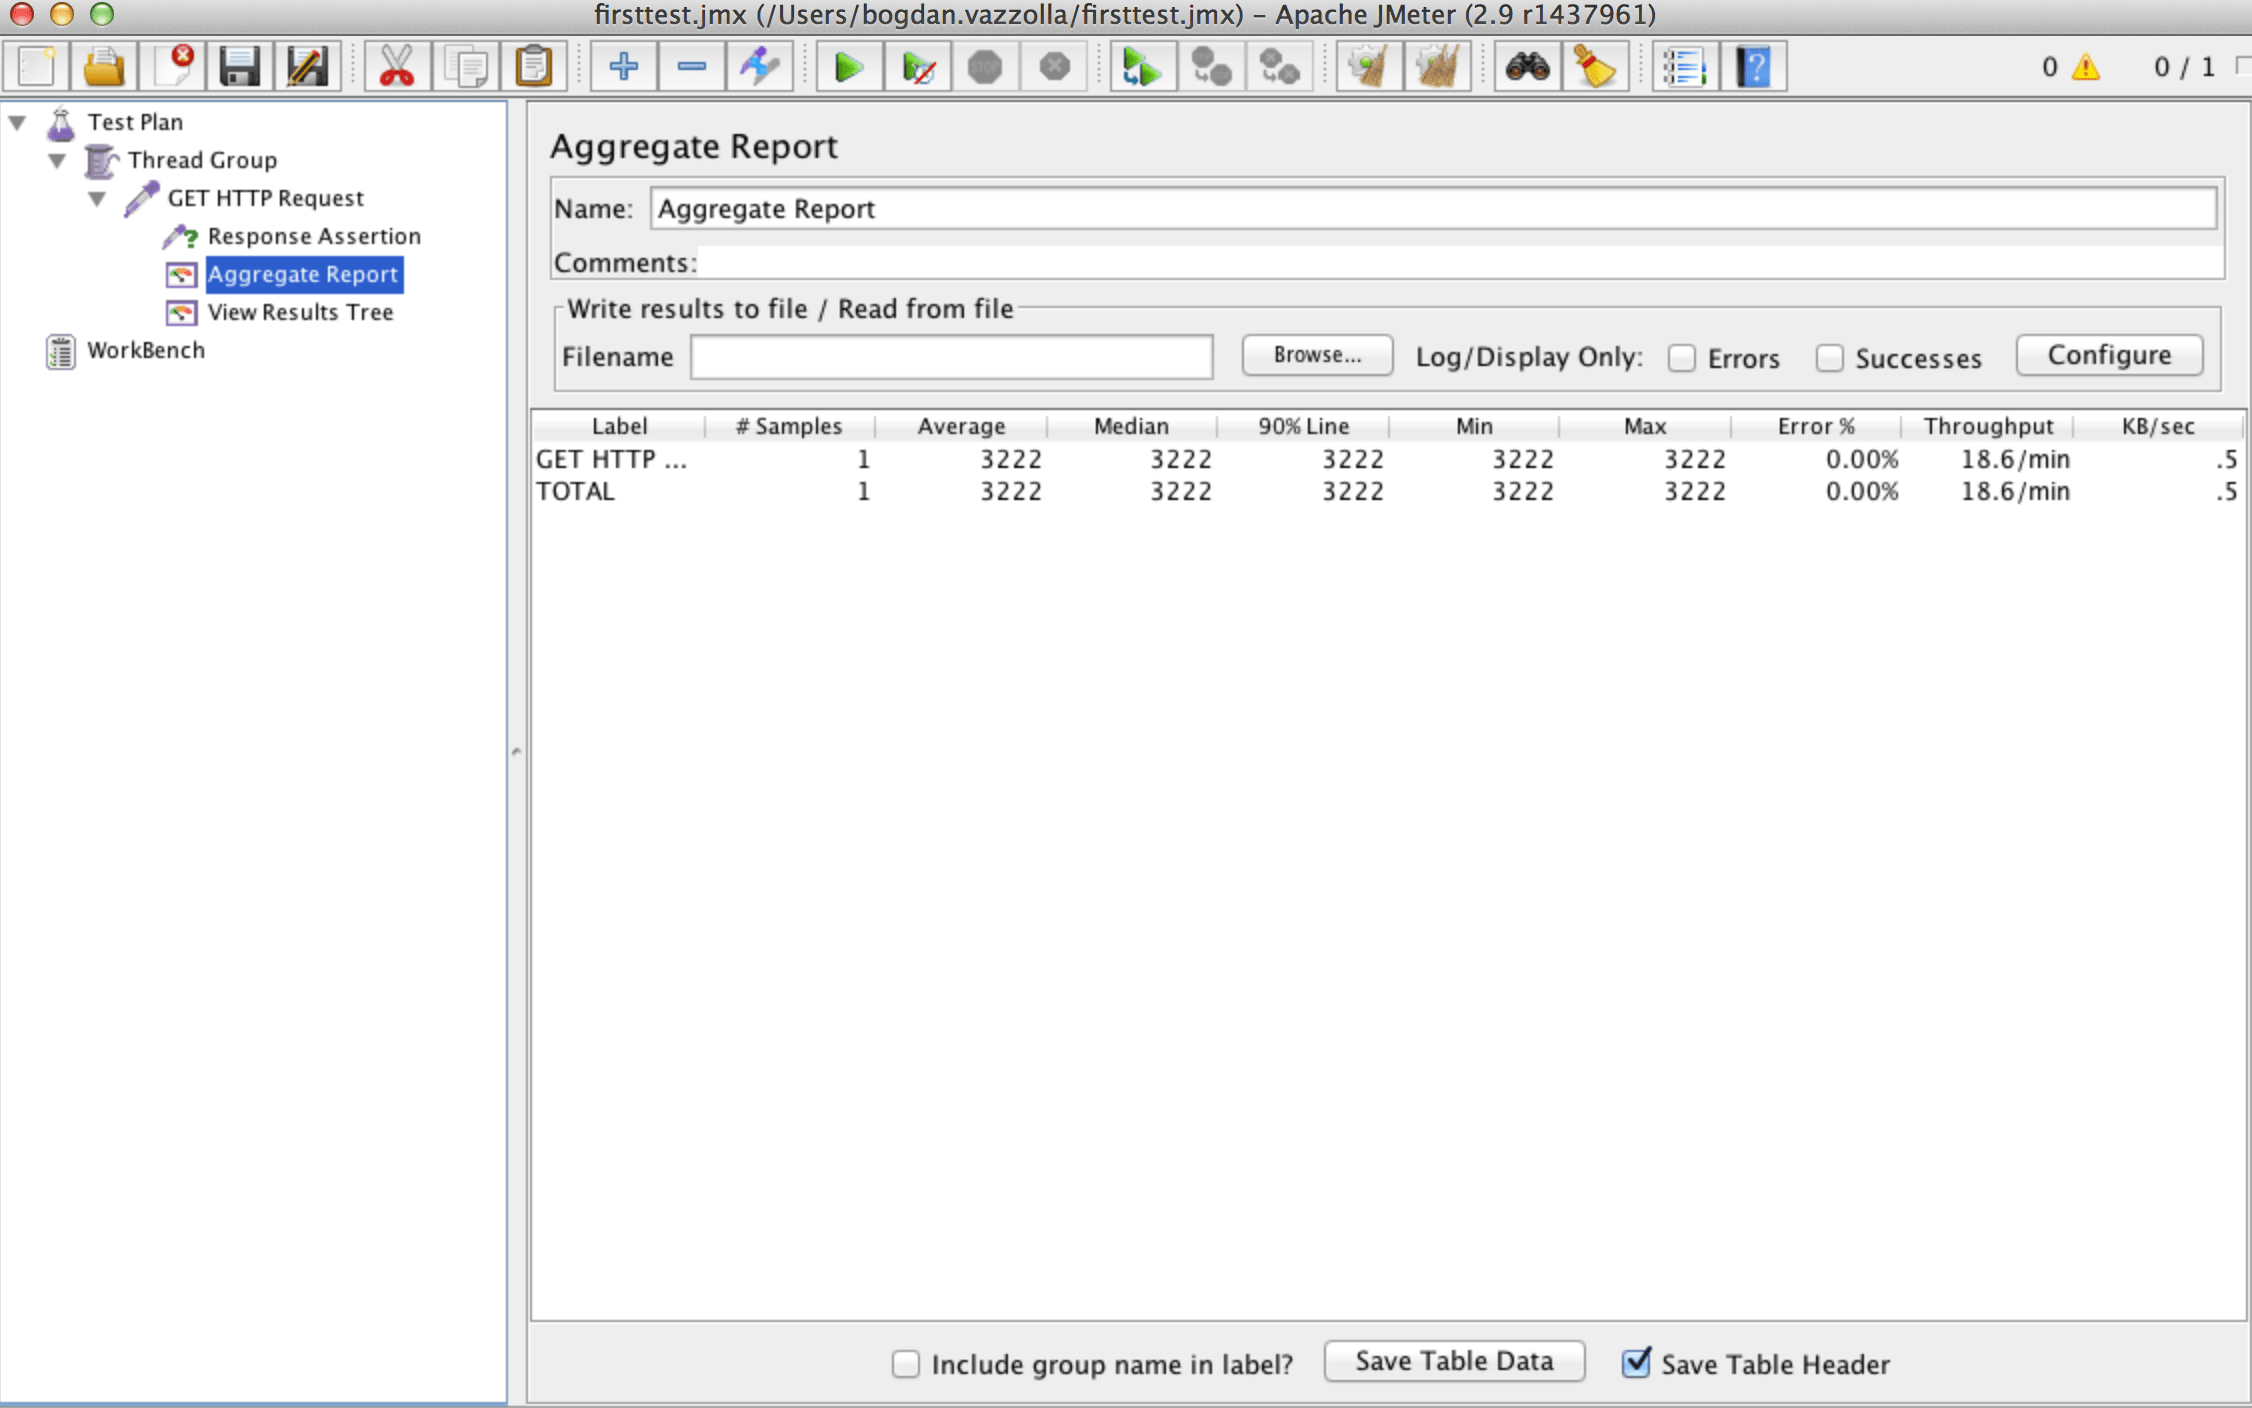
4. Adding Aggregate Reporting to the test
LoadFocus is an all-in-one Cloud Testing Platform for Websites and APIs for Load Testing, Apache JMeter Load Testing, Page Speed Monitoring and API Monitoring!
Steps
- In order to get a better understanding of the request executed we can add a Aggregate Report to the HTTP Sampler
- To do that Right Click HTTP Sampler and go to Add -> Listener -> Aggregate Report
- Click on the Aggregate Report from the left area and execute the test again (click RUN icon form toolbar or press Ctrl+R)
- In the Aggregate Report table you can see the test run results:
- Right Click the Aggregate Report and go to Help from the menu for a full description of the table fields (also you can see what response time or throughput means from out earlier posts)
- Same as for the View Results Tree you can export results to an external file, log only errors or successes in the table and in the external file
5. Exporting JMeter results data to an external CSV file
Steps
- In the View Results Tree listener you can enter the name of the results file: I.e. results.csv
- From the right side you can click on the Configure button to select what data to export in the CSV file
- Now run the test again the a file named results.csv will be created containing the test results for each request
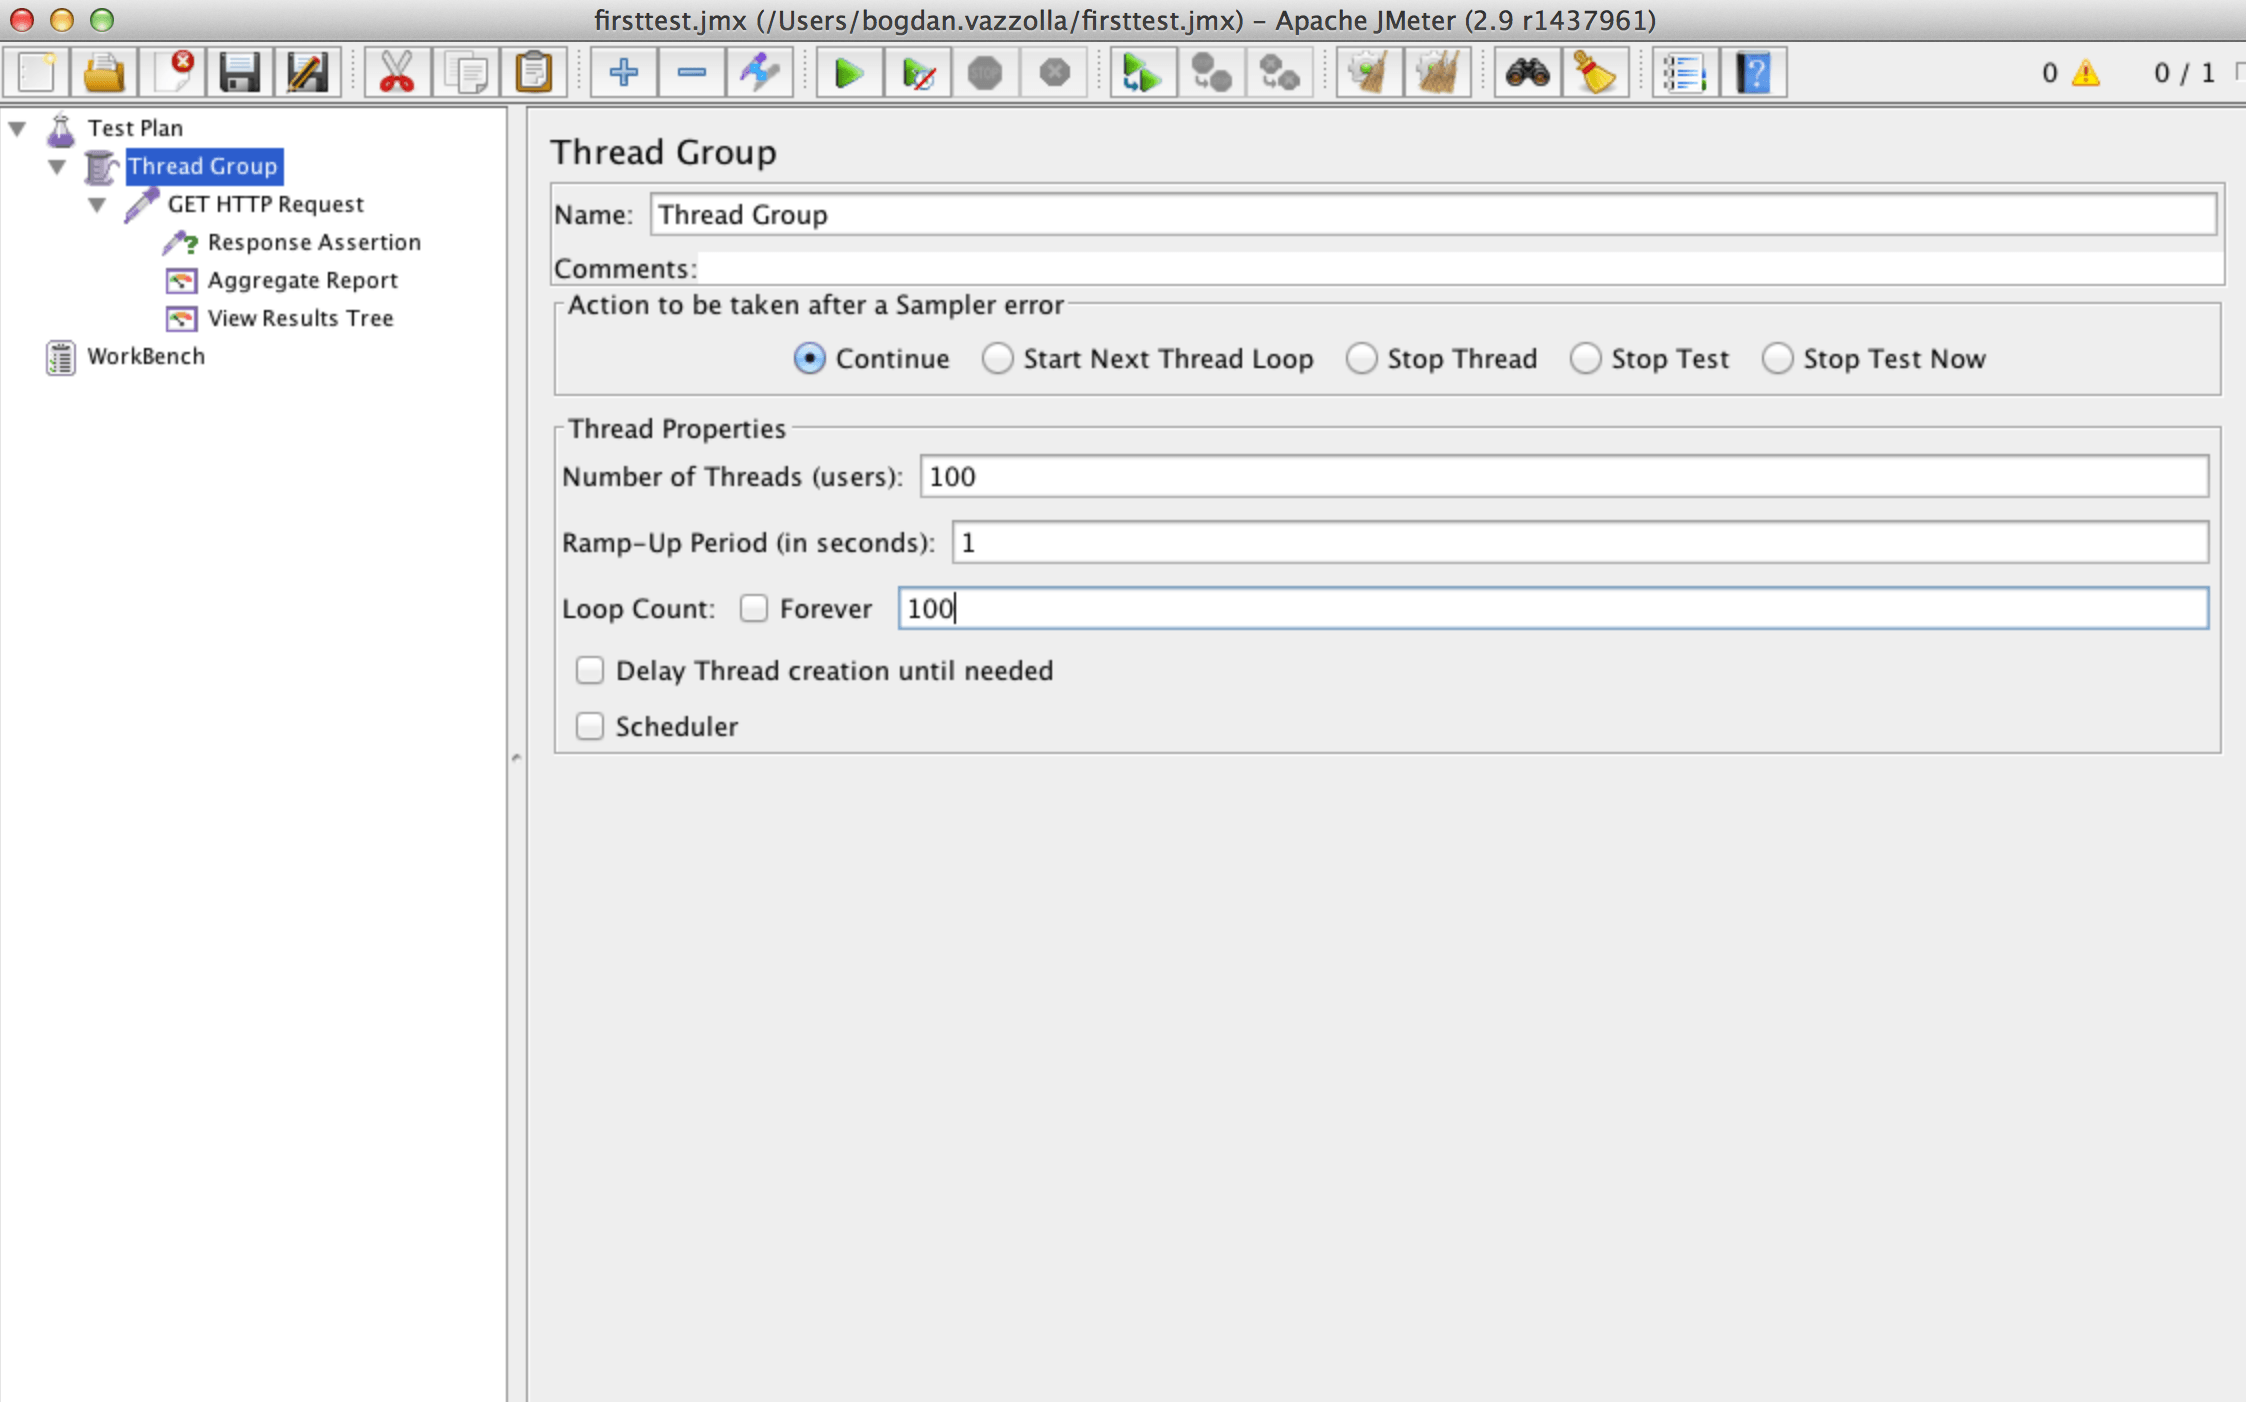
6. Change Threads and Loops for better performance tests
Steps
- Click on the Thread Group
- From the Number of Threads (users) field you can adjust the number of concurrent users executing the created request
- Ramp-Up Period sets the delay between starting new threads (users), if set to 0, the test will try to ramp-up all the threads from the beginning of the test run
- Loop Count sets the how many times each thread is going to execute the test
- Also options when an error occurs may be set from the Thread Group
- You can schedule a test run to execute between exact dates, for a preset interval and with a start up delay (seconds)
- With this performance test configuration you can start having an initial view of how to create a performance test with Apache JMeter.
Here are the steps in images
1. Add a new Thread Group to the Test Plan

2. Add a new HTTP Sampler
3. Configure the GET HTTP Request
4. Add visual reports
5. Add response assertion for response code
6. Add in detail reporting
7. Configure performance test
In the next posts I will present details of performance testing expressions: response time, latency, hits per second, transactions per second, throughput, and size per second.