Key Takeaways
What You Can Do Today
- Pinpoint API throughput bottlenecks by combining real-time monitoring with targeted load testing. This approach helps you identify spikes, uncover failure patterns, and observe how your system performs under realistic, production-like conditions.
- Account for rate limits set by your API providers from the outset. These limits often define your maximum throughput, especially during periods of high demand. For instance, on a financial platform with many users making live queries, failing to design around provider-imposed ceilings (such as maximum calls per minute) can lead to persistent HTTP 429 errors and lost transactions. Consider both architectural adjustments and, when justified, upgrading to higher API tiers.
- Balance throughput improvements with other metrics. High request-per-second numbers are only meaningful if error rates and latency remain low. Monitor latency, error rates, and resource usage alongside throughput to ensure real-world reliability. This comprehensive view is detailed further in our guide to detecting common API performance issues.
- Optimize across the stack. Improving throughput extends beyond the API endpoint. Refine database queries with indexing and pagination, implement caching, and compress responses to reduce payload size. Use asynchronous processing for efficient request handling and introduce load balancing to distribute demand. For global audiences or traffic spikes, Content Delivery Networks (CDNs) can help distribute requests and prevent regional slowdowns. For more on scalable system design, see our load testing strategies for e-commerce performance.
The most effective way to improve API throughput is a pragmatic mix of measurement, understanding provider constraints, and targeted engineering fixes. Always weigh throughput gains against their impact on reliability and user experience. Sustainable performance comes from addressing bottlenecks at every layer, not just tuning the API in isolation.
Illustrative Scenario: API Throughput Bottlenecks Threaten Financial Operations
A financial services platform encountered a critical challenge: API response times degraded and transaction failures increased during peak trading hours. Transactions that should clear in seconds were delayed, leading to customer complaints and jeopardizing the platform’s reputation for reliability. When many users accessed real-time data or executed trades simultaneously, the APIs slowed dramatically – or requests were rejected outright with HTTP 429 errors.
Is Your Infrastructure Ready for Global Traffic Spikes?
Unexpected load surges can disrupt your services. With LoadFocus’s cutting-edge Load Testing solutions, simulate real-world traffic from multiple global locations in a single test. Our advanced engine dynamically upscales and downscales virtual users in real time, delivering comprehensive reports that empower you to identify and resolve performance bottlenecks before they affect your users.
When API Response Times and Throughput Diverge
Traditional monitoring tools flagged slow response times but did not reveal the underlying API throughput limitations. Measuring the speed of a single API request is not enough; understanding how many requests the platform can process per second before performance degrades is crucial. During off-peak hours, latency metrics appeared normal, but as trading volume surged, the system could not keep up. The APIs hit their throughput ceilings, resulting in delayed and failed transactions.
This scenario highlights why API throughput is a business-critical concern in financial operations. While latency measures the speed of individual requests, throughput reflects the number of successful transactions handled per second. High throughput enables platforms to scale with demand without sacrificing transaction integrity or user experience. When throughput bottlenecks occur, even APIs with fast individual responses can fail under load.
Why Throughput Bottlenecks Are Hard to Spot
Throughput issues are not always obvious. Most monitoring dashboards focus on averages – response time, error rate, CPU utilization – but these do not always reveal the ceiling on request-handling capacity. Financial platforms are especially vulnerable to hidden throughput constraints due to factors like API provider rate limits, inefficient database queries, or lack of horizontal scaling. As discussed in our recent guide to API performance issues, these ceilings often appear only during true peak conditions, when business impact is greatest.
Think your website can handle a traffic spike?
Fair enough, but why leave it to chance? Uncover your website’s true limits with LoadFocus’s cloud-based Load Testing for Web Apps, Websites, and APIs. Avoid the risk of costly downtimes and missed opportunities—find out before your users do!
Analyzing throughput alongside latency, error rates, and infrastructure usage enables financial institutions to identify bottlenecks that matter most during live operations. For teams seeking to benchmark their systems, our API monitoring tools comparison offers practical starting points to visualize and act on throughput metrics in real time.
When core business processes depend on reliable, high-throughput APIs, pinpointing and addressing bottlenecks is essential for maintaining trust and competitiveness in the financial sector.
Challenge: When API Throughput Hits a Wall
Every high-volume financial platform eventually reaches a point where API throughput becomes a hard limit. During peak traffic, even mature systems can struggle. Requests accumulate, HTTP 429 errors (“Too Many Requests”) become frequent, and transactions fail. For businesses processing real-time payments or trades, these failures erode trust and revenue.
The root cause often lies in a mismatch between demand and system limits. You may have optimized for speed (latency), but when many clients refresh dashboards or trigger trades at once, the throughput ceiling becomes the bottleneck. Instead of slow responses, you see outright rejections, leaving users with incomplete actions and support teams searching for answers.
LoadFocus is an all-in-one Cloud Testing Platform for Websites and APIs for Load Testing, Apache JMeter Load Testing, Page Speed Monitoring and API Monitoring!
| Symptom | Root Cause | Business Impact |
|---|---|---|
| HTTP 429 errors during traffic surges | API rate limits reached as concurrent requests spike | Failed transactions, user frustration, increased support load |
| Long queues and delayed transaction confirmations | Back-end cannot process requests as quickly as they arrive | Missed payment windows, risk of regulatory non-compliance |
| Sudden drop in successful requests per second | Resource exhaustion (database, network) at high concurrency | Revenue loss, abandonment of platform during peak periods |
| API health checks report “degraded” status | Sustained throughput exceeds infrastructure capacity | Loss of trust from partners and enterprise customers |
Key Insight: Scaling API throughput means handling large volumes of concurrent requests without degradation or loss.
Throughput vs. Latency in Financial APIs
Teams often conflate latency and throughput, but these are distinct. Latency measures the speed of a single request; throughput reflects how many successful requests your system can handle per second, especially under heavy concurrent load. Fast individual responses do not guarantee success when many transactions hit the system at once.
This distinction is critical for high-stakes workflows. For example, a trading platform may process each trade confirmation quickly under normal conditions. But during market events, the system may hit provider-imposed rate limits or internal resource bottlenecks. Throughput limitations then lead to transaction delays, errors, and partial outages – issues that latency monitoring alone will not detect.
For a broader look at common bottlenecks, see 10 Common API Performance Issues and How to Detect Them. Optimizing API throughput requires a full-stack approach – caching, asynchronous processing, and strategic use of load testing platforms are all essential. The key lesson: if throughput stalls, business processes grind to a halt, regardless of individual request speed during off-peak periods.
Modern solutions, such as high-throughput modes offered by some vendors, demonstrate that supporting thousands of transactions per second is possible, but often requires trade-offs: dedicated infrastructure, streamlined personalization, and careful channel configuration. Financial services must weigh these options against their workload patterns, remembering that throughput is the metric that keeps high-volume business viable during critical moments.
Approach: Using LoadFocus to Uncover Throughput Bottlenecks
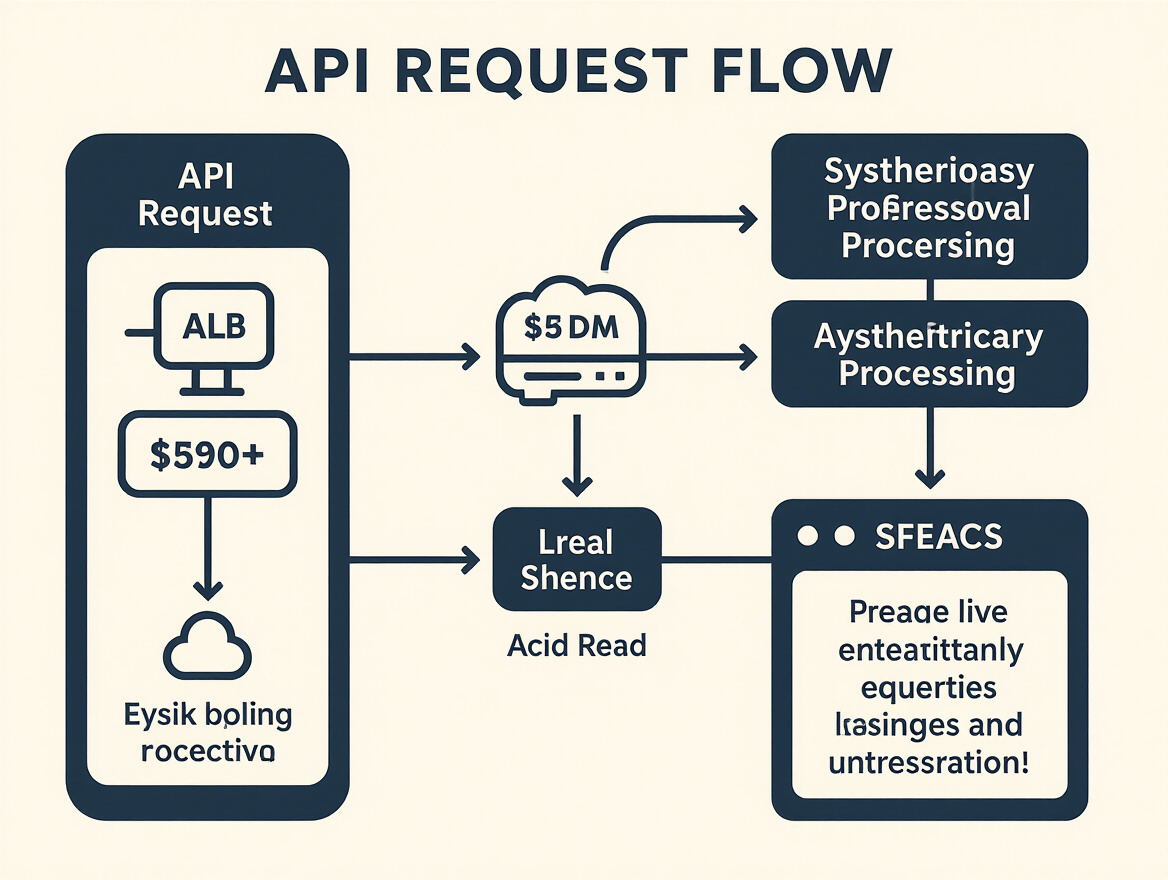
Pinpointing API throughput bottlenecks takes more than a basic benchmark. It requires realistic traffic simulation, granular metrics, and the flexibility to test a system’s limits without risking production stability. LoadFocus was deployed to meet these needs, offering targeted load tests that mirror the unpredictable surges and usage patterns found in financial services platforms.
With LoadFocus, the team could simulate realistic peak-hour traffic – many concurrent users triggering rapid API calls, as a fintech application might experience each trading morning. The tool’s integrated monitoring tracked not only throughput (requests per second), but also latency and error rates in real time. This made it possible to trace bottlenecks to their root cause, whether a rate-limit threshold, inefficient database query, or an overwhelmed load balancer.
Designing the Right Load Tests
Effective load testing depends on representing real-world conditions. With LoadFocus, test scenarios were constructed to stress the system in ways that matter for financial services:
- Concurrent user counts matched projected peak loads. For a trading platform, this meant many users polling for updates or submitting orders simultaneously.
- Request types reflected actual API calls that drive business value – such as account lookups, transaction postings, and data refreshes. Some endpoints are more resource-intensive than others.
- Rate limits imposed by the API provider were configured into each test. Hitting these ceilings (often resulting in HTTP 429 errors) exposes a real-world bottleneck that can impact user experience and revenue. Monitoring error rates alongside throughput and latency allowed for a nuanced analysis: was the system failing from overload, or being throttled by a quota?
Test iteration was rapid – each scenario could be launched, measured, and refined in minutes. This feedback loop is essential for diagnosing throughput ceilings and validating optimizations. For more on designing targeted scenarios, see this guide to load test design for progressive web apps.
Why Cloud Testing Wins for API Throughput Analysis
Local load testing can expose basic issues, but rarely matches the scale or network conditions of production – especially for high-throughput APIs. Cloud-based solutions like LoadFocus offer several advantages:
- Scale on demand: Simulate many distributed users instantly, without hardware procurement or complex setup.
- Global traffic simulation: Send API requests from multiple geographic locations, revealing bottlenecks masked by local conditions.
- Concurrent metric tracking: Monitor throughput, latency, error rates, and resource utilization in real time for a comprehensive performance view.
- Rapid iteration: Launch and adjust test scenarios in minutes, enabling fast diagnosis and validation.
Cloud testing also streamlines collaboration. Performance engineers, developers, and business stakeholders can view and interpret results from anywhere, speeding root-cause analysis and decision-making. For a detailed comparison of cloud and local testing strategies, see Cloud Load Testing vs Local Load Testing for Enterprises: A 2026 Comparison.
By combining targeted scenario design with cloud-based infrastructure, LoadFocus provided actionable insights into API throughput that local testing tools could not match. This approach surfaced hidden bottlenecks and set a clear path toward reliable, scalable performance under financial-grade traffic volumes.
Implementation: Step-by-Step Process to Optimize API Throughput
| Phase | Key Activities | Typical Duration | Output |
|---|---|---|---|
| Baseline | Collect pre-optimization throughput metrics, monitor latency and error rates, document API rate limits | 1 week | Comprehensive performance benchmark, clear throughput ceiling |
| Diagnosis | Analyze system logs, inspect slow queries, review rate limit breaches, monitor resource utilization | 1 – 2 weeks | List of primary bottlenecks, prioritized by impact |
| Remediation | Implement request batching, add caching, optimize indexes, adjust load balancing rules, update subscription tiers | 2 – 3 weeks | Code/config changes deployed, updated system architecture |
| Validation | Conduct post-fix load testing, monitor for error rates and sustained throughput, validate stability during simulated peak load | 1 week | Validated gains in API throughput, stable error/latency metrics |
Baseline: Measuring Current API Throughput
Every successful API throughput optimization project begins with a clear performance baseline. The team collected a week’s worth of throughput metrics – requests per second under both normal and peak traffic – using LoadFocus to automate load test execution and monitoring. Alongside throughput, they tracked latency and error rates, since a high RPS can mask issues like failed requests or slow response times. API rate limits imposed by upstream partners were also documented, with frequent HTTP 429 errors flagged as a warning sign. This phase produced a comprehensive benchmark and mapped out throughput ceilings, giving the team a clear improvement target.
For teams new to this process, this guide to detecting common API performance issues covers baseline measurement approaches and warning signs in more detail.
Diagnosis: Identifying Core Bottlenecks
With the baseline established, the focus shifted to pinpointing bottlenecks limiting throughput. Detailed log analysis revealed a pattern of rate limit hits from an upstream provider, resulting in traffic throttling during real-time data refreshes. The team examined slow database queries, finding endpoints where lack of pagination and missing indexes caused excessive load under concurrency. Resource utilization graphs from LoadFocus highlighted periods of CPU and memory contention, correlating with spikes in error rates and latency. By mapping these issues to specific workflow points, the team developed a prioritized list of bottlenecks – each backed by evidence from system metrics.
This diagnostic work benefited from close collaboration between DevOps, backend engineering, and QA. In practice, surfacing and fixing throughput issues rarely falls to a single role. For organizations looking to build this kind of cross-team capability, this deep dive on integrating performance testing with DevOps workflows is a good starting point.
Remediation: Applying Targeted Fixes
The remediation phase brought together targeted workflow changes to clear throughput roadblocks. The engineering team implemented request batching for endpoints with high-frequency polling, reducing outbound calls and staying within provider-imposed rate ceilings. Caching was deployed for predictable, high-volume queries, reducing redundant database work. Database engineers added indexes and enforced pagination, alleviating slowdowns under concurrent load. On the infrastructure side, load balancer rules were tuned to distribute requests more evenly, and the team upgraded to a higher API subscription tier to raise throughput ceilings. Each change was tested in pre-production using LoadFocus, with quick iteration cycles – no remediation was assumed effective until verified under simulated peak load conditions.
Optimizing database indexing and query patterns is one of the most effective strategies for increasing throughput without sacrificing reliability. For more actionable techniques, see this list of load testing strategies for high-traffic sites.
Validation: Confirming Sustainable Throughput Gains
With all fixes in place, the team launched a new round of load tests to validate improvements. This time, they focused on sustained throughput under simulated peak traffic, monitoring error rates and latency distributions. The results confirmed that bottlenecks had been addressed: the system maintained a higher RPS for extended periods, with stable response times and fewer HTTP 429 errors. The QA team ran soak tests to ensure gains held up over hours of continuous load, not just short bursts. These validation steps provided confidence that throughput improvements were reliable under production-like conditions.
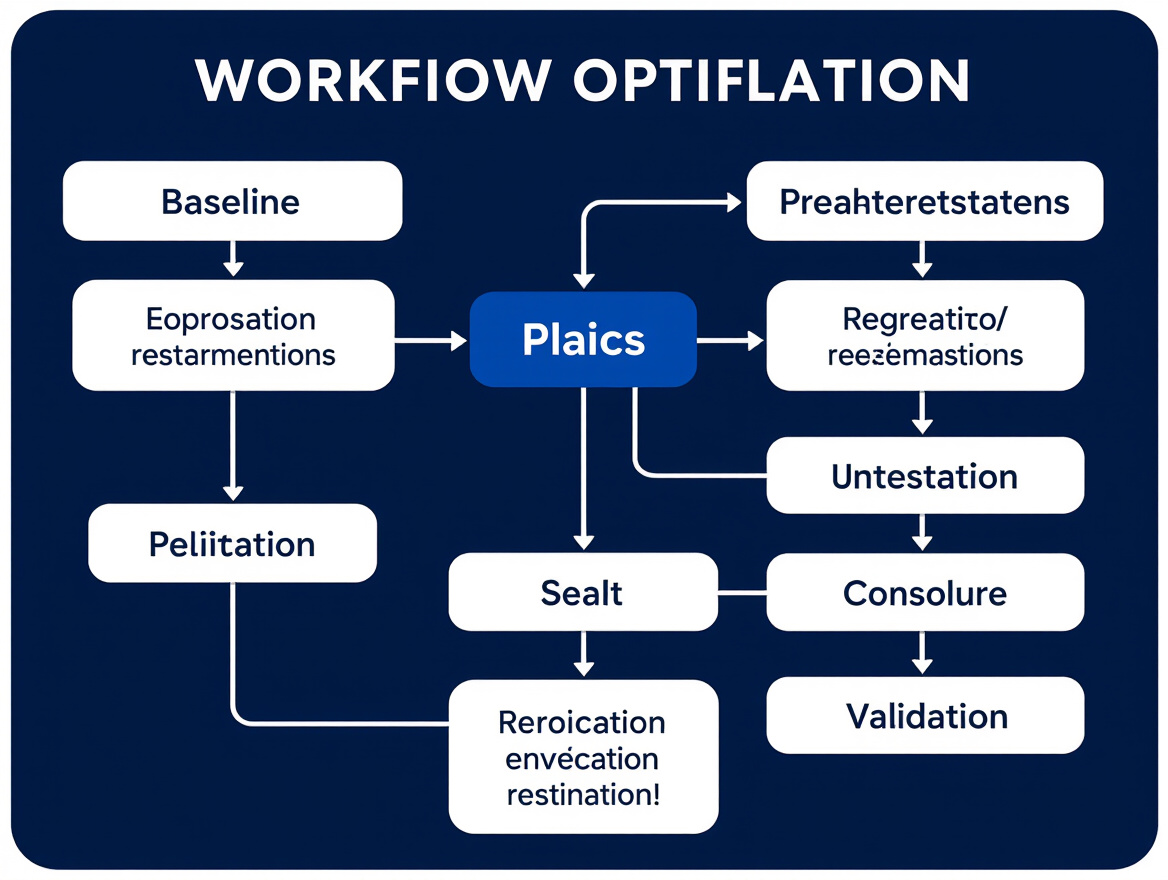
This iterative, metrics-driven process – baseline, diagnose, remediate, validate – became a playbook for ongoing API performance work. By fostering cross-functional collaboration and using real testing data to guide each decision, the team ensured that throughput gains were both measurable and sustainable.
Optimization Techniques: How Each Change Impacted API Throughput
Key Insight: Strategic optimization – across database, caching, rate management, and concurrency – delivers measurable, compounding gains in API throughput that no single fix can achieve alone.
Database Query Optimization: Indexing, Query Rewriting, and Pagination
Inefficient database queries can quietly undermine throughput. Indexing was the first priority. By adding indexes to high-traffic columns used in API filters, the platform reduced full-table scans and kept CPU use manageable. For example, a customer transactions endpoint that previously scanned large datasets began returning filtered results more quickly.
Pagination improved concurrency. Instead of returning large numbers of rows per API response, endpoints defaulted to smaller pages, with customizable limits. This reduced memory pressure on the backend and helped prevent client-side timeouts during peak loads. Query rewriting also played a role: by simplifying SELECT statements and avoiding unnecessary JOINs, the system handled more requests in parallel without deadlocks or slow queries stacking up.
These changes didn’t just lower average response times – they increased the number of concurrent requests the system could process. For a deep dive into testing these bottlenecks, see 10 Common API Performance Issues and How to Detect Them.
| Technique | Pre-Optimization Pattern | Post-Optimization Pattern | Impact on Throughput |
|---|---|---|---|
| Database Indexing | Full-table scans on every request, slow filter queries | Indexed columns for frequent filters | Requests per second increased due to faster queries and reduced CPU spikes |
| Pagination | Large unpaginated result sets returned per call | Default pages of 50 records, client-controlled limits | Lower memory usage, higher concurrency during peak traffic |
| Caching | Cache-miss on every request – even for duplicate data | In-memory cache for frequent queries | Reduced redundant processing, improved response times |
| Response Compression | Uncompressed JSON responses | Gzip or Brotli compression enabled | Lower bandwidth, faster delivery to clients |
| Asynchronous Processing | Blocking, synchronous request handling | Async processing with event loop | Handled more parallel requests under surge loads |
| Load Balancing | Single server handling all traffic | Requests distributed across multiple servers | Eliminated bottlenecks, maximized throughput during spikes |
Caching and Response Compression
Caching distinguishes between a server straining under every request and one that handles repeated queries efficiently. By implementing an in-memory cache for frequently accessed resources – such as exchange rates or user profile lookups – the system avoided redundant database hits. This reduced backend workload and made response times more consistent under load.
Response compression also delivered value. Switching from raw JSON to Gzip or Brotli reduced payload sizes, especially on endpoints serving large datasets. The result: less bandwidth consumed and lower latency between the API and client, even if backend processing speed remained unchanged.
Here’s a before/after comparison:
| Before | After |
|---|---|
| API endpoint returns large datasets and recalculates the same financial summary on each call, regardless of data freshness or user session. | Endpoint returns paginated results and serves cached summaries for any request within a short time window, recalculating only on data change. |
The improved approach reduces repeated computations and minimizes data transfer. Clients receive only what they need, while the backend remains responsive as traffic scales.
Managing API Rate Limits
No matter how efficient your backend, API provider rate limits can still throttle throughput. Financial platforms feel this most during high-frequency trading or mass portfolio refreshes. The solution is a mix of request pacing, batching, and, where possible, negotiating higher limits with providers.
- Request pacing smooths out traffic spikes, sending requests in controlled bursts instead of overwhelming provider limits.
- Batching groups multiple logical requests into a single call where supported, reducing total API calls per minute.
- If ceilings are still hit, teams may negotiate higher-tier plans or dedicated throughput pools with API providers.
These adjustments protect against 429 errors and ensure every allowed request delivers value. For more on detecting and resolving throttling issues, see 10 Common API Performance Issues and How to Detect Them.
Load Balancing and Asynchronous Processing
When user traffic surges, single-threaded request handling cannot keep up. Moving to asynchronous processing – where requests are handled in parallel using event-driven frameworks – increases the number of active connections the API can sustain. This change enables the system to absorb sudden spikes while maintaining throughput and stability.
Load balancing further distributes requests across multiple backend servers and regions, avoiding single points of failure and maximizing available resources. Combined, these techniques help maintain high throughput even when many clients refresh data simultaneously.
For example, before optimization, an API would stall as concurrent requests queued up. After implementing async handlers and a round-robin load balancer, those requests were processed in parallel, dramatically increasing completed requests per second.
For teams addressing similar challenges in distributed or cloud-native environments, Why Performance Testing Matters More Than Ever for Cloud-Native Applications in 2026 explains how modern architectures benefit from these strategies.
Real API throughput gains result from layering these optimizations. There is no single fix – only a series of well-executed changes that, together, make high-traffic systems reliable and scalable under pressure.
Results: Sustainable API Throughput Gains and Business Impact
Noticeable Gains in Throughput and Error Reduction
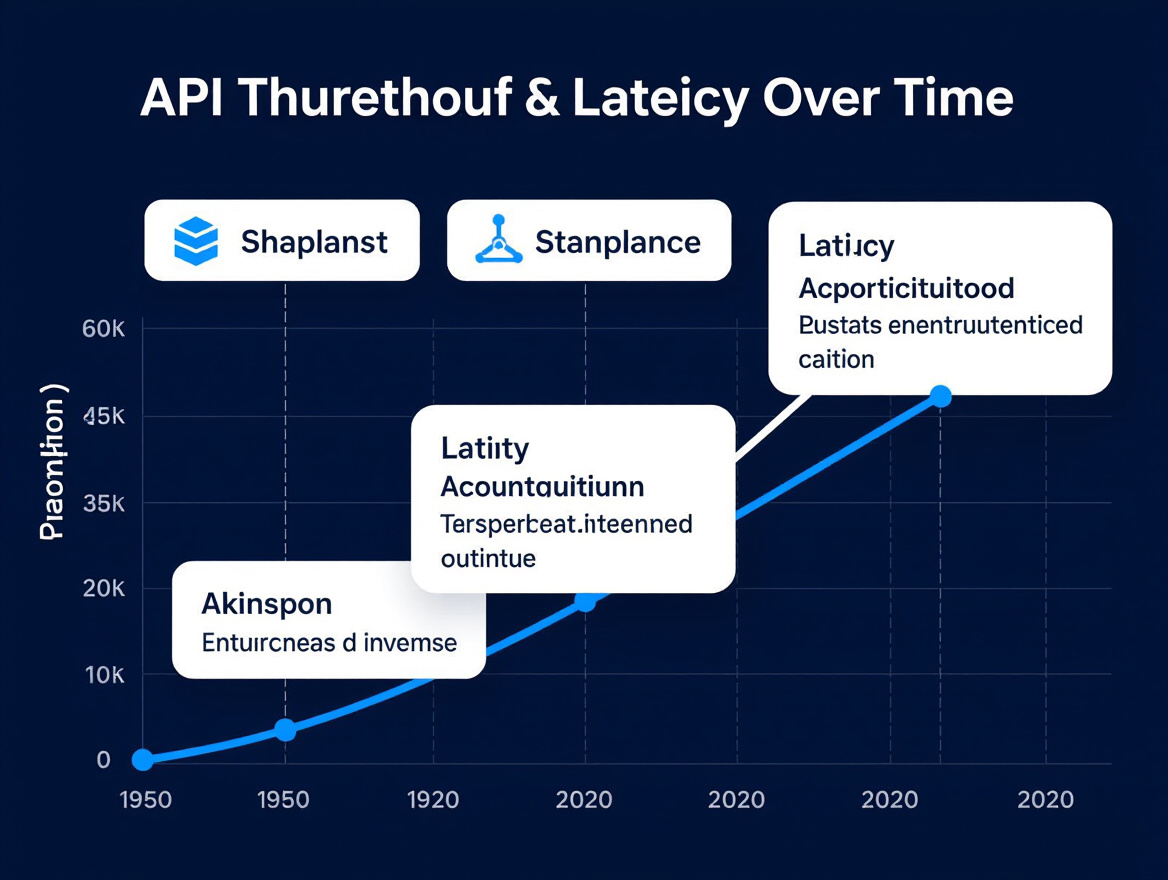
The optimization process led to a measurable increase in API throughput under realistic load, with fewer dropped requests and a reduction in HTTP 429 and 5xx errors at peak times. By targeting bottlenecks such as unoptimized database queries and inefficient rate limit handling, the system could process more successful transactions per second without overwhelming critical infrastructure. These improvements held steady even as concurrent user counts and request rates surged during simulated peak periods.
User Experience at Peak Times
For end users, the most visible benefit was a smoother transaction experience during high-traffic windows. Checkout abandonment decreased as fewer requests failed or stalled. This outcome reflects the direct link between operational improvements and faster response times and higher completion rates at critical moments.
Before/After: Error Rates and Responsiveness
| Before | After |
|---|---|
|
During load tests, a significant portion of checkout requests failed with HTTP 429 or 500 errors at high request rates. Response times spiked for many users during flash sales. |
Error rates dropped at the same throughput, with most requests completing quickly. Even as simulated traffic increased, performance remained stable. |
The improved system ties operational changes directly to better customer outcomes: faster checkouts and fewer transaction failures, even under stress. This is the standard for high-quality API monitoring and throughput optimization.
Key Insight: True API throughput gains are measured by sustained low error rates and reliable user experience during periods of peak demand – not just by higher RPS.
Sustaining Performance, Not Just Spiking It
A common pitfall in performance work is chasing short-lived improvements that collapse under real-world conditions. Here, the gains proved sustainable across multiple test cycles and production spikes. LoadFocus’s cloud testing platform enabled ongoing monitoring, ensuring that optimizations became part of system resilience. This sustainable approach is central to building trust in API-driven services – where every transaction counts, and recovery from failure carries real business cost.
Organizations that invest in rigorous throughput testing and iterative improvement see meaningful results: improved reliability, fewer customer complaints, and direct revenue protection when demand peaks. In financial platforms and e-commerce alike, API throughput is both a technical metric and a business differentiator.
Lessons Learned: Transferable Insights for API Throughput Optimization
Why Comprehensive Metrics Matter
Teams sometimes focus exclusively on API throughput – the raw number of requests handled per second – without considering the broader performance picture. Throughput must be evaluated alongside latency, error rates, and resource utilization. A system pushing high transaction volumes but returning slow responses or frequent HTTP 429 errors is not meeting business needs. For financial platforms, it’s not just about more transactions, but ensuring each one completes successfully and swiftly, even when many users refresh live data at once.
Continuous Monitoring and Proactive Testing
The environment for high-volume platforms is rarely static. New features, traffic patterns, or provider changes can all impact throughput. That’s why ongoing monitoring and proactive performance testing are essential. Integrating real-time monitoring with load testing lets teams catch emerging bottlenecks before they become outages. For a practical guide to extending this mindset across cloud providers and architectures, see How to Set Up End-to-End Performance Testing for Multi-Cloud.
Throughput ceilings set by API vendors can shift unexpectedly, especially when moving between test and production environments. Monitoring these limits – and periodically stress-testing them – helps avoid surprises during critical business events. LoadFocus, for example, makes it straightforward to simulate large user loads and track real-time error spikes or throughput degradation as you approach rate limits.
Cross-Team Collaboration Drives Success
Optimizing API throughput is rarely the responsibility of a single team. Diagnosing and resolving performance bottlenecks requires close coordination between engineering, DevOps, infrastructure, and business stakeholders. For example, database indexing or caching changes might boost throughput but could also affect data freshness or reporting logic – trade-offs that must be understood in context. Teams that share metrics transparently and review results together resolve issues faster and build a shared understanding of systemic constraints.
In high-stakes industries like finance, where milliseconds can affect user trust and regulatory compliance, integrated performance strategies are critical. If you’re looking to connect performance testing results to operational KPIs, see this post on integrating load testing results with business KPIs to bridge the gap between technical tuning and business impact.
Generalizable Takeaways
- Balance throughput, latency, and reliability – optimizing one at the expense of others leads to brittle systems.
- Monitor continuously – today’s throughput ceiling could be tomorrow’s bottleneck as requirements evolve.
- Collaborate early and often – cross-functional insight uncovers blind spots and accelerates root cause analysis.
- Study industry examples – learn from high-throughput financial and SaaS architectures, but adapt best practices to your stack and user base.
The lesson is clear: real-world API throughput optimization is an ongoing, collaborative process that rewards teams willing to measure broadly, adapt quickly, and communicate openly.
Practical Considerations and Limitations of API Throughput Improvements
Throughput Ceilings: Provider-Imposed Rate Limits
Boosting API throughput is appealing, but every API consumer eventually encounters hard rate limits set by providers. These ceilings – measured in requests per minute or hour – are designed to protect shared infrastructure. As you optimize your backend for higher concurrency, these limits can quickly become the bottleneck, especially in high-frequency industries like financial services. No matter how efficiently you process transactions internally, hitting a rate ceiling will trigger HTTP 429 errors and stalled functionality. Upgrading to a higher subscription tier or negotiating custom limits is sometimes possible, but these options often add cost and complexity.
Error Handling: The Hidden Cost of Chasing Throughput
Focusing solely on maximizing throughput can distract from effective error management. Pushing more requests per second is meaningless if it leads to higher error rates or degraded user experience. During performance testing, monitor not just throughput, but also latency, error rates, and resource utilization. A system with high throughput but frequent errors or slowdowns is not delivering meaningful value. As discussed in 10 Common API Performance Issues and How to Detect Them, error spikes often accompany aggressive load increases, revealing weak points that might go unnoticed during lighter testing.
Trade-Offs: Flexibility, Personalization, and Infrastructure Costs
Some of the most effective techniques for improving API throughput – like response caching, asynchronous processing, or sharding across multiple servers – can introduce their own trade-offs. For example, implementing high-throughput modes, as seen in recent real-time messaging platforms, often means limiting personalization options to preserve performance. Specialized setups may require dedicated IP pools, more complex channel management, and significant infrastructure investments. Not every organization can justify these changes, especially if their business model depends on granular customization or operates on thinner margins. For a detailed look at balancing infrastructure strategy, see Performance Testing Serverless Architectures Guide 2026.
Industry Trends: High-Throughput Modes and Comprehensive Strategy
The drive for higher API throughput is clear, with vendors offering modes designed for massive transactional scale. However, throughput should never be considered in isolation. Effective optimization balances speed with reliability, error resilience, and operational cost. Teams that focus only on throughput risk missing subtleties around real-world usage patterns and long-term maintainability. The most successful performance strategies integrate throughput improvements with comprehensive monitoring, thoughtful error handling, and ongoing infrastructure review.
Frequently Asked Questions
What is API throughput, and why does it matter for financial platforms?
API throughput measures how many requests or transactions an API can successfully process per unit of time, typically expressed as requests per second (RPS) or transactions per second (TPS). For financial services platforms, high throughput is essential to handle large transaction volumes – such as trades, balance checks, or price updates – without delays or failures. While latency tracks the speed of individual requests, throughput reflects a system’s capacity to serve many users concurrently. Insufficient throughput can cause slowdowns or failed requests during peak activity, impacting user experience and potentially leading to lost business.
How can I improve API throughput for my financial services API?
Improving throughput begins with identifying existing bottlenecks. Common strategies include optimizing database queries with indexing and pagination, implementing caching to avoid redundant calculations, compressing API responses to reduce transfer times, and introducing asynchronous processing so multiple requests are handled in parallel. Load balancers or Content Delivery Networks (CDNs) can help distribute traffic and reduce server strain. It’s critical to monitor how these changes affect error rates and latency – improving throughput in isolation can sometimes degrade overall performance. For more on common causes and detection methods, see 10 Common API Performance Issues and How to Detect Them.
What role does LoadFocus play in testing API throughput?
LoadFocus provides a cloud-based environment to run load and performance tests against your APIs. You can simulate many concurrent users to see how your API responds under real-world traffic spikes. The platform’s analytics track throughput, latency, error rates, and resource utilization in real time. This helps you pinpoint where performance drops off, whether due to application logic, database capacity, or infrastructure issues. You can also compare results across test runs to validate the impact of optimization efforts.
How do rate limits affect API throughput, and how can I work within these constraints?
Most API providers impose rate limits – caps on the number of requests per minute or hour – to protect shared infrastructure. Hitting these limits results in HTTP 429 “Too Many Requests” errors, which can disrupt user sessions and cause data delays. For financial platforms with many users, rate limits are a frequent bottleneck. To work within these constraints, monitor your usage closely, implement request throttling or queuing in your client logic, and consider upgrading your API plan if higher limits are available. Optimizing request patterns (such as batching updates or reducing polling frequency) can also help maximize throughput within allowed quotas.
How do I properly measure and interpret API throughput test results?
Throughput is calculated as the total number of successfully completed requests or transactions divided by the elapsed test time. However, raw throughput numbers don’t tell the full story. Always analyze throughput alongside latency and error rates. For example, a spike in throughput that coincides with a high failure rate or slow response times signals underlying problems. Use test runs at different traffic levels to find the balance between maximum capacity and reliable performance. For guidance on integrating throughput testing into your broader performance strategy, review the insights in How to Integrate Load Testing Results with Business KPIs.
What best practices should I follow for monitoring API throughput in production?
- Set up automated monitoring to track throughput, error rates, and latency in real time.
- Configure alerts for abnormal patterns, such as throughput drops or an uptick in failed requests.
- Use API monitoring tools that support detailed analytics and historical trend analysis.
- Correlate throughput metrics with business events – like market opens or product launches – to anticipate surges.
- Regularly review logs and monitoring data to catch emerging issues before they escalate.
For an overview of tools that can help, see 11 Tools to Monitor API Performance and Availability in Real Time (2026).
Are there industry examples of high-throughput API solutions relevant to financial workloads?
Yes. Some platforms offer high-throughput modes supporting thousands of transactions per second by using dedicated IP pools and streamlined channel routing. While financial services APIs often require more complex personalization, the underlying principles – specialized infrastructure, horizontal scaling, and simplified processing paths – are highly relevant. Adapting these approaches can help financial platforms design resilient, scalable solutions for demanding workloads.
What’s the difference between throughput and latency, and why does it matter?
Throughput measures volume: how many requests you can process at once. Latency measures speed: how fast each request is completed. A system can have low latency for single requests but still suffer from poor throughput if it cannot handle many users at once. For financial platforms, both are required – fast response times and the ability to scale during trading surges or market events.
Conclusion: Achieving Reliable API Throughput
Achieving reliable API throughput is essential for financial platforms that demand high performance and reliability. By focusing on a comprehensive approach that includes monitoring, testing, and collaboration, businesses can ensure their systems are prepared for peak demand. Implement these strategies to enhance your platform’s performance and maintain a competitive edge in the financial sector.
For more insights and strategies, explore our detailed guide on API performance issues.
Powered by PostNext service