Performance Testing in DevOps: Misconceptions and Realities
Performance Testing’s Role in DevOps
Performance testing in DevOps is far more than a final stress test before launch. It’s a continuous, integrated practice that evaluates an application’s speed, scalability, and stability throughout development. This approach is essential for teams aiming to deliver quality software quickly, without sacrificing reliability or user experience. Performance testing DevOps means embedding tests directly into automated pipelines, running them with every code commit, merge, and build, not just at the end of the cycle.
Common Myths: What Performance Testing Isn’t
A persistent misconception is that performance testing is only relevant at the end – a box to check before release. This view is outdated. As noted in a recent TechInsights survey, 70% of organizations using DevOps now integrate performance testing into their CI/CD pipelines, rather than treating it as a last-minute gate. Another myth is that performance testing is too slow for agile workflows. In reality, automated tests can significantly reduce testing time, making it feasible to run them on every build without clogging up the pipeline.
Is Your Infrastructure Ready for Global Traffic Spikes?
Unexpected load surges can disrupt your services. With LoadFocus’s cutting-edge Load Testing solutions, simulate real-world traffic from multiple global locations in a single test. Our advanced engine dynamically upscales and downscales virtual users in real time, delivering comprehensive reports that empower you to identify and resolve performance bottlenecks before they affect your users.
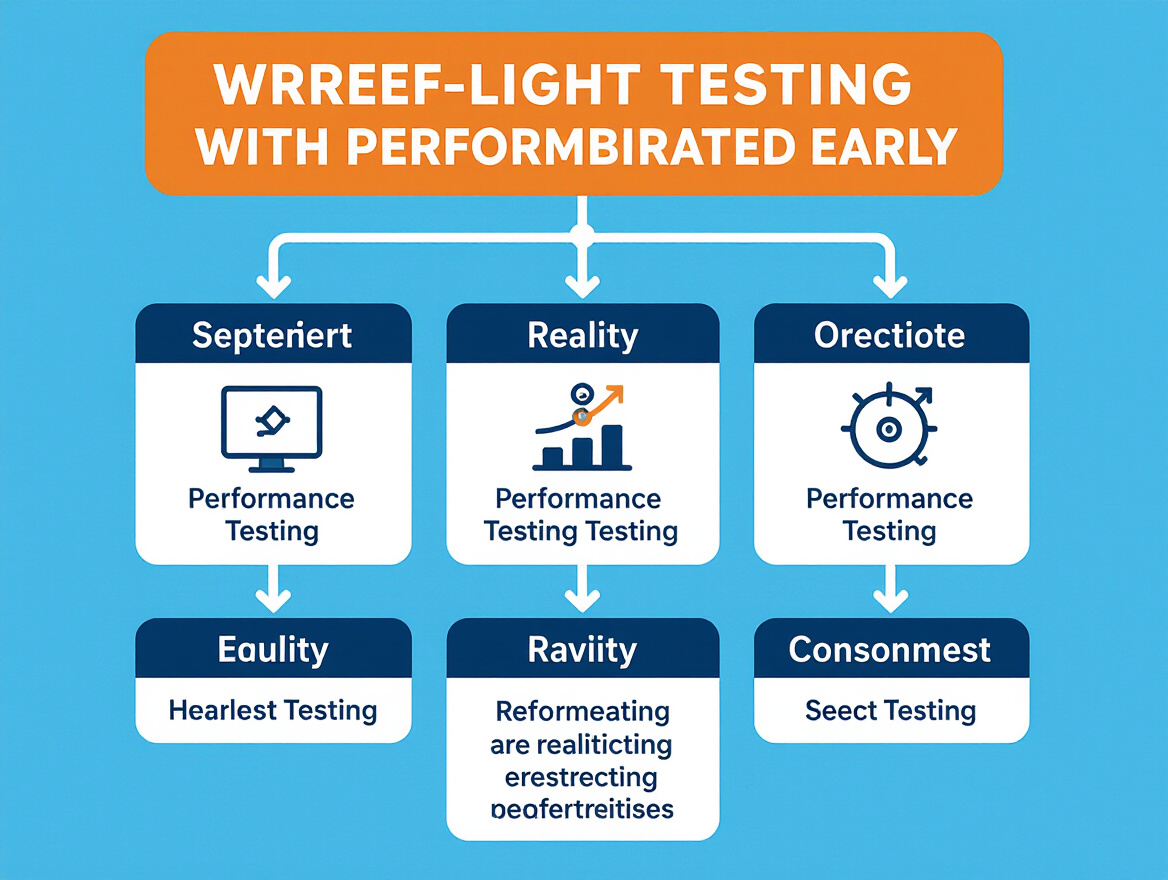
Key Insight: Integrating performance testing early and continuously into DevOps pipelines leads to higher quality releases and reduces costly post-launch performance issues.
Why Integration Is Now Essential
Integrating performance testing into DevOps is now a necessity for teams focused on stability and speed. Automated tests triggered by every code change surface issues before they escalate. Teams following this approach report a marked reduction in performance-related defects after launch. This proactive stance prevents late-stage surprises and supports a rhythm of frequent, reliable releases.
Cloud-based tools such as LoadFocus have made this integration practical, offering scalable infrastructure to simulate real-world loads and analytics to interpret results quickly. The shift-left trend – testing earlier in the development cycle – enables teams to address performance bottlenecks during development, not after delays have set in.
There are challenges: automated testing requires thoughtful setup, and poorly tuned thresholds can trigger false alarms. But the payoff is substantial: issues are caught early, accountability is shared, and release cycles remain fast without sacrificing user experience.
Think your website can handle a traffic spike?
Fair enough, but why leave it to chance? Uncover your website’s true limits with LoadFocus’s cloud-based Load Testing for Web Apps, Websites, and APIs. Avoid the risk of costly downtimes and missed opportunities—find out before your users do!
Why Embed Performance Testing in DevOps Toolchains?
Speed and reliability are essential in modern software delivery. With users expecting instant response times and smooth experiences, integrating performance testing into DevOps toolchains addresses the pressure to deliver high-quality releases on tight timelines. This integration ensures applications can handle real-world loads and deliver consistent performance from the outset.
As highlighted by a recent TechInsights survey, 70% of organizations adopting DevOps have embedded performance testing into their CI/CD workflows. These teams report a 30% reduction in post-release defects tied to performance issues. This shift is about more than catching problems before users do – it’s about building a culture of continuous improvement and accountability across development, QA, and operations.
The Shift-Left Approach: Testing Early for Better Outcomes
The traditional “test at the end” mindset is being replaced by the shift-left approach: moving performance testing earlier in the development lifecycle. By integrating these checks as soon as code is committed or merged, teams can identify bottlenecks and regressions long before they reach production.
This strategy is especially effective in cloud and containerized environments, where infrastructure can be provisioned rapidly to simulate realistic user loads. Modern cloud testing platforms like LoadFocus enable teams to automate performance checks as part of every build, providing instant feedback to developers. Instead of waiting until the final QA phase to discover a memory leak or slow API endpoint, issues are surfaced when they’re cheapest to fix – during development, not after launch.
LoadFocus is an all-in-one Cloud Testing Platform for Websites and APIs for Load Testing, Apache JMeter Load Testing, Page Speed Monitoring and API Monitoring!
Early detection requires a culture shift. Teams must invest in automated scripts, define baseline performance standards, and tune thresholds to avoid alert fatigue. The payoff: less firefighting, fewer late-stage surprises, and greater confidence in every release.
Continuous vs. Traditional Testing: Why Integration Matters
Legacy performance testing relied on manual scripts and isolated test cycles, typically at the end of a release. This approach was slow, costly, and often missed problems that only emerged under production-like traffic. Manual processes struggle to keep up with rapid iteration and frequent deployments, meaning performance issues too often slip through the cracks.
By contrast, DevOps-integrated performance testing automates tests with every code push, leveraging cloud scalability to simulate spikes in demand and complex user interactions. With platforms like LoadFocus, teams gain real-time insights into peak traffic response and trend analysis across builds. Automated pipelines ensure that even small changes are validated for performance impact, not just functionality.
There are challenges – resource consumption, tool complexity, and the risk of noise from poorly tuned thresholds. But for teams serious about release quality, integrating performance testing into DevOps processes is quickly becoming a baseline expectation.
Core Components of Performance Testing in DevOps
Effective performance testing DevOps integration is built on tightly connected components that enable teams to deliver reliable, scalable software at speed. Let’s examine the core elements that bring performance testing from an afterthought to a continuous, data-driven discipline inside DevOps pipelines.
Test Scripting: Defining Realistic Workloads
Test scripting is the foundation of any performance testing effort. Well-crafted scripts simulate real user behavior and application flows, covering everything from simple API checks to complex multi-step workflows. In a DevOps context, these scripts should be version-controlled alongside application code, with updates triggered by feature changes or new requirements. This ensures alignment between evolving software and the tests that validate its performance.
Automation: Embedding Testing into CI/CD
Manual performance tests can’t keep pace with rapid DevOps iterations. Automation is essential. By integrating test execution into CI/CD platforms – triggered on code commits, merges, or nightly builds – teams receive continuous feedback on speed and scalability. Automated performance testing has been shown to reduce test time by up to 40%, enabling faster, more frequent releases without risking quality.
Baselining: Knowing What “Good” Looks Like
You can’t improve what you can’t measure. Baselining involves establishing a performance benchmark for your application under typical and peak loads. This reference point makes it possible to spot regressions early and track performance trends over time. Teams should create and update baselines regularly, especially after major releases or infrastructure changes, to ensure meaningful data for each new build.
Monitoring: Real-Time and Historical Insights
Performance testing in DevOps doesn’t end when the test finishes. Monitoring both during and after tests provides visibility into system health, resource usage, and bottlenecks. Modern tools, including cloud platforms like LoadFocus, offer real-time dashboards and historical analytics, allowing teams to catch anomalies as they happen and analyze long-term trends to prevent issues before they affect users.
Collaboration and Reporting: Turning Data into Action
No tool or script replaces the need for cross-team collaboration. Developers, testers, and operations staff must work together to interpret results, set realistic thresholds, and prioritize fixes. Automated reporting – integrated with chat tools or dashboards – makes performance data accessible and actionable. This culture of shared responsibility is fundamental to successful performance testing DevOps adoption.
| Component | What It Does | Why It Matters |
|---|---|---|
| Test Scripting | Defines realistic scenarios and user interactions | Ensures tests reflect actual usage and catch real-world issues |
| Automation | Runs tests automatically within CI/CD workflows | Saves time, reduces manual effort, and delivers continuous feedback |
| Baselining | Establishes reference performance metrics | Helps detect regressions and measure improvements over time |
| Monitoring | Tracks system behavior during and after tests | Identifies bottlenecks, resource issues, and long-term trends |
| Collaboration & Reporting | Shares results and insights across teams | Promotes accountability and faster resolution of performance problems |
These components are essential to making performance testing DevOps a reliable, actionable practice. By weaving scripting, automation, baselining, monitoring, and collaborative reporting into the fabric of your pipeline, you set the stage for rapid delivery and high-quality user experiences.
Selecting the Right Tools for Performance Testing DevOps Integration
Choosing the right performance testing tools is critical for effective DevOps integration. As application release cycles compress, the need for automation, integration, and actionable insights grows. The best fit depends on how well a tool adapts to your CI/CD workflow, supports scripting, scales in the cloud, and delivers real-time reporting.
Criteria for Tool Selection
Focus on integration strength. The tool must connect with your existing DevOps ecosystem, whether that’s Jenkins, GitLab, or Azure DevOps. Scripting support is equally important – look for solutions that allow flexible test definitions in common languages or provide easy-to-use UI-based test creation. Cloud capabilities matter, too. Modern teams need tools that simulate thousands of users without the headache of local infrastructure. Finally, detailed reporting is non-negotiable – clear, automated results should flow directly to the people who need them.
Popular Tools and Platforms Compared
| Tool/Platform | Integration Strengths | Key Features |
|---|---|---|
| LoadFocus | Native cloud integration with major DevOps platforms, webhooks for CI/CD triggers | Real-time load testing, AI-powered analysis, API and website monitoring, automated performance baselining |
| Apache JMeter | Plugin support for Jenkins, GitLab, and Bamboo; scriptable via command line | Protocol flexibility (HTTP, SOAP, JDBC), open-source, customizable reporting |
| Gatling | CI/CD pipeline integration, Scala-based scripting, Docker-ready | High concurrency simulation, real-time metrics, scenario versioning |
| Cloud-native SaaS tools (e.g., BlazeMeter, k6 Cloud) | API-driven CI/CD integration, scalable infrastructure, built-in dashboards | On-demand test environments, collaborative dashboards, cloud scaling |
Each tool brings its own strengths. LoadFocus stands out for its AI-powered result analysis and deep cloud integration, making it ideal for teams prioritizing speed and ease of use. JMeter and Gatling are favored for protocol flexibility and open-source control. Cloud-native SaaS platforms offer unmatched scalability and quick onboarding for distributed teams.
Cloud vs. On-Premise Performance Testing
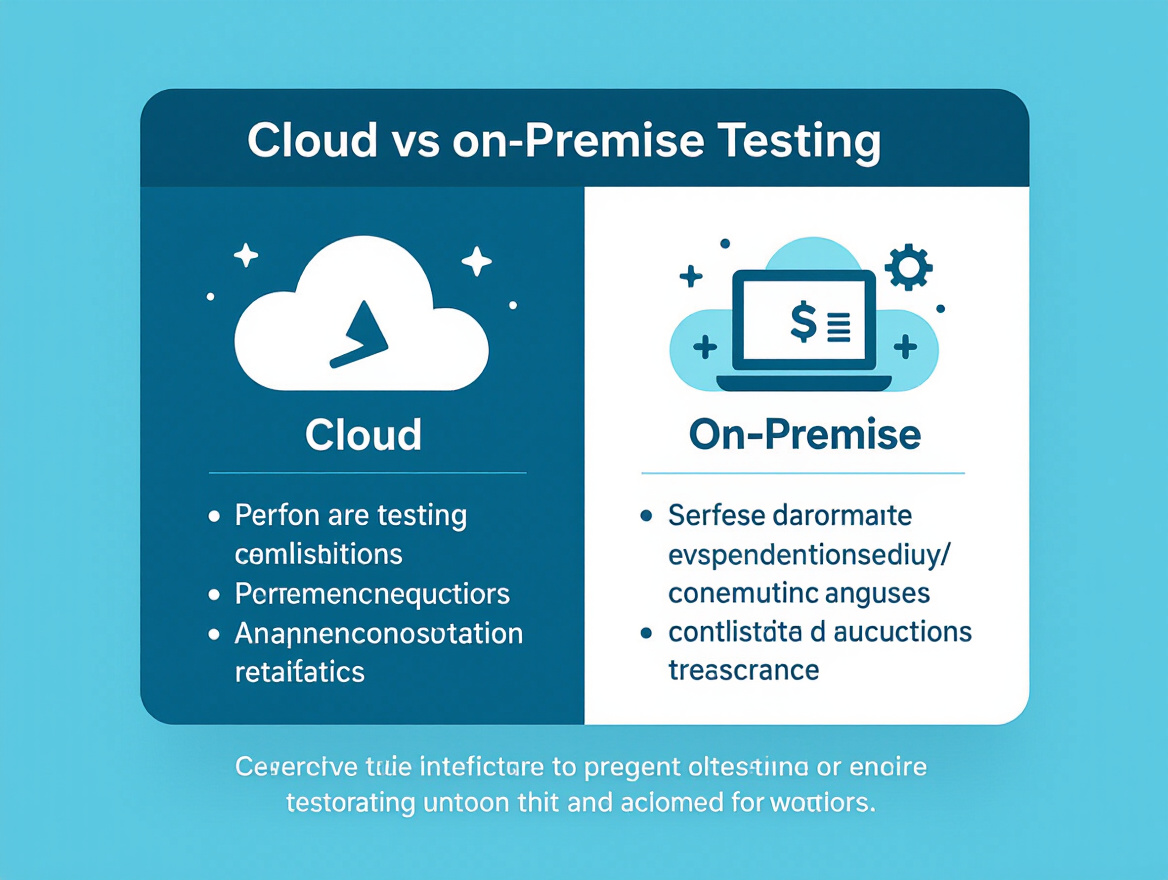
Teams must choose between cloud-based and on-premise performance testing solutions. Cloud platforms allow on-demand test infrastructure, simulating peak loads from multiple regions without upfront hardware investment. This flexibility aligns with elastic DevOps workflows, especially when releases are frequent and test requirements change rapidly. Cloud solutions also simplify integration, as most are designed to connect directly into popular CI/CD tools and provide instant reporting via web dashboards or APIs.
On-premise tools remain relevant where compliance, data sovereignty, or network constraints matter. Some organizations prefer the control and customization of running tests within their own infrastructure. However, on-premise approaches often require more setup, ongoing maintenance, and manual scaling when simulating large user volumes, which can slow down feedback loops.
Often, the best approach blends both. Cloud-native tools accelerate most workflows, while on-premise solutions fill gaps where special requirements exist. Choose based on your integration needs, scale expectations, and appetite for ongoing infrastructure management.
How to Embed Performance Testing into Your DevOps Pipeline
Bringing performance testing DevOps integration into your workflow requires deliberate orchestration across your CI/CD stages, smart automation, detailed test design, and ongoing tuning. Here’s how experienced teams make performance a native part of the DevOps process.
Mapping Performance Testing to Your DevOps Pipeline
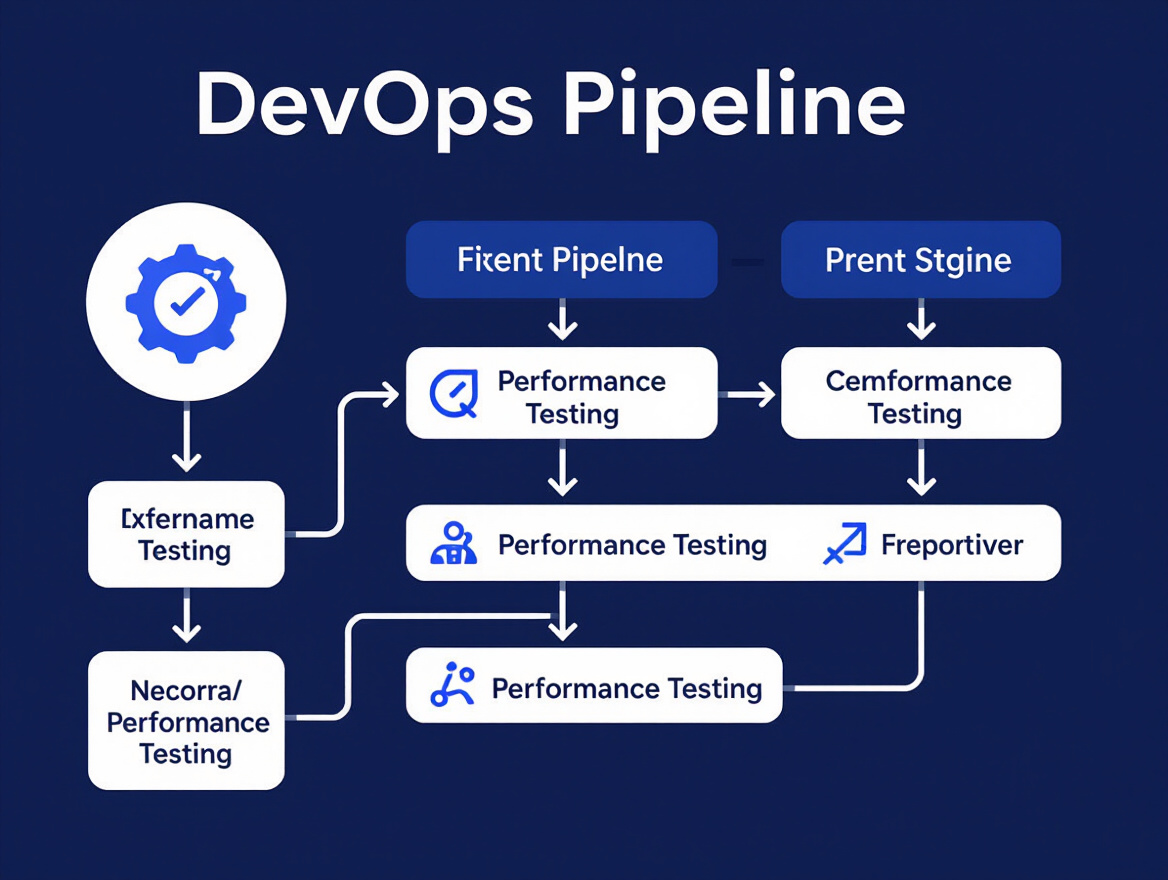
Performance testing isn’t just a box at the end of a release checklist. To gain meaningful insights, embed tests across multiple pipeline stages – from early unit and integration builds to pre-production system tests. The shift-left approach exposes bottlenecks and regressions when they are cheapest to fix. Teams that bake performance testing into their CI/CD see a significant drop in post-release performance defects.
- Unit stage: Lightweight performance checks for service methods or API endpoints.
- Integration stage: Simulate end-to-end workflows with typical data volumes.
- System/regression stage: Full-scale load and stress tests before major releases.
Each layer catches different types of issues. The earlier you start, the fewer costly surprises you’ll see later.
Establishing Performance Baselines
To spot regressions, define what “normal” looks like by creating performance baselines – reference points reflecting acceptable response times, throughput, or error rates under expected workloads. Cloud testing platforms like LoadFocus make it straightforward to capture these values in early runs, then use them as benchmarks for automated regression checks.
Here’s what this looks like in practice:
| Before | After |
|---|---|
| “Run a load test before each release and see if the numbers look OK.” | “Capture baseline response times and throughput for every API route after initial optimization. Store these as thresholds. Each new build’s test is automatically compared against these baselines, and the pipeline fails if any metric regresses beyond the acceptable limit.” |
The improved version is specific and measurable. Instead of relying on subjective judgment, teams use objective baselines to trigger alerts only when performance actually slips. This approach minimizes false positives and ensures that only meaningful regressions interrupt the workflow.
Revisit your baselines regularly as traffic patterns and infrastructure evolve. If you launch a new feature or migrate to new hardware, your “normal” may need to be redefined. Collaboration between developers, testers, and operations is essential – no single team should own baselining in isolation.
Triggering Tests Automatically
Manual performance testing doesn’t scale in a modern DevOps environment. The best teams automate test runs so they’re triggered by real development events – on every commit, merge, or on a nightly schedule. This approach delivers continuous feedback and catches regressions as soon as new code lands.
- Code commit triggers: Run critical performance tests on every push to main or develop branches.
- Merge triggers: Launch full suite tests when feature branches are integrated.
- Scheduled builds: Run extended load or soak tests overnight or during low-traffic windows.
Most popular CI/CD platforms support this level of automation. Jenkins, GitLab CI, and Azure DevOps all allow you to configure pipeline jobs that run performance test scripts as a native stage. With LoadFocus or similar cloud-based tools, you can pass parameters (like environment, test profile, or concurrency levels) directly from your pipeline configuration, making scripts reusable and easy to maintain.
| Before | After |
|---|---|
| “Run performance tests manually before releases.” | “Performance tests are triggered automatically on every merge to main. Results are published as pipeline artifacts, and failures prevent deployment until metrics return to baseline.” |
Automation ensures consistency, tightens feedback loops, and removes human error from the process. It also enforces accountability – developers can’t ignore a failing test because deployment is blocked until the issue is fixed or the threshold is adjusted with team approval.
Integrating with CI/CD Platforms and Ensuring Maintainability
Choosing the right tooling for performance testing DevOps integration is crucial. Prioritize platforms that offer detailed APIs, support scripting in your team’s preferred language, and provide clear reporting hooks. Cloud testing tools like LoadFocus are designed to fit well into Jenkins, GitLab, or Azure DevOps without complex setup.
Maintainability matters. Script your test scenarios so they can be parameterized – from target URLs to concurrency levels and test durations. Store these scripts in version control, and treat them as code, subject to code review and automated linting just like your app itself. This keeps your tests relevant as your system evolves and avoids the drift that plagues teams who treat performance testing as a one-off project.
Embedding performance testing into your DevOps pipeline is a cultural shift that rewards speed, reliability, and measurable quality. The results – faster releases, fewer fire drills, and more satisfied users – are well worth the investment.
Optimizing Automation: Scripting, Reporting, and Thresholds
Performance testing DevOps integration is only as effective as the automation behind it. Teams that rely on manual steps slow down and struggle to keep up with modern deployment cycles. To truly benefit, you need maintainable scripts, actionable reporting, and thresholds that reduce noise rather than create alert fatigue.
Best Practices for Maintainable, Reusable Test Scripts
Script your performance tests with modularity and reuse in mind. Instead of monolithic scripts tied to specific endpoints or data, develop parameterized scenarios. Group common setup and teardown logic, and use version control to track adjustments over time.
LoadFocus and similar platforms support scripting languages that plug into CI/CD pipelines. Align test scripts with pipeline stages to ensure tests run automatically during code commits and merges. Teams that script tests this way catch performance regressions early – well before they reach production. Regularly review and refactor to match evolving app behavior and infrastructure.
Automating Reporting for Rapid Feedback
Actionable reports are essential for continuous feedback. Instead of emailing static PDFs, integrate automated reporting that feeds results directly into your team’s issue tracker or chat channels. Cloud-based testing tools like LoadFocus generate real-time dashboards and use analytics to highlight anomalies, bottlenecks, and regressions.
Move from “here are all the numbers” to “here’s what changed and why it matters.” Automation enables teams to spot trends, compare results against baselines, and share findings instantly – speeding up root cause analysis and reducing time to resolution.
Setting Meaningful Thresholds and Alerting Criteria
Well-defined thresholds are your defense against false positives and alert overload. Avoid setting arbitrary targets that don’t reflect your users’ experience or business priorities. Baseline performance by capturing response times, throughput, and error rates under typical loads, and establish thresholds that account for expected variability.
For example, if your average API response time is 200ms under normal load, set your alert threshold at 300ms, not 250ms, to avoid noise from harmless fluctuations. Use trend analysis to adjust over time, especially as traffic patterns or app features change. The best teams iterate on thresholds as they learn from real incidents and feedback loops.
Before/After: Manual vs. Automated Performance Testing
| Before (Manual) | After (Automated) |
|---|---|
|
|
The automated approach wins on speed, dependability, and relevance. With manual testing, feedback is slow and inconsistent, so issues slip through. Automated workflows provide instant, actionable data – reducing post-release defects and keeping releases on schedule.
Optimizing your automation isn’t just about running more tests. It’s about building scripts you can trust, surfacing only the most important signals, and ensuring your team can act on findings – without getting buried in noise. That’s what turns performance testing DevOps from a box-checking exercise into a genuine driver of quality and velocity.
Leveraging Cloud Environments and Containerization
Cloud-Based Load Generation: Scaling Real-World Testing
Cloud infrastructure has changed performance testing for DevOps teams. Instead of scrambling to provision physical servers or relying on small-scale local tests, you can now spin up distributed load generators across multiple regions in minutes. This makes simulating realistic user traffic – including sudden spikes during product launches or peak hours – practical even for smaller teams. LoadFocus, for example, enables teams to run tests that mimic thousands of concurrent users accessing APIs and websites, helping to uncover issues that only appear under heavy load.
The upside: you avoid over-investing in hardware that sits idle most of the time, and you always have access to the scale you need, when you need it. Plus, cloud-based testing tools often integrate directly with DevOps platforms like Jenkins and GitLab, so tests can be triggered automatically on each build or pull request.
Containers: Isolated, Repeatable Test Environments
Containerization brings consistency to performance testing. By packaging your test applications, dependencies, and configuration into containers, you eliminate the classic “works on my machine” problem. Every test environment is isolated and repeatable, whether running locally or across a distributed cloud cluster. This matters for DevOps because it lets you shift performance testing left – embedding it earlier in CI/CD pipelines, right alongside unit and integration tests.
With containers, teams can launch identical test environments for each code commit or feature branch. If a performance regression appears, you know it’s the code, not a quirk of the test setup.
Scaling with Confidence
The combination of cloud and containers means you can quickly scale tests up or down to match any scenario. Need to simulate peak traffic? Spin up extra load generators in the cloud, each running in its own container, and point them at your staging environment. Automated performance testing integrated into DevOps pipelines leads to a 30% reduction in post-release defects and up to 40% faster testing cycles. This is about confidently releasing features that handle real-world demand, without guesswork.
Resource-intensive tests can inflate cloud costs if left unchecked, and misconfigured environments can yield noisy results. Careful planning and regular review of your test setup are essential to keep feedback fast and actionable.
Cloud environments and containers have set a new standard for what’s possible in performance testing DevOps practices, allowing teams to simulate, measure, and optimize for real user experience at any scale.
Monitoring, Trend Analysis, and Performance Regression Detection
Why Continuous Monitoring Matters in Performance Testing DevOps
Integrating performance testing into DevOps isn’t just about running tests during CI/CD. The real value comes from establishing continuous monitoring and proactive analysis. This approach helps teams understand how their application behaves under changing conditions and codebases, rather than waiting until the final release for surprises.
Continuous monitoring in a DevOps workflow means tracking key metrics – latency, error rates, throughput – across every build and deployment. Teams that do this spot small issues before they balloon into outages or user complaints. Organizations that made performance monitoring part of their pipeline saw a 30% reduction in post-release performance-related defects.
Reference Table: Key Metrics for DevOps Performance Testing
| Metric | What to Track | Why It Matters |
|---|---|---|
| Latency | Average, p95, and p99 response times for web and API endpoints | High latency directly impacts user satisfaction and signals backend inefficiencies or bottlenecks. |
| Error Rate | Percentage of failed requests (HTTP 5xx, 4xx, timeouts) across services | Spikes can indicate instability, regression, or configuration problems introduced during deployment. |
| Throughput | Requests per second/minute handled by services under varying loads | Reveals how well the system scales and highlights limits before users hit them. |
| Resource Utilization | CPU, memory, and disk usage during load testing scenarios | Prevents resource exhaustion and helps right-size infrastructure for cost and reliability. |
| Test Duration Trends | How long performance tests take over time with code changes | Increases may reveal hidden performance regressions or growing technical debt. |
Trend Analysis: Detecting Performance Drift Early
Spotting regressions before they become incidents requires more than pass/fail reports. Trend analysis lets you visualize how metrics like latency and throughput change over time – across builds, environments, and releases. For example, a gradual increase in p95 latency after each sprint might not trigger an alert immediately, but it signals a creeping degradation that needs attention.
This is where performance baselining comes in. By establishing a baseline for key metrics, teams can flag meaningful deviations and avoid overreacting to noise. Automated tools and dashboards make it much easier to compare current results with historical data and identify the first signs of performance drift.
Integrated Monitoring, Alerting, and Rapid Response
The best DevOps teams don’t just watch dashboards – they connect their monitoring tools directly to alerting systems. When error rates spike or latency exceeds baseline thresholds, alerts trigger in real time. This enables rapid response, so teams can roll back changes or patch issues before users are affected.
Cloud-based platforms like LoadFocus simplify this integration. They offer real-time insights and support popular pipeline tools, so performance tests can run automatically on every build. When paired with analytics, these tools highlight which regressions are signal, not noise, and help teams prioritize fixes.
Performance monitoring and alerting can generate false positives if thresholds are too tight, leading to alert fatigue. Resource usage of tests themselves can slow down CI/CD if not scoped properly. The key is to calibrate thresholds, review alerting logic periodically, and balance coverage with efficiency.
Embedding thorough monitoring, trend analysis, and regression detection into performance testing DevOps workflows helps maintain both speed and reliability. As applications and delivery cycles grow more complex, this discipline is what separates teams that keep up with change from those that fall behind.
Collaboration: Developers, Testers, and Operations Working Together
Shifting Roles and Responsibilities
Integrating performance testing into DevOps changes team dynamics. Developers are responsible for including basic performance checks in their workflows and treating performance regressions as seriously as functional bugs. Testers move from running isolated test cycles to building and maintaining automated test suites within CI/CD pipelines, focusing on scripting, baselining, and trend analysis. Operations teams play a key role in provisioning realistic test environments, analyzing infrastructure bottlenecks, and validating results against production-like loads.
Performance is no longer “someone else’s problem.” Everyone – from engineering to ops – shares accountability. This shift breaks down traditional silos and demands clear communication and agreed-upon ownership. When a new API feature causes a latency spike, developers and testers must trace the issue together, while operations ensures the environment mirrors production as closely as possible.
Best Practices for Sharing and Acting on Test Results
The best-performing teams don’t just automate tests – they build processes to share results in real time and act quickly on findings. Teams integrating performance testing into DevOps pipelines see a 30% reduction in post-release performance defects. This improvement comes from:
- Automating performance tests to run on every code commit or merge, not just before release.
- Using clear, actionable reporting – avoiding data dumps. Tag regressions clearly and link them back to code changes.
- Discussing results openly in daily standups or review meetings so that everyone understands current bottlenecks.
- Using trend monitoring and baselining to spot issues early, not just after failures.
Cloud testing platforms like LoadFocus make this easier by providing real-time dashboards and insights directly within common DevOps toolchains.
Building a Culture of Accountability and Quality
Sustained success with performance testing DevOps integration comes from a culture that values accountability and continuous improvement. Teams should treat performance as a shared goal and celebrate not just releases, but also incremental improvements – like shaving a second off API response time or catching a bottleneck before it hits production.
Challenges remain. Resource constraints, noisy alerts, or unclear ownership can derail even the best intentions. Addressing these up front – by tuning alert thresholds, clarifying responsibilities, and simplifying test environments – helps teams stay focused. Ultimately, organizations thrive when developers, testers, and operations see themselves as stewards of both speed and reliability.
Limitations, Trade-Offs, and What to Avoid
Integrating performance testing DevOps workflows delivers real value, but it’s not without challenges. Teams often discover that adding performance tests to CI/CD is about much more than just bolting on a tool. Below are some of the most common limitations, trade-offs, and mistakes to watch for – plus advice for sidestepping them.
Resource Intensity and Pipeline Slowdowns
Performance tests can be resource-hungry. Running them with every build, especially during peak working hours, can slow pipelines. This is particularly true if tests simulate large-scale load or run full-system scenarios. Teams frequently underestimate how much time and compute some tests require. If your performance suite is too heavy, developers may start skipping or postponing runs, defeating the purpose of continuous testing.
To mitigate this, prioritize test selection and scheduling. Run light, targeted tests on every commit, and reserve full-scale load or stress tests for scheduled nightly or pre-release pipelines. Use cloud-based solutions to offload compute and avoid overloading local infrastructure. Set clear expectations with the team about which tests are mandatory for every build and which are periodic.
Risk of Irrelevant or Excessive Alerts
Another frequent pain point is alert fatigue. When thresholds are poorly calibrated, teams end up with a flood of false positives or, worse, miss genuinely significant regressions. This can erode trust in the test suite and lead to complacency. Automated performance testing – while essential – needs careful tuning to avoid becoming background noise.
The solution is to baseline performance early and refine alert thresholds over time. Include only the most meaningful metrics in your “fail the build” logic. Periodically review failed runs to adjust sensitivity and reduce noise. Collaborate across development, QA, and operations to interpret results and set realistic expectations for what constitutes a real performance issue.
Complexity of Toolchain Integration for Smaller Teams
While cloud testing platforms and modern DevOps tools make integration easier, the initial setup can still feel daunting – especially for smaller teams. Connecting performance testing tools with CI/CD, managing test data, and scripting realistic scenarios all require expertise and time. If you’re working with limited resources, the learning curve can be steep and the temptation to cut corners is real.
Start with incremental adoption. Focus first on automating a few critical user journeys. Lean on tools with pre-built integrations for platforms your team already uses. Document your setup and share knowledge internally to avoid key-person risk. Over time, expand coverage as the team matures and confidence grows.
Common Mistakes to Avoid
- Running all tests on every commit. This can slow pipelines. Instead, tier your tests based on impact and frequency.
- Setting arbitrary thresholds. Use historical data to inform what’s achievable, rather than enforcing unrealistic response times.
- Neglecting test maintenance. As systems evolve, old performance tests may become obsolete or misleading. Regularly review and update scenarios to reflect production reality.
- Ignoring cross-team collaboration. Siloed ownership leads to blind spots. Bring developers, testers, and ops together to interpret results and prioritize fixes.
- Choosing tools that don’t fit your workflow. Don’t force complex integrations if a simpler cloud testing tool meets your needs. The goal is sustainable improvement, not maximal complexity.
Integrating performance testing into DevOps is essential for reliability and speed, but only pays off when challenges are anticipated and addressed head-on. Prioritize efficiency, tune alerting carefully, and keep your toolchain as simple as possible for your team’s current stage. The investment will return dividends as your product – and your team – scales.
Future Trends: AI and the Next Generation of Performance Testing in DevOps
AI Makes Results Smarter – Not Just Faster
AI-driven analytics are pushing performance testing DevOps to a new level of speed and intelligence. Instead of teams manually sifting through logs to spot slow queries or memory leaks, modern tools now analyze results in real time and highlight anomalies that deserve attention. AI models can surface patterns – like a subtle rise in API latency under certain payloads – that a human reviewer might miss until it causes a production incident. This means faster triage and fewer post-release surprises.
Predictive Tuning Before Problems Emerge
The latest shift is predictive analytics. Rather than just reporting that a build fails a load test, some platforms use historical performance data to forecast bottlenecks before they ever occur in production. For example, a test might flag a trend: “If the current growth in user traffic continues, this endpoint’s response time will breach your SLA next quarter.” That heads-up lets teams tune infrastructure or optimize code while there’s still time.
Self-Healing and Automated Pipelines
Automation is now the default, but the next step is self-healing pipelines. In a mature setup, failed performance checks can automatically trigger rollback workflows or open prioritized tickets. Some tools even suggest configuration tweaks or scaling policies based on test results. With 70% of DevOps adopters integrating automated performance testing into their CI/CD pipelines, the expectation is for continuous feedback and proactive fixes, not reactive firefighting.
Cloud platforms like LoadFocus are at the center of this evolution, offering easy integration and scalable testing environments. Even as AI and automation reduce manual toil, teams still need to define meaningful thresholds and maintain a healthy skepticism about false positives. The future is less about replacing humans, more about equipping them with earlier, sharper insights for high-quality, high-performing releases.
Frequently Asked Questions
How does performance testing fit into a DevOps workflow?
Performance testing DevOps integration means that testing isn’t a one-off event at the end of development. Instead, automated performance tests are run continuously – often triggered by every code commit or build within the CI/CD pipeline. This approach helps teams catch performance regressions immediately, rather than after software is released. For example, many organizations now configure their pipelines to automatically run load and stress tests using cloud-based tools like LoadFocus after each merge, ensuring new code hasn’t slowed down response times.
What are the main benefits of integrating performance testing into CI/CD pipelines?
Teams that integrate performance testing into their CI/CD process report a 30% reduction in post-release performance defects by catching issues earlier. Automating these tests also speeds up release cycles by up to 40%, since there’s less need for last-minute firefighting. In practice, this means fewer user complaints about slowdowns, and less time spent patching issues after launch.
What tools are best for performance testing in DevOps environments?
The most effective tools offer cloud scalability, integrate smoothly with popular DevOps platforms (such as Jenkins, GitLab, or Azure DevOps), and provide real-time dashboards and automated reporting. For example, LoadFocus allows teams to simulate large-scale traffic directly from the cloud, analyze response times, and receive recommendations for bottlenecks. Selecting a tool that supports scripting, API testing, and customizable thresholds is critical for automating and tailoring tests to your workflow.
Doesn’t adding performance testing slow down the pipeline?
Performance tests can be resource-intensive – especially under heavy loads or with complex scenarios. To avoid pipeline bottlenecks, experienced teams often run a blend of lightweight “smoke” performance tests on every commit, and schedule heavier, more thorough load tests at set intervals or before major releases. Setting clear test thresholds and using cloud resources dynamically helps balance speed with thoroughness.
What are the biggest mistakes teams make with performance testing in DevOps?
- Relying on manual testing, which is too slow for rapid DevOps cycles.
- Failing to set realistic performance baselines, making it hard to spot true regressions.
- Over-alerting or using poorly defined thresholds, leading to “alert fatigue” and ignored warnings.
- Neglecting collaboration – developers, testers, and ops need to review results together to prioritize fixes.
How do cloud environments and containerization help?
Cloud-based performance testing platforms let you simulate real-world traffic patterns and scale tests up or down as needed. This flexibility is especially useful for teams working with microservices or containerized apps, where you need to test many combinations of services and endpoints quickly. Using containers also makes it easier to replicate production-like test environments on demand.
Integrating performance testing into DevOps is now a necessity for maintaining quality and user satisfaction as organizations push for faster and more reliable releases.
Composed with PostNext app