JMeter load testing comes down to five steps: install Apache JMeter on a machine that is not the server you are testing, build a test plan with a Thread Group and HTTP Request samplers, check it with one user, run it in CLI mode with jmeter -n -t plan.jmx -l results.jtl -e -o report, and read the HTML report. When one machine cannot produce the load you need, run the same .jmx distributed or in the cloud.
Key takeaways
- Build the plan in the GUI, run the load from the command line. JMeter’s own manual says not to load test in GUI mode.
- Check every request with one user and a View Results Tree before adding threads, and add an assertion so error pages are not counted as successes.
- Raise the load in steps and read percentiles, throughput and error % at each step; the average alone hides the slow tail.
- One machine runs out of heap, CPU or network long before a real web server does. Distributed mode or a cloud service takes the same .jmx further.
The JMeter load testing workflow at a glance
| Stage | What you do | JMeter piece | Runs where |
|---|---|---|---|
| 1. Install | Java 8 or later, then unzip JMeter 5.6.3 | bin/jmeter | Your machine |
| 2. Build | Thread Group, HTTP requests, cookies, headers, timers, assertions | Test plan (.jmx) | GUI |
| 3. Check | One thread, one loop, inspect every response | View Results Tree | GUI |
| 4. Run | Fixed load for a set time, results written to a file | jmeter -n -t -l -e -o | CLI, separate machine |
| 5. Read | Throughput, p90/p95/p99, error %, active threads | HTML dashboard | Browser |
| 6. Scale | Same .jmx on several generators or regions | Remote mode, or a cloud service | Several machines |
The rest of this tutorial walks through each row, with the commands and the settings that matter.
What do you need before you start a JMeter load test?
You need Java 8 or later, the Apache JMeter binaries, a machine that is not the server under test, and permission to load the target. JMeter itself is free and open source under the Apache License. The generator machine matters: if JMeter shares CPU and memory with the application, you measure the two of them fighting for resources rather than the server’s capacity.
Before the first run, write down three numbers: the number of users you expect at peak, how long a typical session lasts, and the response time you consider acceptable. Without them you will finish the test with a pile of charts and no way to say whether the result was good. If you are unsure how to turn analytics into a user count, the JMeter ramp-up period guide covers pacing and arrival rates.
Test against a staging copy where you can. If production is the only realistic target, agree a time window with whoever runs it and tell your hosting or CDN provider, because a sudden burst from a few IP addresses can look like an attack and get blocked.
How to install Apache JMeter
Install Java first, then download the JMeter binary archive from jmeter.apache.org and unzip it. At the time of writing the current release is 5.6.3, and the project states that JMeter is compatible with Java 8 or higher. There is no installer: the bin folder holds the start scripts.
- Check Java with
java -version. Install a current LTS JDK or JRE if the command is missing. - Download
apache-jmeter-5.6.3.zip(or.tgz) from the Binaries section of the download page. - Unzip it anywhere, for example
~/tools/apache-jmeter-5.6.3. - Start the GUI with
bin/jmeteron macOS and Linux, orbin\jmeter.baton Windows.
On a Mac you can also use Homebrew; the JMeter on Mac guide covers both routes and where Homebrew puts the configuration files.
JMeter starts with a 1 GB Java heap by default. That is enough to build and debug a plan, and often too little for a large run. You set a bigger heap through HEAP in bin/setenv.sh (or setenv.bat), for example HEAP="-Xms1g -Xmx4g", keeping it below the machine’s physical memory. More detail in how to increase JMeter’s heap size.
How to build a JMeter test plan for a web server
A test plan for a website needs a Thread Group (the users), HTTP Request samplers (the pages or API calls), an HTTP Cookie Manager, usually an HTTP Header Manager, a timer for think time, and at least one assertion. Every element is added by right-clicking its parent and choosing Add, then the element type.
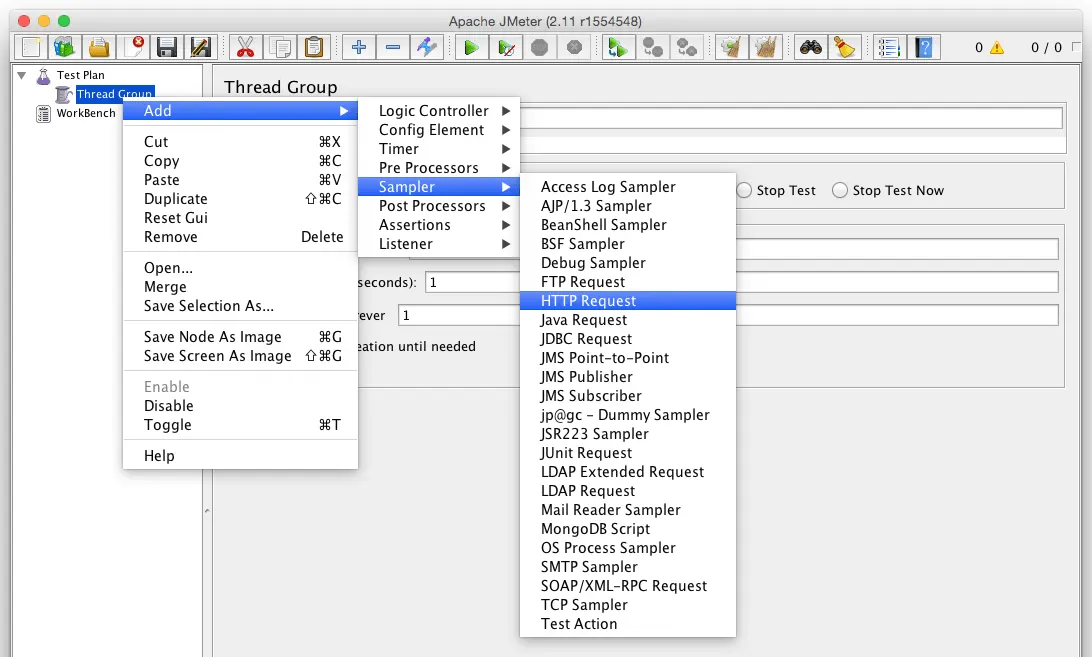
The screenshots below come from the first version of this tutorial, made with JMeter 2.11. The right-click Add menus work the same way in 5.6.
Step 1: Add a Thread Group
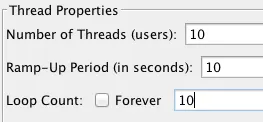
Right-click Test Plan > Add > Threads (Users) > Thread Group. The three fields that shape the load are:
- Number of Threads (users): how many virtual users run at once.
- Ramp-up period (seconds): how long JMeter takes to start all of them. 10 threads with a 10-second ramp-up start one per second.
- Loop Count: how many times each user runs the samplers. For a load test, tick Specify thread lifetime and set a Duration instead, so the test runs for a fixed time.
Step 2: Set HTTP Request Defaults
Add Config Element > HTTP Request Defaults under the Thread Group and fill in the protocol, server name and port once. Every HTTP Request sampler then only needs a path, and moving the test from staging to production is a one-field change. Parameterize the server name with ${__P(host,staging.example.com)} and you can pass it on the command line with -Jhost=www.example.com.
Step 3: Add the HTTP Request samplers
Right-click the Thread Group, then Add > Sampler > HTTP Request, one sampler per page or API call in the user journey: home page, search, product page, add to cart. Give each a clear name, because that name becomes the row label in every report.
Writing a long journey by hand is slow. You can record it with JMeter’s HTTP(S) Test Script Recorder, or with a browser extension that saves the recording as a .jmx; recording JMeter tests with a Chrome extension shows the second route.
Step 4: Add cookies, headers and test data
- HTTP Cookie Manager (Config Element): keeps session cookies per user, so a logged-in journey stays logged in.
- HTTP Header Manager: sends headers such as
Accept,User-Agentor anAuthorizationtoken with every request. - CSV Data Set Config: gives each user a different username, search term or product id from a file, so you do not hit one cached page a thousand times. See using a CSV Data Set in JMeter tests.
Step 5: Add think time and an assertion
Real users pause between pages. Add a Timer > Uniform Random Timer (for example 2,000 ms constant plus up to 3,000 ms random) so each virtual user behaves like one person, not a tight loop.
Then add Assertions > Response Assertion to each important sampler and check for text that only appears on a good page, such as the product title. Without it, a server that answers every request with a fast “Service unavailable” page and a 200 status looks perfectly healthy in the results. How to use assertions in JMeter covers the options.
How to check the test with one user first
Set the Thread Group to 1 thread and 1 loop, add Listener > View Results Tree, and press the green Start button. Open every sampler in the tree: the status code, the response body and the assertion result should all be what a real browser would get. Fix redirects that land on a login page, missing tokens and wrong hosts now, while one user makes them easy to see.
This is the only time to use View Results Tree. JMeter’s best-practices page says not to use View Results Tree or View Results in Table during the load test, because they hold every response in memory. Disable them (right-click, Disable) before the real run and save the plan as a .jmx file.
How to run a JMeter load test from the command line
Run the real load in CLI mode, which JMeter’s manual calls the mode “you must” use for load testing. The command below runs the plan, writes every sample to a JTL file and builds the HTML dashboard at the end:
jmeter -n -t checkout.jmx -l results.jtl -e -o report/-nruns JMeter without the GUI.-tis the test plan.-lis the results file (CSV by default, which is smaller and faster to write than XML).-e -o report/generates the HTML report intoreport/, which must not exist or must be empty.-Jname=valueoverrides a property, for example-Jhost=www.example.com -Jthreads=200if the plan reads${__P(threads,10)}.
Run it from a machine close to where your users are, and not from the application server. While it runs, watch the server’s CPU, memory, database connections and error logs; JMeter shows you the symptoms and the server shows you the cause. Running JMeter in non-GUI mode has more command-line options. If you already have a results file and only need the report, jmeter -g results.jtl -o report/ builds it.
How to read JMeter load test results
Open report/index.html. Four numbers decide whether the test passed: throughput, response-time percentiles, error percentage and active threads. Read them together and at each load step, because each one on its own can mislead.
| Metric | Where in the report | What it tells you |
|---|---|---|
| Throughput (requests/s) | Statistics table, Throughput column | How much work the server completed. If you add users and it stops rising, you found the ceiling. |
| p90 / p95 / p99 response time | Statistics table, the three percentile columns (90, 95 and 99 by default) | What the slowest users see. Compare these with the target you wrote down. |
| Error % | Statistics and Errors tables | Failed samples, including failed assertions. A rising error rate is the clearest sign of overload. |
| Active threads | Charts > Over Time | How many users were running at each moment, so you can match slowdowns to load. |
The original 2016 run of this tutorial shows why the average is not enough. With 10 threads and 10 loops (100 samples) against our test server, the average sample time was 133 ms. At 300 threads and 3,000 samples the average rose to 178 ms, which looks like a modest 34% increase, but the standard deviation was 247 ms, larger than the average itself. A spread that wide means a long tail of slow requests that the average hides, and the p95 and p99 columns are where that tail shows.

How to increase the load step by step
Raise the load in steps and hold each step long enough to settle, for example 50, 100, 200 and 400 users for 5 to 10 minutes each. At each step note throughput, p95 and error %. The step where throughput flattens while response times climb is your capacity; the step where errors appear is past it.
A single Thread Group with a long ramp-up is the simplest version. For true steps, use several Thread Groups with delayed starts, or a plugin thread group such as the Concurrency Thread Group from the JMeter Plugins project (see installing plugins with the Plugins Manager).
Watch the load generator too. If its CPU sits near 100% or its network link is full, the slowdown you see may be JMeter’s, not the server’s. How many threads one machine can run depends on the plan, the response sizes and the hardware; how many threads JMeter can run from one machine explains how to find your own limit.
When one machine is not enough: distributed JMeter
JMeter’s remote mode lets one controller start the same test plan on several JMeter servers and collect their results. Each server runs the full plan: the manual’s example is that 1,000 threads on 6 servers injects 6,000 threads, so divide the thread count by the number of servers yourself.
The setup, from the JMeter remote testing guide:
- Every machine runs exactly the same JMeter version and, ideally, the same Java version.
- Every machine has the RMI SSL keystore (
rmi_keystore.jks, created withbin/create-rmi-keystore.sh), or SSL is switched off withserver.rmi.ssl.disable=trueon a private network. - Data files such as CSVs are not sent by the controller; copy them to the same path on each server.
- Start
bin/jmeter-serveron each load generator, open the RMI ports in the firewall (fix the dynamic one withserver.rmi.localport), and run the controller with the servers listed:
jmeter -n -t checkout.jmx -R 10.0.1.11,10.0.1.12,10.0.1.13 -l results.jtl -e -o report/This works well on a private network you control. In the cloud, it means provisioning the instances, keeping JMeter and every plugin identical on each one, handling keystores and security groups, and shutting everything down afterwards. Running a distributed JMeter test in the cloud goes through that setup on cloud instances.
Running the same JMX in the cloud without managing servers
The other route is a service that takes your .jmx and runs the generators for you. The options differ in how much setup they leave to you:
- Self-hosted distributed JMeter: free software, full control of the network and the data; you provision, patch and synchronise the machines.
- Commercial JMeter clouds such as BlazeMeter or Azure Load Testing (Microsoft documents uploading a JMeter script to it): you upload the .jmx and work within the service’s plans and limits.
- LoadFocus: you upload the .jmx unchanged and run it from 25 cloud regions.
On LoadFocus JMeter load testing you drop in the test plan with its CSV files, then set virtual users, duration and ramp-up in the browser for each run without editing the script. Thread groups, timers, assertions and JSR223 samplers run as they do on your machine. LoadFocus starts the cloud machines, spreads the threads across them and shuts them down when the test ends, and the results break response times, throughput and errors down by region, so one slow location stands out.
The free plan runs tests with up to 10 virtual users for 60 seconds from any of the 25 regions, which is enough to confirm your .jmx works in the cloud. Paid plans scale from 250 to 20,000 virtual users per test. Before uploading, the free JMeter script validator checks a .jmx for errors.
Common JMeter load testing mistakes
- Running the load in GUI mode. The GUI uses memory and CPU that the test needs, and its listeners make it worse. Build in the GUI, run in CLI mode.
- No assertions. JMeter fails a sample on a 4xx or 5xx status, but an error or maintenance page served with a 200 status passes, and looks like a fast, healthy response.
- No think time. Users with no pauses send far more requests per user than real visitors, so the thread count no longer means anything.
- Every user sends the same data. Caches serve one product page a thousand times and the test measures the cache. Feed users from a CSV.
- Testing from the server itself, or from one office connection. The first measures resource contention, the second measures your uplink. Use separate generators, close to your users.
- Ramping straight to full load. You learn that the system broke but not at what load it started to degrade, which is the number you need.
Frequently Asked Questions
How do I do load testing using JMeter?
Install JMeter on a machine that is not the server under test, build a test plan with a Thread Group, HTTP Request samplers, a Cookie Manager, a timer and assertions, then check it with one user in the GUI. Run the real load in CLI mode with jmeter -n -t plan.jmx -l results.jtl -e -o report and read throughput, percentiles and error rate in the HTML report.
Is JMeter easy to learn?
The basics are quick to learn: a working test plan for a few pages takes an afternoon. The harder parts are correlation (extracting tokens from one response and sending them in the next), realistic test data and reading results under load. Recording a journey and then editing the recording is the fastest way to start.
Is JMeter free?
Yes. Apache JMeter is an open-source project of the Apache Software Foundation, released under the Apache License 2.0, with no per-user or per-test cost. You pay only for the machines it runs on, or for a service that runs it for you.
How many users can JMeter simulate from one machine?
It depends on the test plan, the response sizes and the hardware, so measure it: raise the thread count until the generator’s CPU, heap or network saturates. Beyond that, use JMeter’s distributed mode across several machines or a cloud service that runs the same .jmx on many generators.
Can I run the test on the server I am testing?
No. The load generator competes with the application for CPU and memory, and you end up measuring the two fighting each other rather than the server’s real capacity.
Should I use the GUI or the command line for the test?
Use the GUI to build and debug the plan with one user, and the command line (CLI mode) for every run with real load. The JMeter manual is explicit that load tests should not be run in GUI mode.
Sources
- Apache JMeter download page: current release 5.6.3, Java 8+ (jmeter.apache.org, October 2026).
- Getting Started, JMeter user manual: Java compatibility, default 1 GB heap, CLI options
-n -t -l -e -o -R(jmeter.apache.org, October 2026). - Remote Testing, JMeter user manual: same versions on every node, RMI over SSL, data files not sent, each server runs the full plan (jmeter.apache.org, October 2026).
- Best Practices, JMeter user manual: CLI mode, no View Results Tree during load tests, CSV output (jmeter.apache.org, October 2026).
- Generating Report Dashboard, JMeter user manual (jmeter.apache.org, October 2026).
- Building a Web Test Plan, JMeter user manual (jmeter.apache.org, October 2026).