Why API Performance Testing Fails – and Why Speed Matters
Many teams dedicate time and resources to API performance testing, yet still face sluggish releases and delayed deployments. Incidents slip through, and users encounter slow applications. The root cause? Too often, teams treat performance testing as a checkbox, without truly simulating real-world loads or analyzing key performance metrics such as latency, throughput, and error rates. This leads to a false sense of readiness that quickly unravels in production environments.
Common Bottlenecks in API Performance Testing
The most frequent issues fall into a few categories:
Is Your Infrastructure Ready for Global Traffic Spikes?
Unexpected load surges can disrupt your services. With LoadFocus’s cutting-edge Load Testing solutions, simulate real-world traffic from multiple global locations in a single test. Our advanced engine dynamically upscales and downscales virtual users in real time, delivering comprehensive reports that empower you to identify and resolve performance bottlenecks before they affect your users.
- Inadequate test coverage: Functional tests are prioritized, while stress and load scenarios are neglected. As a result, slowdowns or connection issues often emerge only after deployment.
- Manual, infrequent testing: Without continuous integration and automated load tests, performance regressions are often discovered late, under pressure from release deadlines.
- Unrealistic traffic simulation: Synthetic scenarios fail to capture unpredictable spikes and usage patterns that can overwhelm APIs in production.
- Insufficient metrics: Relying solely on average response times hides latency spikes. Overlooking error rates, resource utilization, and percentile response times means critical bottlenecks are missed.
The Business Risks of Slow, Ineffective Testing
Poor API performance testing impacts more than just engineering. Downtime or high latency can stall transactions, drive users to competitors, and risk service-level agreement (SLA) breaches. For SaaS providers, even brief periods of degraded API performance can result in lost revenue and reputational harm. A recent outage at a widely used API platform left hundreds of client applications stalled for hours due to untested load spikes, illustrating how overlooked bottlenecks can disrupt entire software ecosystems.
Even minor slowdowns can increase user churn. Users expect near-instant responses, and when an API lags, customer satisfaction drops. Engineering teams are then forced to focus on firefighting rather than delivering new features, fueling technical debt.
Key Insight: Incomplete API performance testing leads directly to unreliable releases, and the resulting business impact is far more costly than investing in optimization from the start.
From Pain Points to Practical Solutions
The good news is that API performance bottlenecks are not inevitable. Teams can significantly improve reliability and speed by integrating specialized cloud testing platforms like LoadFocus, practicing continuous testing in CI/CD pipelines, and monitoring metrics that matter: response times, error rates, and uptime. Selecting the right tools and strategies is important, but tailoring them to your team’s strengths and project needs is just as critical. With a focused approach, you can catch bottlenecks early and build APIs that perform under pressure.
Think your website can handle a traffic spike?
Fair enough, but why leave it to chance? Uncover your website’s true limits with LoadFocus’s cloud-based Load Testing for Web Apps, Websites, and APIs. Avoid the risk of costly downtimes and missed opportunities—find out before your users do!
Comparison Table: 10 Optimization Strategies for API Performance Testing
When you aim to optimize API performance testing, there is no single best strategy. Each approach comes with trade-offs in complexity, cost, and suitability for specific bottlenecks. The table below outlines 10 practical strategies that teams use, along with their strengths, limitations, best-fit scenarios, and resource requirements. Use this as a reference to align tactics with your team’s needs and priorities.
| Name | Key Strength | Key Limitation | Best For | Price/Resource Requirement |
|---|---|---|---|---|
| Continuous Integration (CI) Testing | Automates performance checks on every commit | Requires initial CI/CD pipeline setup | Preventing regressions in agile workflows | Medium – Needs CI system and test scripting |
| Realistic Load Simulation | Mimics real-world traffic spikes and patterns | Complex scenarios can be challenging to model | Validating scalability under peak conditions | Medium to High – Depends on tool capabilities |
| Comprehensive Monitoring & Metrics | Tracks latency, error rates, TTFB, and resource usage | Can produce overwhelming data if not filtered | Pinpointing bottlenecks during tests | Medium – Needs monitoring infrastructure |
| HTTP Caching Strategies | Reduces repeated API calls and improves response times | Stale data risk if cache invalidation is slow | Frequent requests and read-heavy APIs | Low – Configuration updates and CDN costs |
| Optimizing SQL Queries | Removes database bottlenecks, lowers latency | Requires in-depth schema and usage knowledge | Heavy data-driven APIs | Low – Code and query review time |
| API Payload Minimization | Reduces network and parsing overhead | May require refactoring and breaking changes | Mobile and bandwidth-constrained clients | Low to Medium – Development effort |
| Connection Pooling | Boosts backend throughput for concurrent requests | Misconfigured pools can exhaust resources | High-volume transactional APIs | Low – Configuration and monitoring |
| Percentile Response Time Analysis | Exposes outliers missed by average metrics | Requires larger sample sizes for accuracy | Business-critical SLAs and user experience | Low – Built into most modern testing tools |
| Dedicated API Testing Platforms (e.g., LoadFocus, JMeter) | Streamlines test creation, execution, and reporting | May not support every protocol or custom scenario | Teams needing scalable, all-in-one solutions | Medium to High – Platform subscription or licensing |
| Environment Parity (Prod-like Staging) | Improves accuracy of performance results | Duplicating production environments can be costly | Critical APIs where accuracy is essential | High – Infrastructure and maintenance costs |
Each team’s needs are unique, so there’s no universal playbook for how to optimize API performance testing. The most effective teams experiment, measure, and prioritize based on actual bottlenecks. This table helps focus your efforts for maximum impact, whether scaling for growth or keeping releases on track.
Leverage Cloud-Based Testing Platforms for Scalability and Speed
To optimize API performance testing for real-world demands, cloud-based tools like LoadFocus have transformed the process. Traditional approaches required managing lab hardware and static test environments, but cloud platforms now let teams launch distributed load tests in minutes, without hardware setup or IT negotiations.
With LoadFocus, for example, you can run performance tests across multiple geographic regions simultaneously. This is vital for APIs serving global applications. Instead of simulating users from a single location, you can replicate traffic spikes from Europe, Asia, and North America in one test run, providing a more realistic picture of latency, availability, and throughput under stress.
LoadFocus is an all-in-one Cloud Testing Platform for Websites and APIs for Load Testing, Apache JMeter Load Testing, Page Speed Monitoring and API Monitoring!
Another advantage is real-time monitoring. Cloud platforms offer dashboards to track metrics like response time, error rates, and system resource utilization as tests run. If latency spikes or error rates increase, you can halt the test, adjust the system, and re-run quickly. This feedback loop shortens the time between code changes and performance validation.
For teams practicing agile or DevOps, integrating with CI/CD workflows is essential. LoadFocus, for instance, enables automatic load tests with every deployment, providing automated performance gates. If a new build introduces slowdowns or error spikes, the CI pipeline detects it before production, offering a safety net against costly outages.
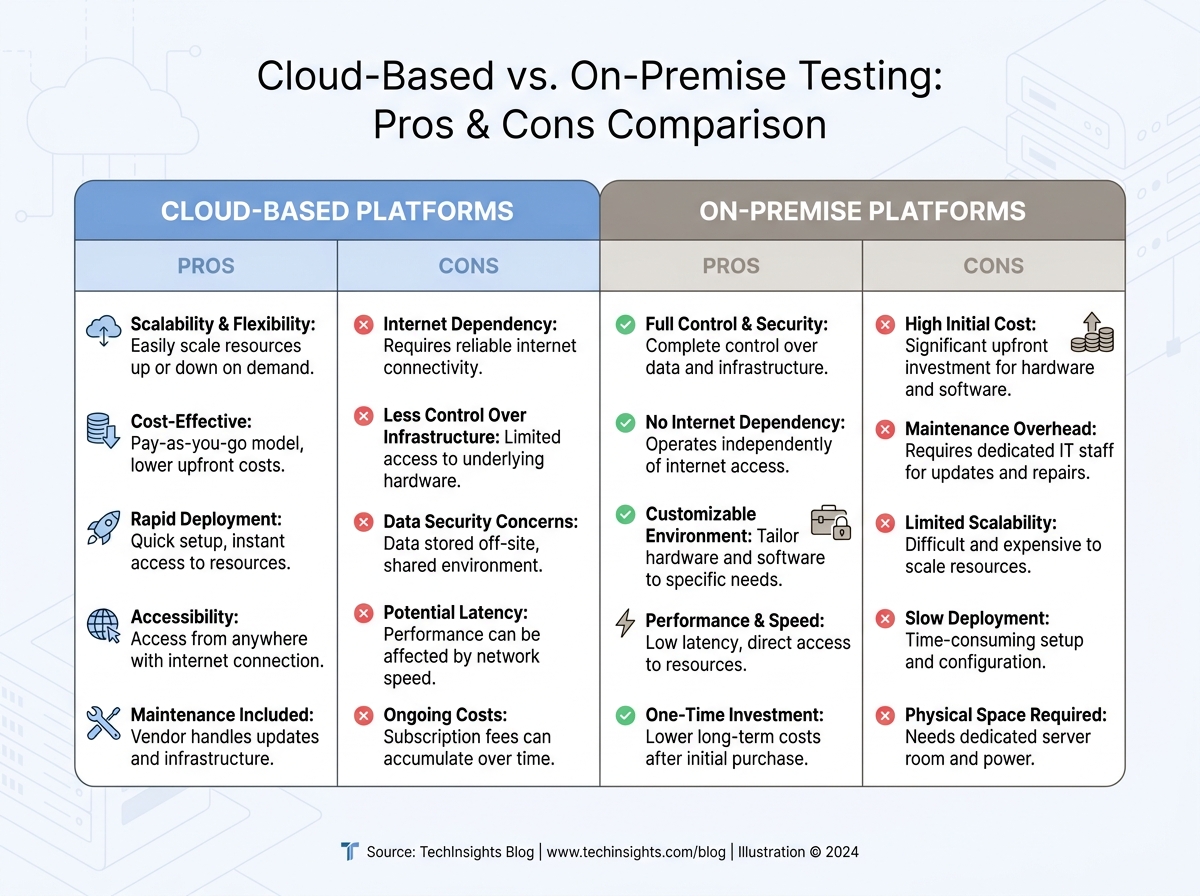
Cloud vs. On-Premise: Key Differences for API Testing
| Criteria | Cloud-Based Platforms | On-Premise Solutions |
|---|---|---|
| Setup Time | Provision test environments in minutes, no hardware required | Manual server setup, OS installs, network configuration – often hours or days |
| Scalability | Easily simulate thousands of users from multiple global locations | Limited by in-house hardware and local network |
| Cost Structure | Pay-as-you-go; scale tests to fit budget | High upfront investment in hardware and ongoing maintenance |
| Maintenance | Vendor manages updates, scaling, and failures | Internal teams handle software, OS patches, and hardware health |
| Integration with CI/CD | Native support for pipelines and auto-triggered tests | Often requires custom scripts and workarounds |
While on-premise testing is still relevant for strict data residency or privacy requirements, most organizations are moving to the cloud for speed and flexibility. The ability to simulate millions of API calls from multiple locations, combined with instant access to actionable insights, gives cloud-based platforms a clear advantage.
By optimizing API performance testing with cloud tools, your team can spot bottlenecks, validate fixes quickly, and deliver APIs that withstand real-world pressure. The impact? Fewer outages, faster releases, and more satisfied users – without the limitations of legacy infrastructure.
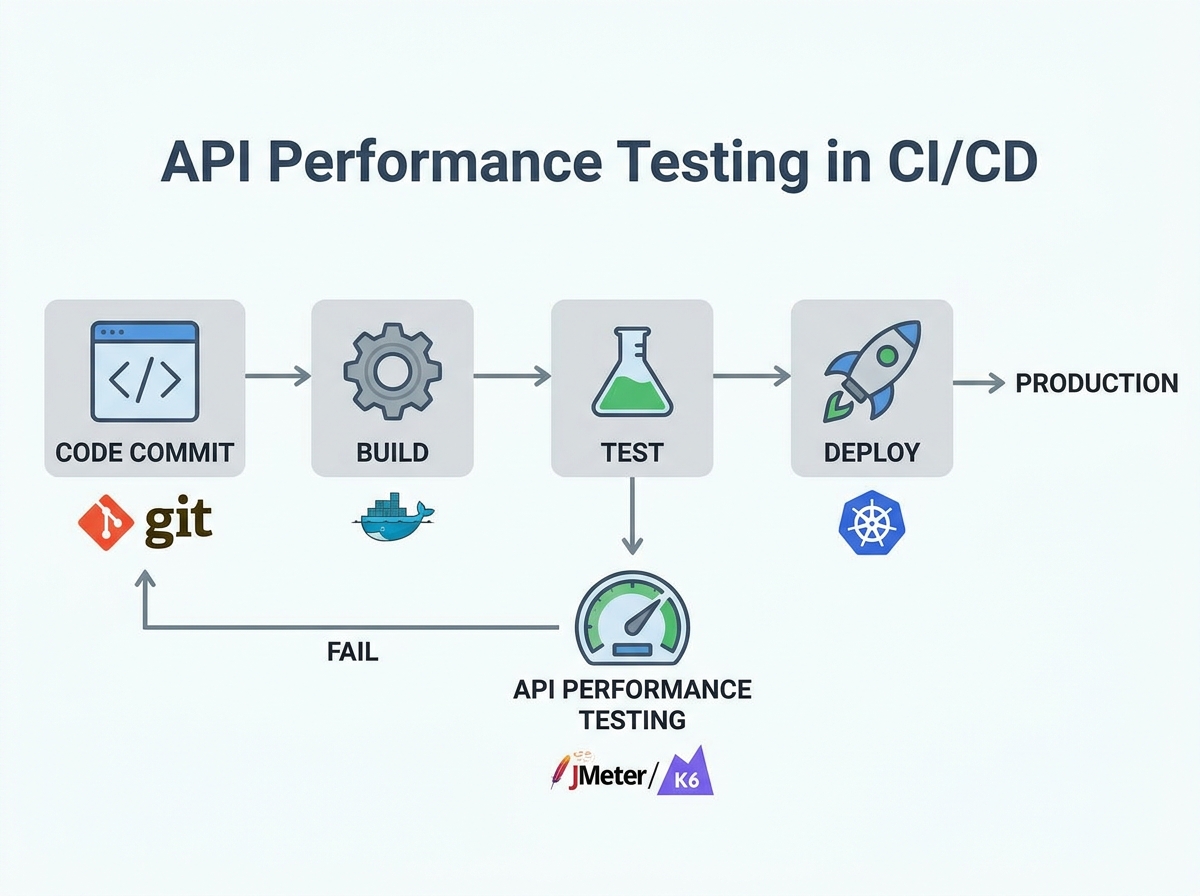
Automate API Performance Testing Within CI/CD Pipelines
Embedding API performance tests directly into CI/CD pipelines is now essential for teams aiming to ship reliable, scalable products quickly. Running performance checks with every build moves you beyond late-stage, manual benchmarking, establishing a workflow where feedback on bottlenecks is immediate. This approach not only catches regressions early, but also helps prevent slowdowns and outages after deployment.
Performance testing within CI/CD is about more than just sending traffic to endpoints. You need to monitor granular metrics – response times, error rates, throughput, and resource utilization – on every commit. With APIs supporting microservices, mobile apps, and cloud platforms, a single missed issue can cascade through systems and affect end users.
Key Insight: Continuous API performance testing in your CI/CD pipeline transforms performance validation into a routine habit, driving faster releases and better user experiences.
Best Practices for CI/CD-Integrated Performance Tests
To optimize API performance testing in your pipeline, define clear thresholds for key metrics. For example, fail builds if 95th percentile response time exceeds your SLA, or if error rates spike above a set percentage. Schedule lightweight smoke performance tests on every pull request, reserving full-scale load tests for nightly or weekly runs. This keeps your pipeline efficient without sacrificing coverage.
Structure tests to reflect realistic usage. Use tools that support parameterization and data-driven scenarios, such as JMeter or LoadFocus, to simulate production-like loads. Integrate these tools via CLI or APIs, allowing pipeline scripts to trigger tests, collect real-time results, and feed them into dashboards or alerting systems. Maintain test scripts in source control alongside your code for traceability and versioning.
Recommended Tools and Automation Patterns
- LoadFocus: Cloud-based, integrates with CI/CD, supports JMeter scripts, provides real-time dashboards.
- JMeter: Open-source, flexible, ideal for custom load patterns; can run headless as part of automated builds.
- Postman/Newman: Useful for lightweight functional and performance checks; ideal for teams already using Postman collections.
- Katalon/ReadyAPI: Comprehensive for teams needing integrated test management and advanced reporting.
Consider running a minimal set of performance tests on every commit and reserving “soak” or endurance tests for off-peak hours. Use pipeline stages for parallel test execution and ensure failures trigger actionable notifications. This discipline distinguishes high-functioning DevOps teams.
Potential Limitations and Caveats
While embedding API performance tests in CI/CD is powerful, it introduces new pipeline complexity. Long-running load tests can slow feedback loops, and test environments may not perfectly mimic production traffic. Test flakiness – caused by network instability or misconfigured test data – can also occur. To mitigate, regularly review test scripts for relevance and use environment-specific baselines rather than hardcoded thresholds.
Not every team needs the same approach or toolset. Choose solutions that fit your stack, expertise, and business goals to ensure continuous performance testing is an asset, not a bottleneck.
Prioritize High-Impact Endpoints and Scenarios
Why Targeting Matters in API Performance Testing
When you set out to optimize API performance testing, testing every endpoint in every scenario wastes time and resources. The smarter approach is to focus on the highest-traffic and most business-critical APIs, using analytics to drive priorities.
Identifying High-Impact Endpoints with Real Data
Start by analyzing your API analytics. Identify endpoints that handle the bulk of user traffic – such as authentication, checkout, or core data retrieval. For example, an e-commerce platform’s /cart and /checkout endpoints are far more critical than niche reporting APIs. By focusing on these, you’ll catch issues that could cripple your app if left unchecked.
Review request counts, error rates, and latency metrics over a typical week. If an endpoint accounts for a large share of API calls, it’s a prime candidate for performance scrutiny. Combine this with business logic: a low-volume endpoint that handles payment processing can be just as critical as a high-traffic public feed.
Before/After: Generic Coverage vs. Targeted Testing
| Before: Broad, Unfocused Testing | After: Targeted, High-Impact Testing |
|---|---|
|
|
The targeted approach delivers faster feedback, uncovers high-impact bugs, and allows you to iterate on performance where it matters most.
Balancing Coverage with Speed: The Trade-Off
Reducing test duration by skipping low-traffic endpoints can mean missing obscure issues. For example, a seldom-used reporting API could break under specific load patterns and go unnoticed until a key client relies on it. If you anticipate a spike on a legacy endpoint or new feature, temporarily add it to your high-impact list. Otherwise, let analytics and business logic guide your focus each sprint.
This targeted mindset not only speeds up testing, it also aligns performance goals with business impact.
Optimize Test Data and Payload Sizes for Realistic Load
Strip the Fat: Why Payload Size Matters
To optimize API performance testing, the size and structure of your test data are crucial. Oversized payloads slow test cycles, inflate resource usage, and obscure true bottlenecks. If your test suite sends bloated JSON or XML, you’re not just wasting compute – you’re masking real issues.
The solution is to minimize payloads without making them unrealistic. Use only required and commonly used optional fields. For example, if most API calls use five out of fifteen possible parameters, tailor your test data accordingly.
Representative Samples Over Random Data
Random data generation rarely matches real-world usage. Representative data samples are essential for uncovering performance issues that affect users. Analyze production logs to determine typical payload shapes and sizes. If your ecommerce API’s average request body is 1.5KB, test with similar sizes unless targeting edge cases.
Tools like LoadFocus, JMeter, and Postman make it straightforward to import or simulate real payloads. Mirroring actual usage reveals slowdowns that matter, such as response time spikes when optional fields are included.
Save Time with Compression and Data Pruning
For performance-focused runs, compressing payloads and pruning unnecessary data can accelerate large-scale tests. Gzip or Brotli are standard for API payloads, and most platforms support them. This not only speeds up test cycles but also surfaces issues with server-side decompression or content negotiation.
Don’t Over-Minimize – Caveats and Edge Cases
Overly minimal test data can miss edge cases – such as maximum field lengths or deeply nested objects. These are rare, but when they occur, performance can degrade sharply. The best approach combines realistic, lightweight tests with periodic “worst-case” payloads to catch outliers.
By structuring test data for realism and efficiency, you accelerate feedback loops and maintain accuracy. This approach surfaces insights that genuinely improve user experience.
Run Parallel and Distributed Test Executions
Running API performance tests in parallel – locally or across distributed cloud nodes – can reduce test time from hours to minutes. When you optimize API performance testing for large-scale applications, this approach is transformative. You’re no longer limited by single-threaded runs or overnight batch jobs. Instead, you can launch dozens of test executions simultaneously, surfacing bottlenecks before they reach production.
Cloud-based platforms like LoadFocus make this accessible even for small teams. You can run complex JMeter scripts across multiple cloud machines, simulating thousands of users hitting your API endpoints at once. This level of concurrency is essential for mimicking real-world usage, especially for APIs serving global audiences or supporting microservices architectures.
- Accelerates feedback by generating high, sustained traffic loads in parallel
- Exposes race conditions and concurrency bugs that serial tests will never catch
- Enables scaling experiments to test auto-scaling policies, caching effectiveness, and rate limiting at production volumes
However, parallel and distributed execution introduces resource contention risks – overloading your infrastructure can skew results or disrupt shared environments. Infrastructure costs also rise as you scale out cloud nodes, so monitoring spend is critical. Technical complexity increases: orchestrating tests across multiple environments means more scripts and a higher risk of configuration drift. This approach is best suited for:
- High-traffic APIs that must handle spikes and sustained volume
- Teams with mature DevOps processes and automated pipelines
- Organizations willing to invest in cloud resources for speed and thoroughness
Managing Result Aggregation and Consistency
One challenge with distributed API performance tests is aggregating results into a single, reliable report. Each node generates its own logs and metrics – response times, error rates, throughput – that must be combined without losing detail. Simply averaging numbers can hide outliers or spikes that occurred on specific nodes.
The most reliable method is to use centralized result collectors or dashboards that ingest raw data from all test instances in real time. Platforms like LoadFocus provide built-in aggregation, allowing you to compare percentile response times and detect error bursts across the entire test run. For open-source tools, exporting results in standardized formats and running custom aggregation scripts is common. Maintaining consistency in metric definitions and timestamps is essential to avoid misleading trends.
As you increase parallelism, watch for clock drift and time zone mismatches, which can introduce subtle errors. Always verify distributed results before drawing conclusions, and rerun tests if aggregation issues arise. When done right, parallel execution delivers actionable insights quickly, helping you optimize API performance testing at scale.
Use Real-World Load Patterns and Traffic Simulations
Why Synthetic Loads Miss the Mark
Most teams start with a steady, uniform load when optimizing API performance testing. It’s straightforward to script and interpret, but real user traffic isn’t steady. APIs experience unpredictable bursts, spikes, and lulls. Relying solely on flat load profiles can obscure the bottlenecks that cause slowdowns or outages during traffic surges.
For example, a finance API might see transaction volume triple at market open and close. E-commerce platforms often face traffic spikes during flash sales or promotions. If your performance tests don’t simulate these patterns, you’re missing the scenarios most likely to stress your infrastructure.
Types of Load Patterns That Reveal the Truth
To uncover real-world performance issues, you need a mix of realistic load simulations. Here’s how the most effective patterns compare:
| Load Pattern | Description | Best Use Case | Limitation |
|---|---|---|---|
| Spike | Sudden increase from baseline to peak traffic in seconds | Testing incident response, autoscaling triggers, and rate limiting | Can produce false positives if not calibrated to real traffic bursts |
| Ramp | Gradually increases request rate over time | Validating performance under scaling adoption or seasonal growth | Requires longer test durations and careful metric tracking |
| Steady | Constant traffic at a fixed, predictable rate | Baseline measurements, regression detection, SLA verification | Misses intermittent issues linked to changing loads |
| Random/Burst | Irregular, unpredictable surges and drops in traffic | Simulating real user behavior and uncovering concurrency flaws | Harder to reproduce and debug issues from unpredictable sequences |
Practical Impact: Bottlenecks Uncovered, Not Just Theorized
Using spike and burst patterns reveals rate limiting thresholds and autoscaling misfires that steady loads miss. Ramp patterns often expose memory leaks or resource starvation. Steady-state tests help track baseline response times but rarely catch concurrency issues.
Tools like LoadFocus make it possible to create these scenarios in the cloud, tracking response time percentiles, error spikes, and resource utilization as tests unfold. The result is a more accurate map of your API’s breaking points than legacy approaches provide.
Limitation: Realism Comes at the Cost of Complexity
Designing realistic load scenarios requires more time and expertise. You’ll need to analyze production traffic, configure scripts for spikes or randomness, and interpret more complex metric patterns. Some failures will be harder to reproduce, especially with random loads. The extra effort pays off by exposing vulnerabilities that steady-load testing misses, but expect a steeper learning curve as you strive to truly optimize API performance testing for real users.
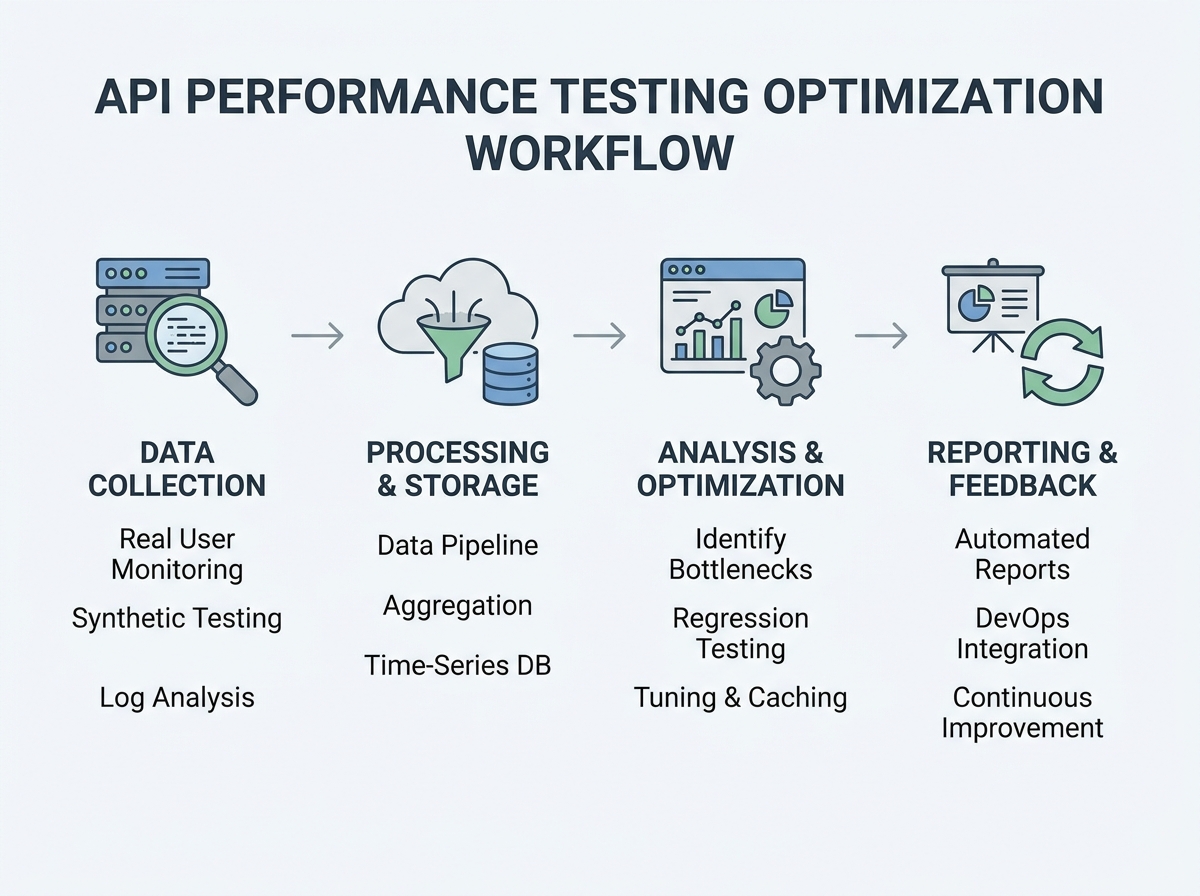
Monitor Key Performance Metrics Continuously
To truly optimize API performance testing, move beyond periodic spot checks. Continuous monitoring of critical metrics is essential for catching issues early and understanding how your API handles real-world stress. It’s not enough to test once and hope for the best. You need ongoing visibility into how things are running, especially after new code is deployed.
Track the essentials: response time (latency), error rate, throughput (requests per second), and resource usage. Each metric provides unique insights. Slow response times indicate backend bottlenecks, error rate spikes signal breaking points, and throughput shows your API’s scalability. Resource metrics (CPU, memory, network) reveal infrastructure constraints. Advanced indicators like percentile response times (p95, p99), time to first byte (TTFB), and overall availability help spot outlier slowdowns and maintain a strong user experience as traffic patterns shift.
Continuous monitoring isn’t about collecting every possible data point. Too much data leads to overload. Prioritize metrics aligned with your business goals. For example, if uptime is critical for your SLA, set up alerts for availability drops and error spikes. If user experience is the priority, focus on latency and p99 response times.
Key Insight: The value of API performance metrics comes from tracking trends over time, not just reacting to isolated spikes or dips.
Visualizing Performance Trends
Numbers alone don’t tell the whole story. To spot patterns, use visual dashboards and trend charts that map key metrics over time. Platforms like LoadFocus provide real-time graphs for response time, error rate, and throughput. For example, you can visualize a jump in 500 errors after a deployment or see how response times degrade during traffic surges.
Effective dashboards let you overlay multiple metrics – such as CPU usage and error rate – on a single timeline. This helps isolate root causes. If latency climbs alongside memory consumption, you have a clear lead on where to investigate. Highlight anomalies with thresholds and color coding. Over longer periods, trend analysis becomes your early warning system. Spotting a gradual increase in average response time over weeks allows you to address inefficiencies before users notice. Use historic trend data to set realistic performance budgets and forecast scaling needs.
One caution: dashboards are only as useful as the signals they highlight. Avoid clutter. Curate visualizations so teams see what matters – outliers, regressions, and actionable patterns – rather than chasing every minor fluctuation. The goal is clarity, not quantity.
Optimize Database Operations and Backend Dependencies
Teams seeking to optimize API performance testing often overlook the backend systems powering their endpoints. It’s not enough to tune front-end code – slow database queries, overloaded connections, and missing cache layers can turn even the fastest APIs into bottlenecks. If your performance metrics – like response time, throughput, or error rates – aren’t where they should be, the backend is often the culprit.
Query optimization is a key starting point. Poorly constructed SQL or unindexed tables can choke under load. For example, a broad “SELECT *” on a large table might be fine in staging, but will slow response times in production. Instead, filter results with specific columns and efficient WHERE clauses. Add indexes on high-traffic columns, but avoid excessive indexing, which can slow down writes.
Next, address connection pooling. Opening a new database connection for every API call creates overhead. With pooling, connections are reused, reducing latency during peak loads and minimizing “too many connections” errors in stress tests.
Caching Strategies for Faster API Responses
Effective caching can provide immediate speed boosts. At the application level, keep frequently accessed data – such as user profiles – in memory using tools like Redis or Memcached. This reduces repeat database queries and keeps response times low. HTTP caching uses headers like Cache-Control or ETag so clients and proxies can reuse responses for identical requests. This is essential for endpoints with rarely changing data, such as product catalogs.
Some teams add a CDN layer to cache responses closer to users. For read-heavy APIs serving global audiences, this can reduce response time significantly. However, caching isn’t a universal solution. Dynamic endpoints, such as order processing, require strategies like short-lived cache expiration or selective cache busting to avoid serving outdated data.
Optimizing backend operations can yield measurable improvements in your API performance test results. These gains often require backend code changes or schema updates, so close coordination with backend engineers is crucial. For teams working with legacy systems or third-party databases, not every fix is feasible. Still, the payoff – faster APIs and fewer timeouts – makes backend optimization worthwhile.
Select the Right API Performance Testing Tools
Overview of Top API Performance Testing Platforms
Choosing the right tool to optimize API performance testing is about matching your stack and workflow to the platform’s strengths. With APIs handling everything from payments to integrations, effective performance testing is essential. The landscape is crowded, but a few platforms stand out.
Postman has evolved beyond basic functional testing. Its Collection Runner and Monitor features can simulate API calls at scale, making it popular for quick, scriptable checks. Postman’s strength is ease of use and team collaboration, not heavy load generation.
JMeter is the go-to for custom, large-scale load testing. With support for multiple protocols, JMeter is ideal for engineering teams needing deep control over test plans. The learning curve is real, but the flexibility pays off for complex scenarios.
LoadFocus offers cloud-first simplicity. You can spin up distributed load tests in minutes, with real-time metrics and easy CI/CD integration. LoadFocus also supports JMeter scripts, allowing teams to scale existing workflows.
Other tools fill important gaps. SoapUI and ReadyAPI excel for SOAP and REST endpoints, especially when advanced assertion logic is needed. Katalon is well-suited for teams seeking automation-friendly scripting with built-in analytics.
Feature Comparison and Best-Fit Scenarios
No single platform fits every project. Here’s a side-by-side table to help you choose based on your real needs:
| Tool | Supported Protocols | Key Features | Best Use Case | Pricing |
|---|---|---|---|---|
| Postman | REST, GraphQL, WebSockets | Collection Runner, Monitors, Collaboration, API Mocking | Quick API checks, team collaboration, lightweight load | Free (basic), Pro ($12/user/mo), Enterprise |
| JMeter | HTTP(S), FTP, JDBC, MQTT, SOAP, REST | Custom scripting, Distributed load, Detailed reporting | Complex, high-volume load tests, protocol diversity | Free, Open Source |
| LoadFocus | HTTP(S), REST, SOAP (via JMeter) | Cloud-based load, Real-time analytics, JMeter integration, Website monitoring | Cloud load, rapid scaling, CI/CD integration | Free tier, Paid plans from $25/mo |
| SoapUI | SOAP, REST, HTTP(S), JMS | Functional & performance tests, Advanced assertions | Enterprise SOAP/REST APIs, combined functional and load | Open Source, ReadyAPI (Paid) |
| Katalon | REST, SOAP, HTTP(S) | Automation scripting, Built-in analytics, CI/CD ready | Automated API testing in CI pipelines | Free, Studio Enterprise (Paid) |
| ReadyAPI | REST, SOAP, HTTP(S), JMS | Performance, security, and functional testing, Data-driven tests | Enterprise-grade API performance and security | Paid (starts at $759/year) |
No One-Size-Fits-All: Tool Selection Depends on Project Requirements
The team’s expertise, protocols in use, and required test coverage all dictate which platform will help you optimize API performance testing. For example, if your stack is microservices-heavy and you run tests in CI/CD, a cloud-centric tool like LoadFocus or Katalon offers speed and integration that desktop tools can’t match. If you’re working with legacy SOAP endpoints, SoapUI or ReadyAPI may be a better fit.
No tool is a silver bullet. Even the most feature-rich platform can’t compensate for poorly designed test scenarios or ignored bottlenecks. Evaluate tools based on your actual bottlenecks, not just a checklist of features, and revisit your choice as your API ecosystem evolves.
How to Choose: Decision Framework for Optimizing API Performance Testing
Balancing Trade-offs: Speed, Accuracy, and Coverage
There’s no universal recipe for how to optimize API performance testing. The best approach depends on your team’s structure, skills, and business needs. Teams with mature automation practices can benefit from CI/CD integration, while smaller or less experienced groups may need to focus on refining test scenarios and using simpler tools.
Budget and timeline are equally important. A startup racing toward launch will prioritize speed and core endpoint coverage, while an established SaaS provider with global customers will value accuracy and stress coverage, accepting longer test cycles if it means catching rare, high-impact failures. The right mix is always about priorities. If you’re unsure, ask: do you need fast feedback, deep diagnostics, or a balance of both?
Key Factors to Weigh
- Team expertise: Are you staffed for scripting custom load scenarios, or do you need a low-code platform?
- Automation maturity: Can you integrate performance tests into your CI/CD pipeline, or are tests still manual?
- Budget constraints: Is it feasible to invest in platforms with advanced analytics, or do you need open-source basics?
- Business goals: Will performance bottlenecks directly impact revenue or user satisfaction?
Decision Matrix: Aligning Strategies with Team Scenarios
| Team Scenario | Recommended Strategies | Rationale |
|---|---|---|
| Small Dev Team, Limited Experience | Cloud testing tools (e.g., LoadFocus), prioritize top 5 endpoints, use built-in reports | Maximizes ROI without overwhelming the team. Focuses on business-critical APIs and leverages easy-to-use platforms. |
| Mid-Size Team, Moderate Automation | Integrate performance tests into CI/CD, use JMeter scripts, automate test triggers for releases | Balances speed and depth. CI/CD integration ensures that regressions are caught early, without manual effort. |
| Large Enterprise, High Automation | Distributed load testing, simulate real-world traffic patterns, continuous monitoring, optimize database operations | Supports complex microservices architectures. High-traffic systems require robust, automated load and stress tests. |
| Startup, Tight Timeline | Quick baseline tests on critical endpoints, monitor live metrics, use SaaS tools for rapid setup | Prioritizes speed and simplicity, enabling rapid iteration without sacrificing visibility into show-stopping issues. |
| Legacy Systems, Limited Automation | Manual test execution, focus on optimizing payload size and slowest database queries, monitor error rates | Addresses bottlenecks with minimal tooling investment. Manual tests spotlight the most common failure points. |
Every team faces unique constraints, but the decision matrix above helps you prioritize strategies that fit your situation. When you know your strengths and limits, you can optimize API performance testing efficiently and effectively.
Frequently Asked Questions About API Performance Testing Optimization
What are the most important metrics to track when optimizing API performance testing?
Response time, throughput (requests per second), and error rates are essential. Teams should also monitor resource utilization (CPU, memory), availability, and time to first byte (TTFB). Tracking percentile response times (such as p95 or p99) helps reveal outliers that average metrics can hide. If your API averages 250ms per request but spikes to 2 seconds during peak traffic, you have a scalability issue to address.
How do you ensure API performance tests reflect real-world usage?
Uniform, steady loads rarely match real user traffic. To optimize API performance testing for production reality, simulate a mix of traffic patterns – bursts, spikes, and lulls. Use historical traffic logs to model request rates and payload types. Testing with these patterns helps uncover bottlenecks that flat loads would miss. Cloud testing platforms like LoadFocus make it easier to run distributed tests that mirror genuine user behavior.
How often should you run API performance tests?
For high-impact APIs, continuous testing is the new standard. Embedding performance tests in your CI/CD pipeline ensures every build is validated for speed and stability before deployment. This approach catches regressions early. If you push code weekly, your performance tests should run at least as often.
What are common mistakes teams make when trying to optimize API performance testing?
- Testing every endpoint equally instead of targeting high-traffic or business-critical APIs.
- Using synthetic payloads that don’t represent real production data, leading to misleading results.
- Ignoring backend dependencies like databases or third-party services that often become hidden bottlenecks.
- Relying on averages rather than percentile metrics, which can mask performance outliers.
Avoiding these pitfalls means focusing on what genuinely impacts user experience and business outcomes. For instance, a payment API with a 1% error rate during peak load can cause significant revenue loss, even if the rest of the system performs well.
How do modern API performance testing tools differ, and does the choice matter?
The choice of tool matters. Tools like JMeter excel at high-volume load testing and complex scripting. Postman is strong for automated functional tests and quick iterations. LoadFocus, as a cloud-based platform, emphasizes scalability and real-time analytics without infrastructure overhead. The right platform should fit your stack, test complexity, and team expertise. Forcing a tool that doesn’t align with your workflow usually results in incomplete test suites.
Is it enough to only test the API endpoints themselves?
No. Backend systems – databases, caches, and third-party dependencies – often dictate overall performance. Optimizing API code won’t help if slow SQL queries or unoptimized indexes are the true bottleneck. Teams should monitor end-to-end latency and profile backend resource usage during tests. Sometimes, improving database response time does more for user experience than refining API application code.
How do you keep performance test data and payload sizes realistic?
Use real-world data samples whenever possible. If not feasible, mirror the structure and size of typical production payloads. Oversized test data slows results and inflates resource consumption, while tiny, unrealistic payloads can give a false sense of speed. The goal is to reflect what your API handles in production, not just what’s easy to script.
What’s the business case for investing in API performance testing optimization?
Slow APIs drive users away and increase the risk of outages during traffic spikes. For SaaS companies, every second of latency or minute of downtime can mean lost revenue and reputational harm. Optimizing API performance testing prevents these issues by catching problems before they reach production. The investment pays off in customer retention, fewer incidents, and less firefighting by engineering teams.
Optimizing API performance testing is a continual process. As API ecosystems grow and evolve, so do user expectations and traffic patterns. The most effective teams treat performance testing as a living discipline – one that adapts along with the business it supports.