Performance testing is more critical than ever. Whether you’re dealing with complex microservices architectures or distributed web applications, ensuring your systems perform under load is essential. Traditionally, using Apache JMeter meant downloading, installing, and manually configuring tests on your local machine. However, with the advent of cloud-based solutions, there’s now an easier, more efficient way to record browser interactions and generate JMeter test scripts – all without installing JMeter locally.
Why the LoadFocus Chrome Extension?
The LoadFocus | JMeter Load Testing in the Cloud Chrome Extension offers a modern approach to performance testing. This free tool lets you:
Is Your Infrastructure Ready for Global Traffic Spikes?
Unexpected load surges can disrupt your services. With LoadFocus’s cutting-edge Load Testing solutions, simulate real-world traffic from multiple global locations in a single test. Our advanced engine dynamically upscales and downscales virtual users in real time, delivering comprehensive reports that empower you to identify and resolve performance bottlenecks before they affect your users.
- Record Tests Instantly: Capture HTTP/S requests, JavaScript, CSS, cookies, images, and more directly from your browser.
- Generate Test Scripts: Automatically create JMeter test files (.JMX) or JSON files with just a few clicks.
- Cloud Execution: Run your tests in the cloud with thousands of virtual users from multiple global locations.
- Simplify Workflow: Eliminate the need for cumbersome local installations, making it perfect for agile teams and DevOps pipelines.
Industry Insight:
With the rise of cloud computing and continuous integration/continuous deployment (CI/CD) practices, there’s a significant trend toward shifting performance testing from traditional local environments to scalable cloud-based solutions. This approach not only speeds up testing cycles but also provides more realistic simulations of global traffic loads.
Getting Started
Follow these simple steps to start recording your JMeter tests with the LoadFocus Chrome Extension:
- Install the Extension:
Visit the Chrome Web Store and add the LoadFocus | JMeter Load Testing in the Cloud extension to your Chrome browser. - Account Setup:
Sign in to your LoadFocus account. If you don’t have one, you can create an account for free. - Alternative Installation:
If you cannot access the Chrome Web Store, download the CRX file and follow this guide to install the extension manually.
Recording a JMeter Test
The extension makes it simple to record your web interactions:
- Start Recording:
Click the “Record JMeter test” button. You’ll see a “Recording” indicator at the top right of your browser. - Initiate Your Workflow:
Navigate to your website by entering its URL (e.g.,https://example.com) in the browser. All interactions are captured automatically. - Stop Recording:
When you’ve completed your workflow, stop the recording. The extension icon will update to “Done”. - Filtering Requests:
Customize your recording by selecting specific request types (HTTP/S, JavaScript, CSS, Cookies, Images, or Others) so that only the desired traffic is captured.
Pro Tip:
Using selective recording helps reduce noise in your test script, making it easier to focus on the performance-critical parts of your application.
Visual Guide to Recording
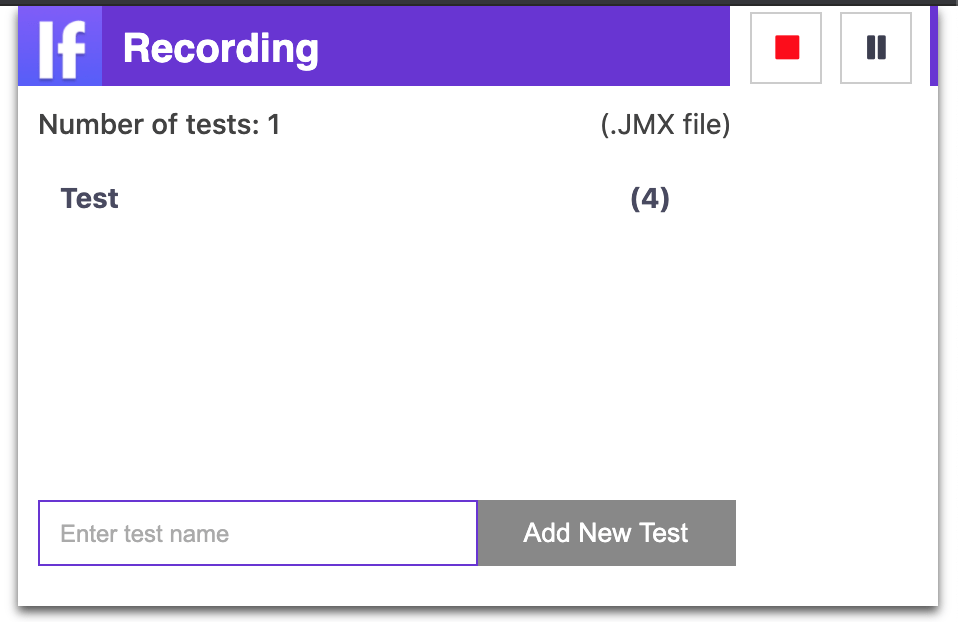
Recording your JMeter test
Think your website can handle a traffic spike?
Fair enough, but why leave it to chance? Uncover your website’s true limits with LoadFocus’s cloud-based Load Testing for Web Apps, Websites, and APIs. Avoid the risk of costly downtimes and missed opportunities—find out before your users do!
Editing the Recorded Test
Once recorded, you can fine-tune your test script:
- Edit the Test:
Click the “Edit” button next to your test name. Change the test name, reorder requests via drag-and-drop, or modify individual request details such as URL, headers, and methods. - Advanced Modifications:
Insert, duplicate, or remove specific requests to tailor the test to your exact requirements. - Export Options:
Export your modified test script as a JMX or JSON file for further customization or for integration into your continuous testing pipelines.
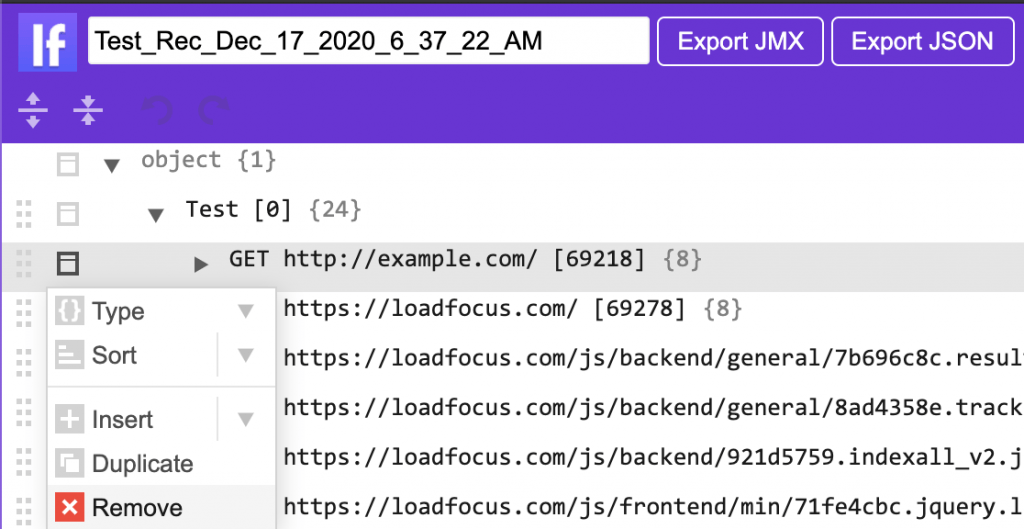
Edit Recorded test by Inserting, Duplicating or Removing Requests
Downloading and Running Tests
Downloading the .JMX File
- Click the “Download JMeter test” button.
- Choose the domains to include if your test contains requests from multiple domains.
- Save the generated .JMX file locally.
Running Your Test in the Cloud
To take advantage of cloud testing:
- Execute in the Cloud:
Click “Run JMeter Test” to launch the test on LoadFocus’s cloud infrastructure. - Upload Option:
Alternatively, upload your JMX file manually. - Configure Test Parameters:
Set the number of virtual users, duration, ramp-up period, and ramp-up steps. - Monitor Live Results:
Execute the test and view real-time performance metrics, interactive charts, and detailed logs.
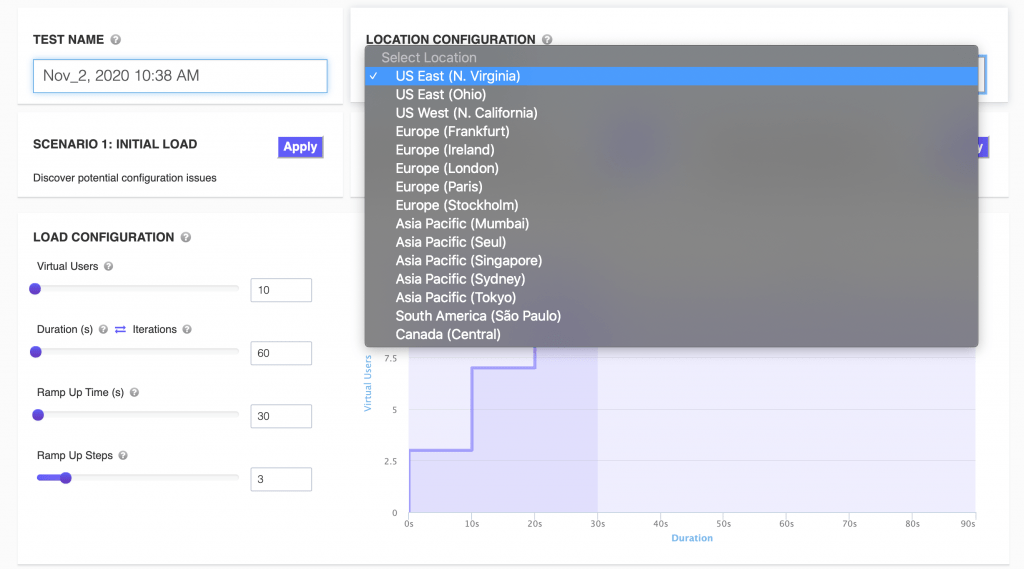
Run JMeter Load Test from multiple locations with JMeter Load Testing
LoadFocus is an all-in-one Cloud Testing Platform for Websites and APIs for Load Testing, Apache JMeter Load Testing, Page Speed Monitoring and API Monitoring!
Viewing Previous Test Results
Easily keep track of your testing history:
- History Access:
Click the “View Previous Test Runs” button to see a list of all your past tests. - Detailed Analysis:
For deeper insights, click “View Details” to examine interactive charts, error logs, and performance snapshots.
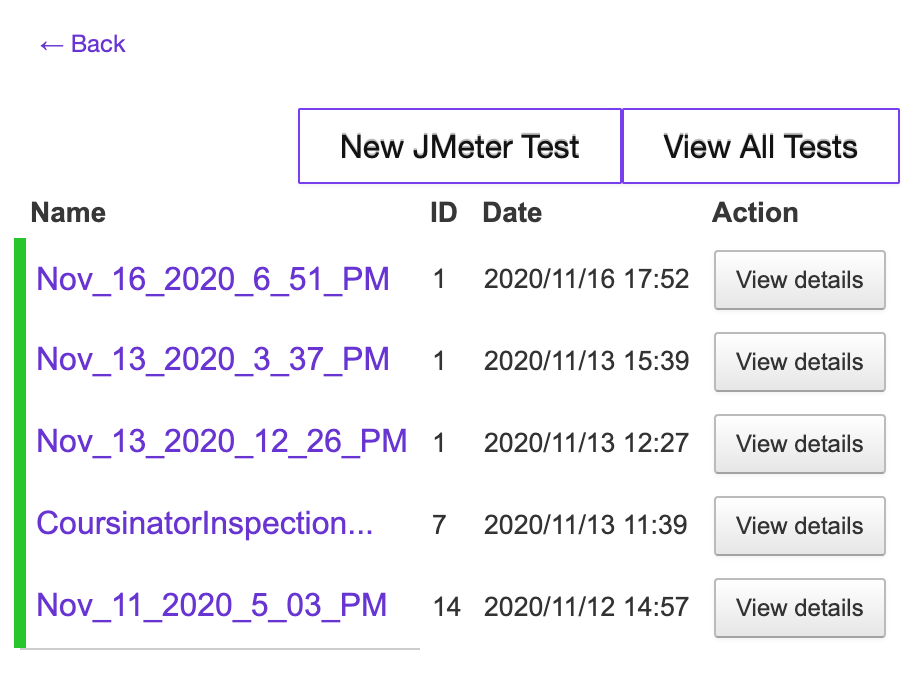
Previous Test Runs with LoadFocus
Emerging Trends & News in Load Testing
The landscape of performance testing is evolving rapidly. Here are some key trends and news highlights:
- Cloud-Native Load Testing:
Organizations are increasingly moving to cloud-based load testing to simulate real-world traffic from various global locations. This approach provides scalability and eliminates the overhead of managing local testing environments. - Integration with DevOps & CI/CD Pipelines:
Automated performance testing is now a core component of continuous integration and deployment. Modern load testing tools, like the LoadFocus platform, are being integrated directly into DevOps workflows, allowing teams to detect performance issues early in the development cycle. - Containerized & Serverless Environments:
With the rise of microservices and container orchestration platforms like Kubernetes, load testing tools are adapting to test dynamic, ephemeral environments. Tools are now available that can spin up load generators on-demand in containerized environments. - Real-Time Analytics and Advanced Reporting:
Recent advancements in performance testing platforms have introduced real-time analytics, AI-driven insights, and more comprehensive reporting features. These innovations help teams quickly identify bottlenecks and optimize performance before issues affect end users. - Broader Protocol Support:
Beyond traditional HTTP/S testing, modern tools are expanding support to include protocols relevant to today’s applications, such as WebSocket, MQTT, and even API testing, ensuring comprehensive coverage.
Latest News:
LoadFocus is continuously innovating, with recent updates featuring improved real-time monitoring and enhanced integration capabilities with other cloud services. This is part of a broader trend where load testing solutions are evolving to meet the demands of modern, distributed applications.
Frequently Asked Questions (FAQ)
1. How to record the JMeter script?
To record a JMeter script, you can use tools that capture browser interactions. For example, the LoadFocus Chrome Extension lets you start recording with a single click, capture your web workflow, and then automatically generate a JMX file. Other options include using proxy-based tools or plugins to capture HTTP/S traffic and convert it into a JMeter script.
2. How to record the script in JMeter tool in Chrome browser?
Recording a script in Chrome is simple with dedicated extensions. With the LoadFocus extension:
- Install the extension from the Chrome Web Store.
- Click “Record JMeter test” and perform your actions in the browser.
- Stop the recording when finished, and your interactions will be saved as a JMX file. This process eliminates the need for manual test script creation and allows for quick adjustments.
3. How to record a script in JMeter with Fiddler?
Fiddler is a powerful web debugging proxy that can capture HTTP/S traffic:
- Launch Fiddler and configure it to capture traffic from your browser.
- Perform the desired actions on your website.
- Save the session as a HAR (HTTP Archive) file.
- Use conversion tools (or manually extract the necessary details) to transform the HAR data into a JMeter (.JMX) script.
4. How to capture logs in JMeter?
JMeter has built-in logging capabilities:
- The JMeter GUI displays logs in real-time, and detailed logs are saved in the jmeter.log file within your JMeter directory.
- You can adjust logging levels by modifying the log4j2.xml configuration file.
- Additionally, using listeners such as View Results Tree can help capture and inspect logs during test execution.
5. How to capture API response in JMeter?
Capturing API responses in JMeter is essential for verifying performance and correctness:
- Use the View Results Tree listener to inspect the response data for each sampler.
- Implement post-processors like the JSON Extractor or Regular Expression Extractor to extract specific values from the API response.
- Additionally, the Debug Sampler can provide insights into the API’s full response during test runs.
Conclusion
The LoadFocus Chrome Extension revolutionizes how you conduct JMeter load testing by simplifying the recording process and enabling seamless cloud execution. This tool not only saves time and resources but also aligns with the latest trends in cloud-native testing and DevOps integration. Whether you’re a seasoned performance engineer or just starting out, this extension provides a powerful, user-friendly solution to ensure your web applications perform at their best under load.
For more information and to install the extension, visit the Chrome Web Store.