Optimisation de votre tableau de bord unifié pour une prise de décision plus rapide
Ce modèle vise à améliorer votre tableau de bord de surveillance unifiée des API, permettant une analyse et une prise de décision plus rapides pour vos…
What is Optimizing Your Unified Dashboard for Faster Decision-Making?
This template focuses on refining your unified API monitoring dashboard to streamline decision-making processes. The objective is to consolidate key performance metrics and insights into a single interface, allowing teams to respond swiftly to API performance issues.
When we talk about optimizing a dashboard, we refer to enhancing its usability and effectiveness in presenting necessary data that drives decisions. A well-optimized dashboard can significantly reduce the time spent on analysis, allowing teams to focus on action rather than interpretation.
Key Components of a Unified Dashboard
A unified API monitoring dashboard should include several crucial elements:
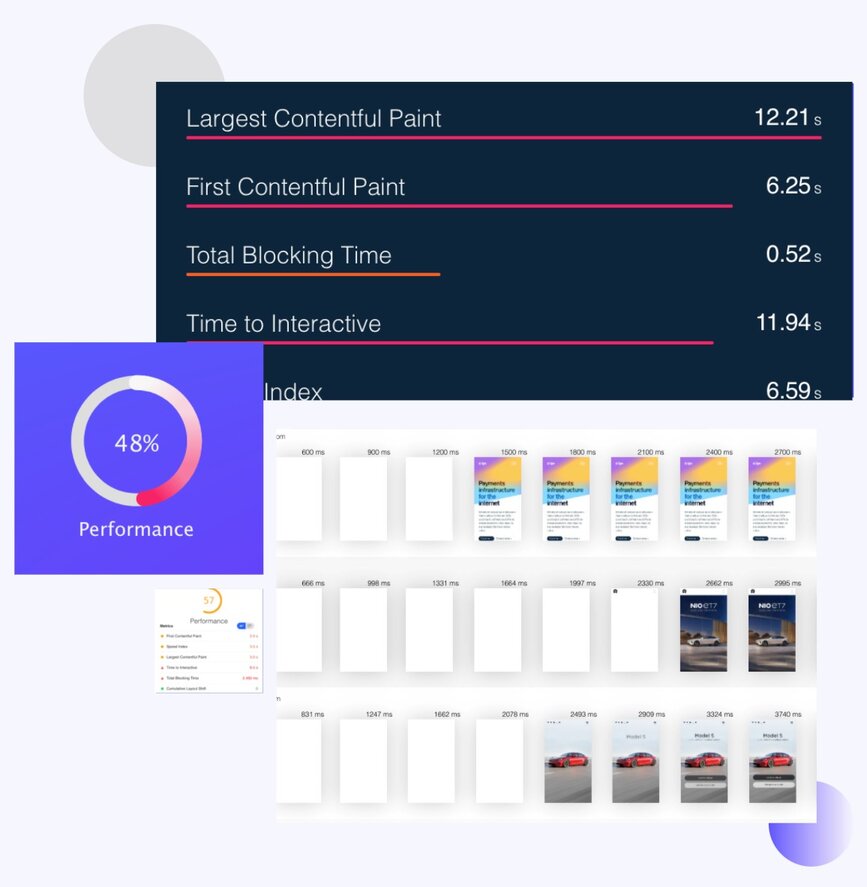
- Real-Time Metrics: Display response times, uptime, and error rates in real-time to ensure immediate awareness of API performance.
- Alerts and Notifications: Integrate alerting mechanisms to promptly notify teams of any performance degradation or issues, allowing rapid response.
- Historical Data Trends: Include historical data visualization to identify patterns and forecast potential issues based on past performance.
- User Interaction Analytics: Track how users interact with APIs, providing insights into usage patterns that can inform optimization efforts.
Relation to API Monitoring Tools
With a tool like LoadFocus API Monitoring, you can easily implement this template. LoadFocus offers robust features that facilitate real-time monitoring and reporting, enabling you to populate your dashboard with relevant metrics effortlessly. The service allows for comprehensive monitoring setups that can be customized to fit various API architectures, ensuring that your dashboard reflects the most critical information needed for efficient decision-making.
FAQ on Optimizing Your Unified Dashboard
What are the benefits of a unified dashboard?
A unified dashboard provides a centralized view of API performance metrics, enabling faster problem resolution and enhanced insights for strategic decisions.
How do I integrate alerting in my dashboard?
Integrate alerting by connecting your monitoring tool's notification system to your dashboard, allowing for real-time updates on performance issues.
Can I track historical data trends?
Yes, most monitoring tools, including LoadFocus, allow you to visualize historical data trends on your dashboard to aid in analysis and forecasting.
How does API monitoring improve decision-making?
API monitoring provides timely data and insights that facilitate informed decision-making, allowing teams to address issues proactively and optimize performance.
Quelle est la vitesse de votre site web?
Augmentez sa vitesse et son référencement naturel de manière transparente avec notre Test de Vitesse gratuit.Vos outils de test ne suivent plus ?
Testez la charge de vos sites web et APIs depuis 25+ régions cloud, surveillez la vitesse des pages et la disponibilité, et recevez des analyses AI qui expliquent vos résultats clairement.Commencez à tester maintenant→